Time-series data is a highly valuable asset that you can use for various applications, including trending, monitoring, and machine learning. You can generate time-series data from server infrastructure, application code, and other sources. OpenTSDB can collect and retain large amounts of time-series data with a high degree of granularity.
This guide shows software engineers and architects how to create a scalable collection layer for time-series data by using GKE. It also shows how to work with the collected data by using Bigtable. This guide assumes that you are familiar with Kubernetes and Bigtable.
The following diagram shows the high-level architecture of this guide:

The preceding diagram shows multiple sources of time-series data, such as IoT events and system metrics, that are stored in Bigtable by using OpenTSDB deployed on GKE.
Objectives
- Build container images used in this guide using Cloud Build.
- Manage these container images using Artifact Registry.
- Create a Bigtable instance.
- Create a GKE cluster.
- Deploy OpenTSDB to your GKE cluster.
- Send time-series metrics to OpenTSDB.
- Visualize metrics using OpenTSDB and Grafana.
Costs
In this document, you use the following billable components of Google Cloud:
To generate a cost estimate based on your projected usage,
use the pricing calculator.
When you finish the tasks that are described in this document, you can avoid continued billing by deleting the resources that you created. For more information, see Clean up.
Before you begin
-
In the Google Cloud console, on the project selector page, select or create a Google Cloud project.
-
Make sure that billing is enabled for your Google Cloud project.
-
Enable the Bigtable, Bigtable Admin, GKE, Compute Engine, Cloud Build, and Artifact Registry APIs.
In the Google Cloud console, go to the Welcome page.
Make a note of the project ID because it's used in a later step.
-
In the Google Cloud console, activate Cloud Shell.
Create a Bigtable instance
This guide uses Bigtable to store the time-series data that you collect, so you must create a Bigtable instance.
Bigtable is a key/wide-column store that works well for time-series data. Bigtable supports the HBase API, so you can use software designed to work with Apache HBase, such as OpenTSDB. For more information about the HBase schema used by OpenTSDB, see HBase Schema.
A key component of OpenTSDB is the AsyncHBase client, which enables you to bulk-write to HBase in a fully asynchronous, non-blocking, thread-safe manner. When you use OpenTSDB with Bigtable, AsyncHBase is implemented as the AsyncBigtable client.
This guide uses a Bigtable instance with a single-node cluster. When moving to a production environment, consider using Bigtable instances with larger clusters. For more information about picking a cluster size, see Understanding Bigtable performance.
In Cloud Shell, set the environment variables for your Google Cloud zone where you will create your Bigtable cluster and GKE cluster and the instance identifier for your Bigtable cluster:
export BIGTABLE_INSTANCE_ID=BIGTABLE_INSTANCE_ID
export ZONE=ZONE
Replace the following:
BIGTABLE_INSTANCE_ID: The identifier for your Bigtable instance.ZONE: The zone where your Bigtable cluster and GKE cluster will be created.
The command should look similar to the following example:
export BIGTABLE_INSTANCE_ID=bt-opentsdb
export ZONE=us-central1-f
Create the Bigtable instance:
gcloud bigtable instances create ${BIGTABLE_INSTANCE_ID} \
    --cluster-config=id=${BIGTABLE_INSTANCE_ID}-${ZONE},zone=${ZONE},nodes=1 \
    --display-name=OpenTSDB
Create the images used to deploy and test OpenTSDB
To deploy and demonstrate OpenTSDB with a Bigtable storage backend, this guide uses a series of Docker container images that are deployed to GKE. You build several of these images using code from an accompanying GitHub repository with Cloud Build. When deploying infrastructure to GKE, a container repository is used. In this guide, you use Artifact Registry to manage these container images.
In Cloud Shell, set the environment variables for your Google Cloud zone where you will create your Artifact Registry repository:
export PROJECT_ID=PROJECT_ID
export REGION=REGION
export AR_REPO=AR_REPO
Replace the following:
PROJECT_ID: Your project IDREGION: The region where your Artifact Registry repository will be createdAR_REPO: The name of your Artifact Registry repository
The command should look similar to the following example:
export PROJECT_ID=bt-opentsdb-project-id
export REGION=us-central1
export AR_REPO=opentsdb-bt-repo
Create an Artifact Registry repository:
gcloud artifacts repositories create ${AR_REPO} \
    --repository-format=docker  \
    --location=${REGION} \
    --description="OpenTSDB on bigtable container images"
Create and manage the images used to deploy and demonstrate OpenTSDB
Two Docker container images are used in this guide. The first image is used for two purposes: to perform the one-time Bigtable database setup for OpenTSDB, and to deploy the read and write service containers for the OpenTSDB deployment. The second image is used to generate sample metric data to demonstrate your OpenTSDB deployment.
When you submit the container image build job to Cloud Build, you tag the images so that they are stored in the Artifact Registry after they are built.
In Cloud Shell, clone the GitHub repository that contains the accompanying code:
git clone https://github.com/GoogleCloudPlatform/opentsdb-bigtable.git
Go to the sample code directory:
cd opentsdb-bigtable
Set the environment variables for the OpenTSDB server image that uses Bigtable as the storage backend:
export SERVER_IMAGE_NAME=opentsdb-server-bigtable
export SERVER_IMAGE_TAG=2.4.1
Build the image using Cloud Build:
gcloud builds submit \
    --tag ${REGION}-docker.pkg.dev/${PROJECT_ID}/${AR_REPO}/${SERVER_IMAGE_NAME}:${SERVER_IMAGE_TAG} \
    build
Because you tagged the image appropriately, when the build is complete, the image will be managed by your Artifact Registry repository.
Set the environment variables for the demonstration time series data generation image:
export GEN_IMAGE_NAME=opentsdb-timeseries-generate
export GEN_IMAGE_TAG=0.1
Build the image using Cloud Build:
cd generate-ts
./build-cloud.sh
cd ..
Create a GKE cluster
GKE provides a managed Kubernetes environment. After you create a GKE cluster, you can deploy Kubernetes Pods to it. This guide uses GKE and Kubernetes Pods to run OpenTSDB.
OpenTSDB separates its storage from its application layer, which enables it to be simultaneously deployed across multiple instances. By running in parallel, OpenTSDB can handle a large amount of time-series data.
In Cloud Shell, set the environment variables for the Google Cloud zone where you will create your Bigtable cluster and GKE cluster and the name, node type, and version for your GKE cluster:
export GKE_CLUSTER_NAME=GKE_CLUSTER_NAME
export GKE_VERSION=1.20
export GKE_NODE_TYPE=n1-standard-4
Replace
GKE_CLUSTER_NAMEwith the name of your GKE cluster.The command should look similar to the following example:
export GKE_CLUSTER_NAME=gke-opentsdb
export GKE_VERSION=1.20
export GKE_NODE_TYPE=n1-standard-4
Create a GKE cluster:
gcloud container clusters create ${GKE_CLUSTER_NAME} \
    --zone=${ZONE} \
    --cluster-version=${GKE_VERSION} \
    --machine-type ${GKE_NODE_TYPE} \
    --scopes "https://www.googleapis.com/auth/cloud-platform"
This operation can take a few minutes to complete. Adding the scopes to your GKE cluster allows your OpenTSDB container to interact with Bigtable and Container Registry.
The rest of this guide uses the containers you have just built that are managed by Artifact Registry. The Dockerfile and
entrypointscript used to build the container are located in thebuildfolder of the guide repository.Get the credentials so that you can connect to your GKE cluster:
gcloud container clusters get-credentials ${GKE_CLUSTER_NAME} --zone ${ZONE}
Create a ConfigMap with configuration details
Kubernetes uses the
ConfigMap
to decouple configuration details from the container image in order to make
applications more portable. The configuration for OpenTSDB is specified in the
opentsdb.conf file. A ConfigMap containing the opentsdb.conf file is
included with the sample code.
In this and following steps, you use the GNU envsubst utility to replace
environment variable placeholders in the YAML template files will the respective
values for your deployment.
Create a ConfigMap from the updated
opentsdb-config.yamlfile:envsubst < configmaps/opentsdb-config.yaml.tpl | kubectl create -f -
Create OpenTSDB tables in Bigtable
Before you can read or write data using OpenTSDB, you need to create tables in Bigtable to store that data. To create the tables, you will create a Kubernetes job.
In Cloud Shell, launch the job:
envsubst < jobs/opentsdb-init.yaml.tpl | kubectl create -f -
The job can take up to a minute or more to complete. Verify that the job has completed successfully:
kubectl describe jobs
The output shows that one job has succeeded when
Pods Statusesshows1 SucceededExamine the table creation job logs:
OPENTSDB_INIT_POD=$(kubectl get pods --selector=job-name=opentsdb-init \
                    --output=jsonpath={.items..metadata.name})
kubectl logs $OPENTSDB_INIT_POD
The output is similar to the following:
create 'tsdb-uid',
  {NAME => 'id', COMPRESSION => 'NONE', BLOOMFILTER => 'ROW', DATA_BLOCK_ENCODING => 'DIFF'},
  {NAME => 'name', COMPRESSION => 'NONE', BLOOMFILTER => 'ROW', DATA_BLOCK_ENCODING => 'DIFF'}
0 row(s) in 3.2730 seconds

create 'tsdb',
  {NAME => 't', VERSIONS => 1, COMPRESSION => 'NONE', BLOOMFILTER => 'ROW', DATA_BLOCK_ENCODING => 'DIFF'}
0 row(s) in 1.8440 seconds

create 'tsdb-tree',
  {NAME => 't', VERSIONS => 1, COMPRESSION => 'NONE', BLOOMFILTER => 'ROW', DATA_BLOCK_ENCODING => 'DIFF'}
0 row(s) in 1.5420 seconds

create 'tsdb-meta',
  {NAME => 'name', COMPRESSION => 'NONE', BLOOMFILTER => 'ROW', DATA_BLOCK_ENCODING => 'DIFF'}
0 row(s) in 1.9910 seconds
The output lists each table that was created. This job runs several table creation commands, each using the format of
create TABLE_NAME. The tables are successfully created when you have output in the form of0 row(s) in TIME seconds.TABLE_NAME: the name of the table that the job createsTIME: the amount of time it took to create the table
Data model
The tables that you created store data points from OpenTSDB. In a later step, you write time-series data into these tables. Time-series data points are organized and stored as follows:
| Field | Required | Description | Example |
|---|---|---|---|
metric
|
Required | Item that is being measured—the default key |
sys.cpu.user
|
timestamp
|
Required | Unix epoch time of the measurement | 1497561091 |
tags
|
At least one tag is required | Qualifies the measurement for querying purposes |
hostname=www
cpu=0
env=prod
|
value
|
Required | Measurement value | 89.3 |
The metric, timestamp, and tags (tag key and tag value) form the row key. The timestamp is normalized to one hour, to ensure that a row does not contain too many data points. For more information, see HBase Schema.
Deploy OpenTSDB
The following diagram shows the deployment architecture for OpenTSTB with its services running on GKE and with Bigtable as the storage backend:

This guide uses two OpenTSDB Kubernetes
deployments:
one deployment sends metrics to Bigtable and the other deployment
reads from it. Using two deployments prevents long-running reads and writes from
blocking each other. The Pods in each deployment use the same container image.
OpenTSDB provides a daemon called
tsd
that runs in each container. A single tsd process can handle a high throughput
of events per second. To distribute load, each deployment in this guide
creates three replicas of the read and write Pods.
In Cloud Shell, create a deployment for writing metrics:
envsubst < deployments/opentsdb-write.yaml.tpl | kubectl create -f -
The configuration information for the write deployment is in the
opentsdb-write.yaml.tplfile in thedeploymentsfolder of the guide repository.Create a deployment for reading metrics:
envsubst < deployments/opentsdb-read.yaml.tpl | kubectl create -f -
The configuration information for the reader deployment is in the
opentsdb-read.yaml.tplfile in thedeploymentsfolder of the guide repository.
In a production deployment, you can increase the number of tsd Pods that are
running, either manually or by using
autoscaling
in Kubernetes. Similarly, you can increase the number of instances in your
GKE cluster manually or by using
cluster autoscaler.
Create the OpenTSDB services
In order to provide consistent network connectivity to the deployments, you create two Kubernetes services: one service writes metrics into OpenTSDB and the other reads.
In Cloud Shell, create the service for writing metrics:
kubectl create -f services/opentsdb-write.yaml
The configuration information for the metrics writing service is contained in the
opentsdb-write.yamlfile in theservicesfolder of the guide repository. This service is created inside your Kubernetes cluster and is reachable by other services running in your cluster.Create the service for reading metrics:
kubectl create -f services/opentsdb-read.yaml
The configuration information for the metrics reading service is contained in the
opentsdb-read.yamlfile in theservicesfolder of the guide repository.
Write time-series data to OpenTSDB
There are several mechanisms to
write data
into OpenTSDB. After you define service endpoints, you can direct processes to
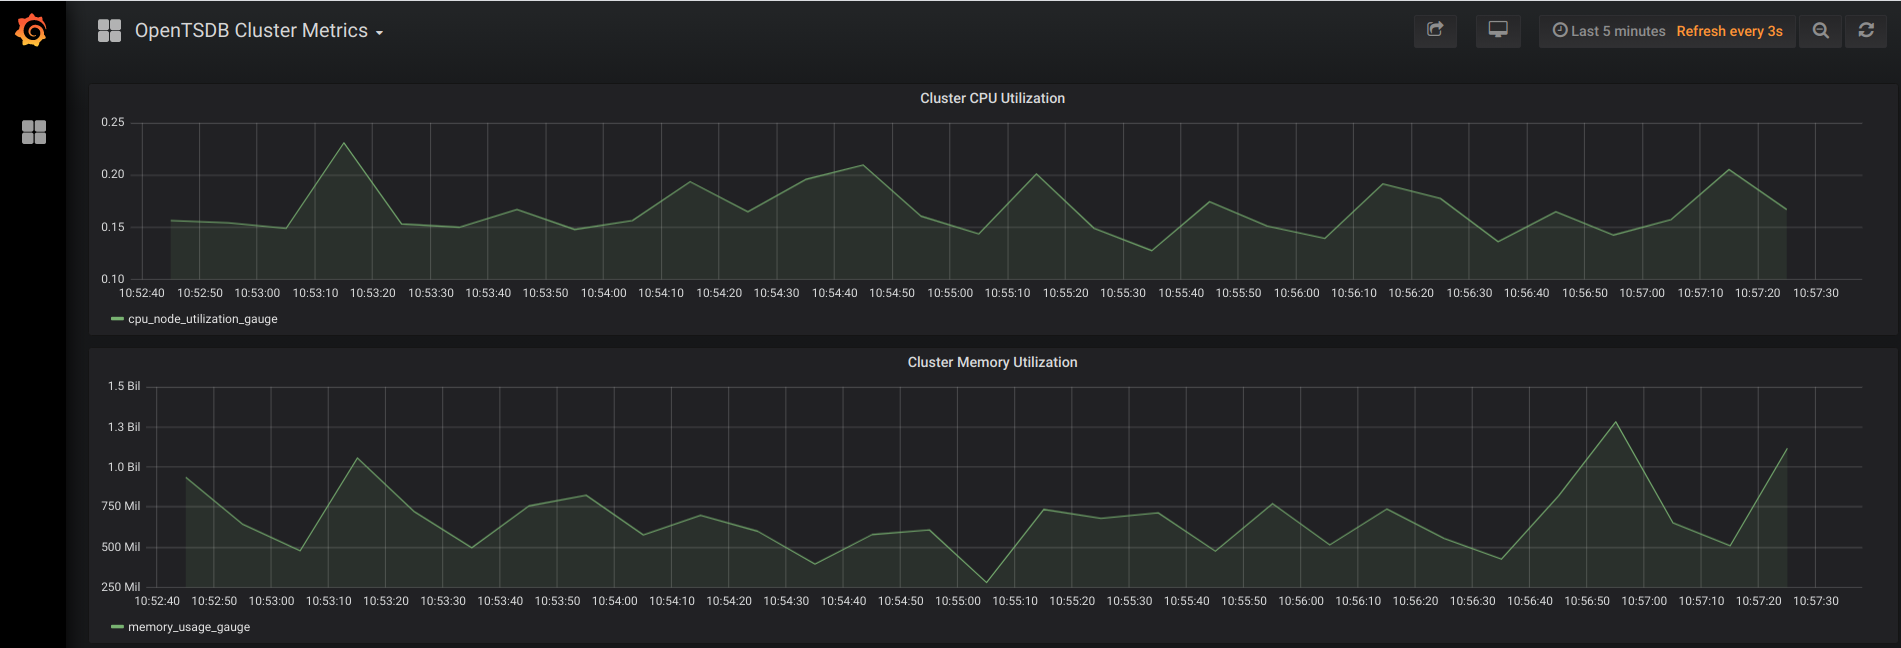
begin writing data to them. This guide deploys a Python service that emits
demonstrative time-series data for two metrics: Cluster Memory Utilization
(memory_usage_gauge) and Cluster CPU Utilization
(cpu_node_utilization_gauge).
In Cloud Shell, deploy the time series metric generator to your cluster:
envsubst < deployments/generate.yaml.tpl | kubectl create -f -
Examine the example time-series data with OpenTSDB
You can query time-series metrics by using the opentsdb-read service endpoint
that you deployed earlier in the guide. You can use the data in various ways.
One common option is to visualize it. OpenTSDB includes a basic interface to
visualize metrics that it collects. This guide uses
Grafana,
a popular alternative for visualizing metrics that provides additional
functionality.
Running Grafana in your cluster requires a similar process that you used to set up OpenTSDB. In addition to creating a ConfigMap and a deployment, you need to configure port forwarding so that you can access Grafana while it is running in your Kubernetes cluster.
In Cloud Shell, create the Grafana ConfigMap using the configuration information in the
grafana.yamlfile in theconfigmapsfolder of the guide repository:kubectl create -f configmaps/grafana.yaml
Create the Grafana deployment using the configuration information in the
grafana.yamlfile in thedeploymentsfolder of the guide repository:kubectl create -f deployments/grafana.yaml
Get the name of the Grafana Pod in the cluster and use it to set up port forwarding:
GRAFANA_PODS=$(kubectl get pods --selector=app=grafana \
               --output=jsonpath={.items..metadata.name})
kubectl port-forward $GRAFANA_PODS 8080:3000
Verify that forwarding was successful. The output is similar to the following:
Forwarding from 127.0.0.1:8080 -> 3000
To connect to the Grafana web interface, in Cloud Shell, click Web Preview and then select Preview on port 8080.
For more information, see Using web preview.
A new browser tab opens and connects to the Grafana web interface. After a few moments, the browser displays graphs like the following:
This deployment of Grafana has been customized for this guide. The files
configmaps/grafana.yamlanddeployments/grafana.yamlconfigure Grafana to connect to theopentsdb-readservice, allow anonymous authentication, and display some basic cluster metrics. For a deployment of Grafana in a production environment, we recommend that you implement the proper authentication mechanisms and use richer time-series graphs.
Clean up
To avoid incurring charges to your Google Cloud account for the resources used in this tutorial, either delete the project that contains the resources, or keep the project and delete the individual resources.
Delete the individual resources
Delete the Kubernetes cluster to delete all the artifacts that you created:
gcloud container clusters delete GKE_CLUSTER_NAME
To delete the Kubernetes cluster, confirm by typing
Y.To delete the Bigtable instance, do the following:
In the Google Cloud console, go to Bigtable.
Select the instance that you previously created, and then click Delete instance.
Delete the project
- In the Google Cloud console, go to the Manage resources page.
- In the project list, select the project that you want to delete, and then click Delete.
- In the dialog, type the project ID, and then click Shut down to delete the project.
What's next
- To learn how to improve the performance of your uses of OpenTSDB, see Bigtable Schema Design for Time Series Data.
- To learn how to migrate from HBase to Bigtable, see Migrating data from HBase to Bigtable.
- The video Bigtable in Action, from Google Cloud Next 17, describes field promotion—an important performance improvement.
- To learn more about default scopes for GKE clusters, see cluster scopes.
- Explore reference architectures, diagrams, and best practices about Google Cloud. Take a look at our Cloud Architecture Center.