This document is one part of a two-part series on extending Cloud Logging and Cloud Monitoring to include on-premises infrastructure and apps.
- Cloud Logging: Read about how Cloud Logging supports logging from on-premises resources.
- Cloud Monitoring (this document): Read about how Cloud Monitoring supports monitoring on-premises resources.
You might consider using Logging and Monitoring for logging and monitoring of your on-premises resources for the following reasons:
- You need a temporary solution as you move infrastructure to Google Cloud and you want to monitor your on-premises resources until they're decommissioned.
- You might have a diverse computing environment with multiple clouds and on-premises resources.
In either case, with the Logging and Monitoring APIs and BindPlane you can gain visibility into your on-premises resources. This document is intended for DevOps practitioners, managers, and executives who are interested in a monitoring strategy for resources in Google Cloud and their remaining on-premises infrastructure and apps.
Ingesting metrics with Monitoring
You can get metrics into Monitoring in the following two ways:
- Use the BindPlane tool from observIQ to ingest metrics from your on-premises or other cloud sources
- Use OpenCensus to write to the Cloud Monitoring API.
Using BindPlane to ingest metrics
The following diagram shows the architecture of how BindPlane collects metrics and then how these metrics are ingested into Monitoring.

observIQ offers several versions of BindPlane: open source (self-hosted), SaaS, and Enterprise. For more information about these versions, see the BindPlane comparison page.
Advantages:
- Requires configuration, not instrumentation of your apps, which reduces time to implement.
- Included in the cost of using Monitoring.
- Supported configuration by Monitoring product and support.
- Can extend to metrics not provided by the default configuration.
Disadvantages:
- Requires the use of the observIQ BindPlane tool to relay metrics to Monitoring, which can add complexity to the overall system.
This option is the recommended method because it requires the lowest amount of effort. This solution requires configuration rather than development.
Using OpenCensus to write to the Monitoring API
The following diagram shows the architecture of how OpenCensus collects metrics and how these metrics are ingested into Monitoring.

Using the Monitoring API directly means that you need to add instrumentation code to your apps to send metrics directly to the API. You can do this directly by using the Monitoring API to write metrics or by instrumenting your app with the Monitoring exporter for OpenCensus. OpenCensus is an open source project that defines a standard data structure for traces and metrics. Using OpenCensus has the advantage of supporting multiple backends, including Monitoring. Using OpenCensus also implements all the low-level technical details of using the Monitoring API.
Advantages:
- Provides flexibility because the instrumentation required is easily implemented with the use of the OpenCensus Exporter
Disadvantages:
- Requires a separate solution for infrastructure metrics by writing a custom agent.
- Requires app instrumentation, which might mean higher cost to implement.
- Requires open source libraries.
This option isn't the recommended method because it requires the highest amount of effort and doesn't cover infrastructure metrics.
Using BindPlane
This document covers using the BindPlane tool from observIQ to ingest metrics into Monitoring. The BindPlane service works by defining a series of sources, ingesting those metrics, and then sending the metrics to Monitoring as the destination. BindPlane supports Compute Engine, Amazon Elastic Compute Cloud (Amazon EC2), Linux, Windows, and Kubernetes sources.
Sources, collectors, and destinations
BindPlane has the following features:
- Sources: Items that generate metrics such as Google Kubernetes Engine (GKE), Amazon Elastic Container Service for Kubernetes (Amazon EKS), or Microsoft Azure Container Service.
- Collectors: Lightweight processes that remotely monitor your environment and forward metric data to BindPlane.
- Destinations: Services that BindPlane forwards the metrics. In this case, the destination is the process on BindPlane that uses the Monitoring API to write metrics to Monitoring.
For more detailed information about sources, collectors, and destinations, see the introduction to BindPlane.
Example use case
As an example, ExampleOrganization has resources deployed to Google Cloud, Microsoft Azure, and on-premises resources deployed by using vSphere. In Google Cloud, there is a GKE cluster and a simple demo app deployed, which runs the company's website. In the Microsoft Azure environment, Azure Kubernetes Service (AKS) is running a set of microservices, providing a REST API endpoint to external developers. In the vSphere environment, MySQL, Oracle, and Microsoft SQL Server support several corporate apps.
With resources in each environment, ExampleOrganization wants to monitor each component regardless of where the component is deployed. Sending the metrics from each environment to Logging and Monitoring by using BindPlane brings all the metrics into a single location for monitoring and alerting purposes.
Send metrics from BindPlane to Monitoring
After BindPlane is set up and begins sending metrics, those metrics are sent to your Monitoring Workspace. You can then use Monitoring to view, configure, alert, and build dashboards from the time series like you can for any metrics or time series in Monitoring. For more information, see Metrics, time series, and resources.
Use metrics in Monitoring
In the previous example, BindPlane was configured to send metrics from Google Cloud, Microsoft Azure, and on-premises sources. The following three metrics appear in Monitoring:
- GKE cluster metrics
- AKS cluster metrics
- vSphere on-premises database metrics
GKE cluster metrics
The GKE cluster metrics in Monitoring on the Google Kubernetes Engine page display three views of the Kubernetes components running in the Monitoring Workspace, including infrastructure, workloads, and services views. There are four services deployed to the cluster that are reporting metrics.
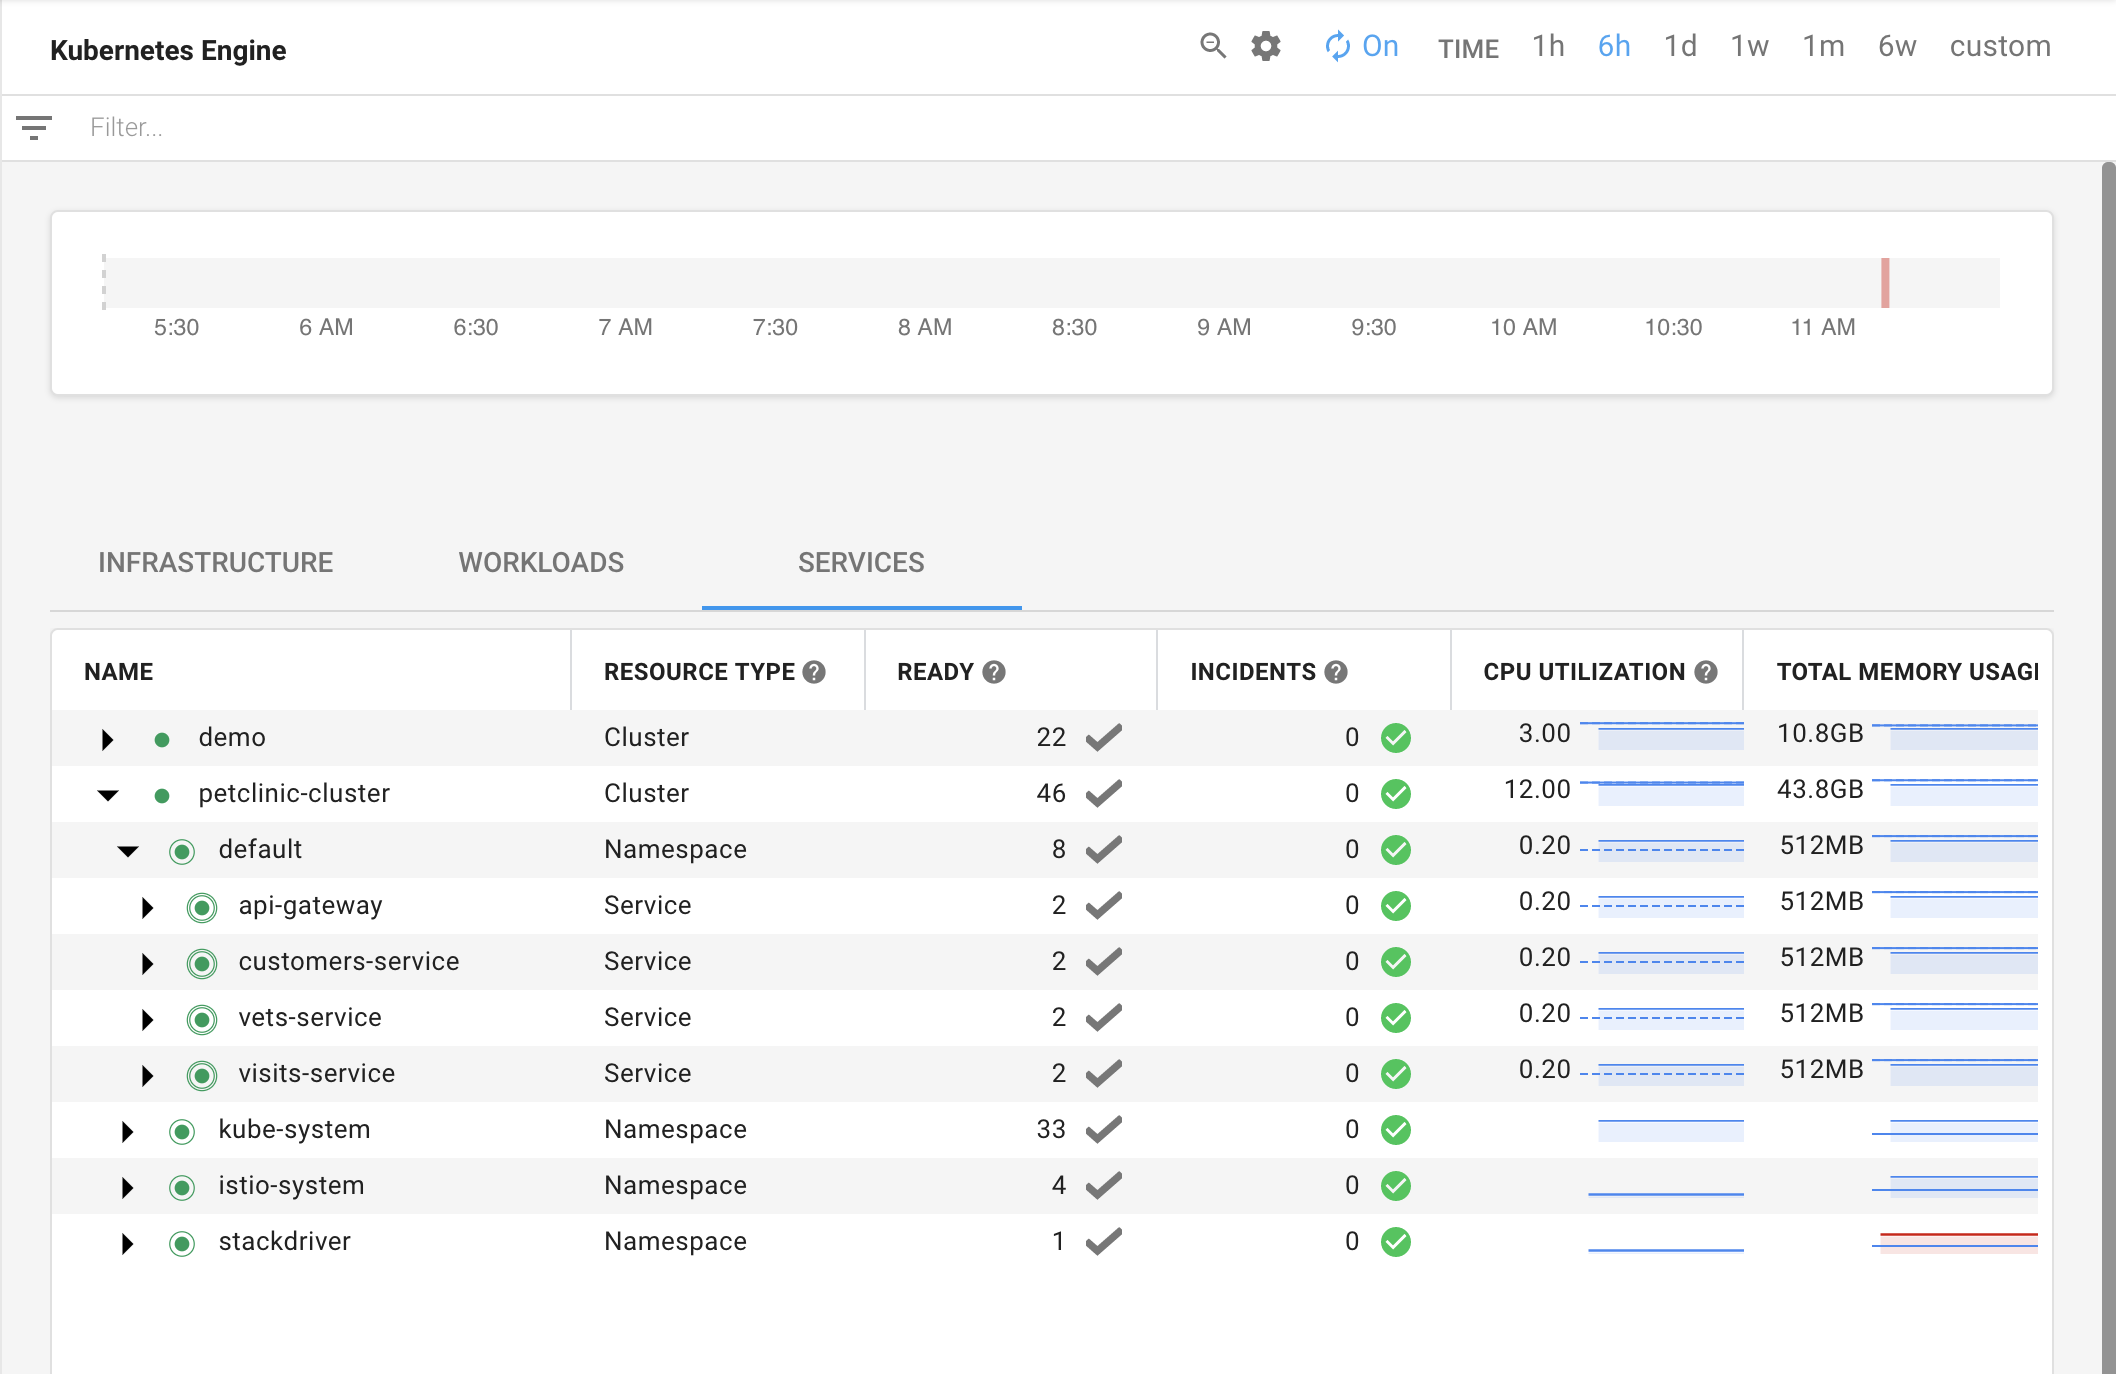
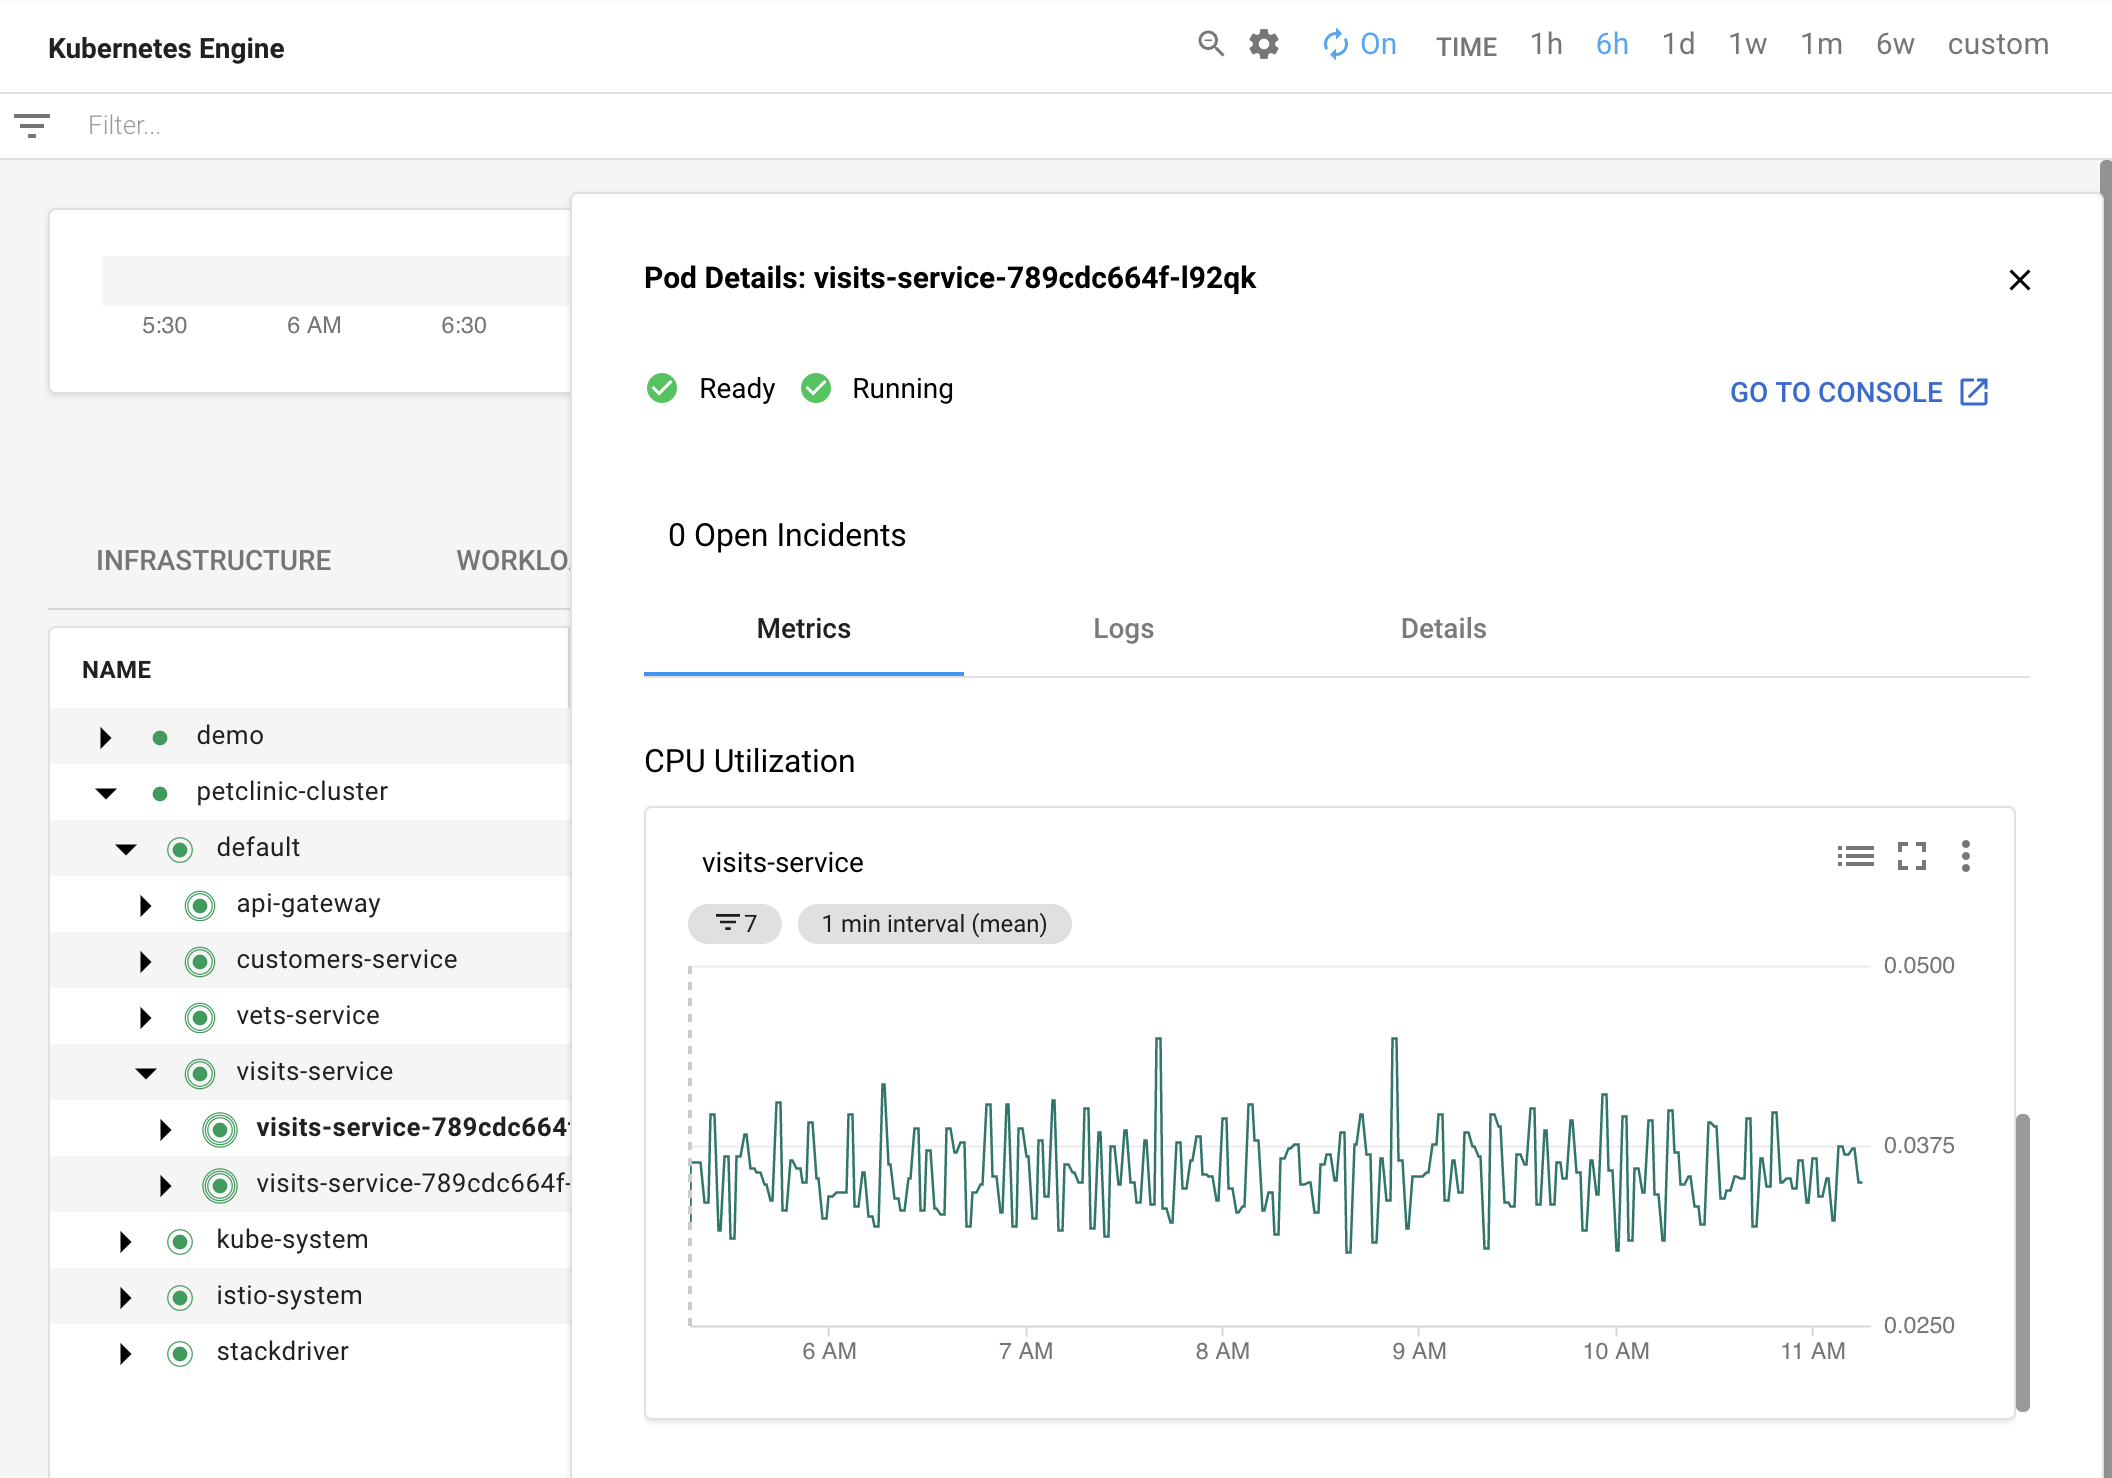
The metrics, logs, and configuration are available for each pod.
AKS cluster metrics
In the same Monitoring environment, metrics for AKS are collected. The metrics appear in Monitoring and can be used for any purposes in Monitoring including dashboards, alerting, and the Metrics Explorer.
The Monitoring Metrics Explorer provides a way to find, filter,
and build charts from metrics. Note that the metrics sent in by BindPlane have
the workload.googleapis.com/THIRD_PARTY_APP_NAME
prefix for the metric name.
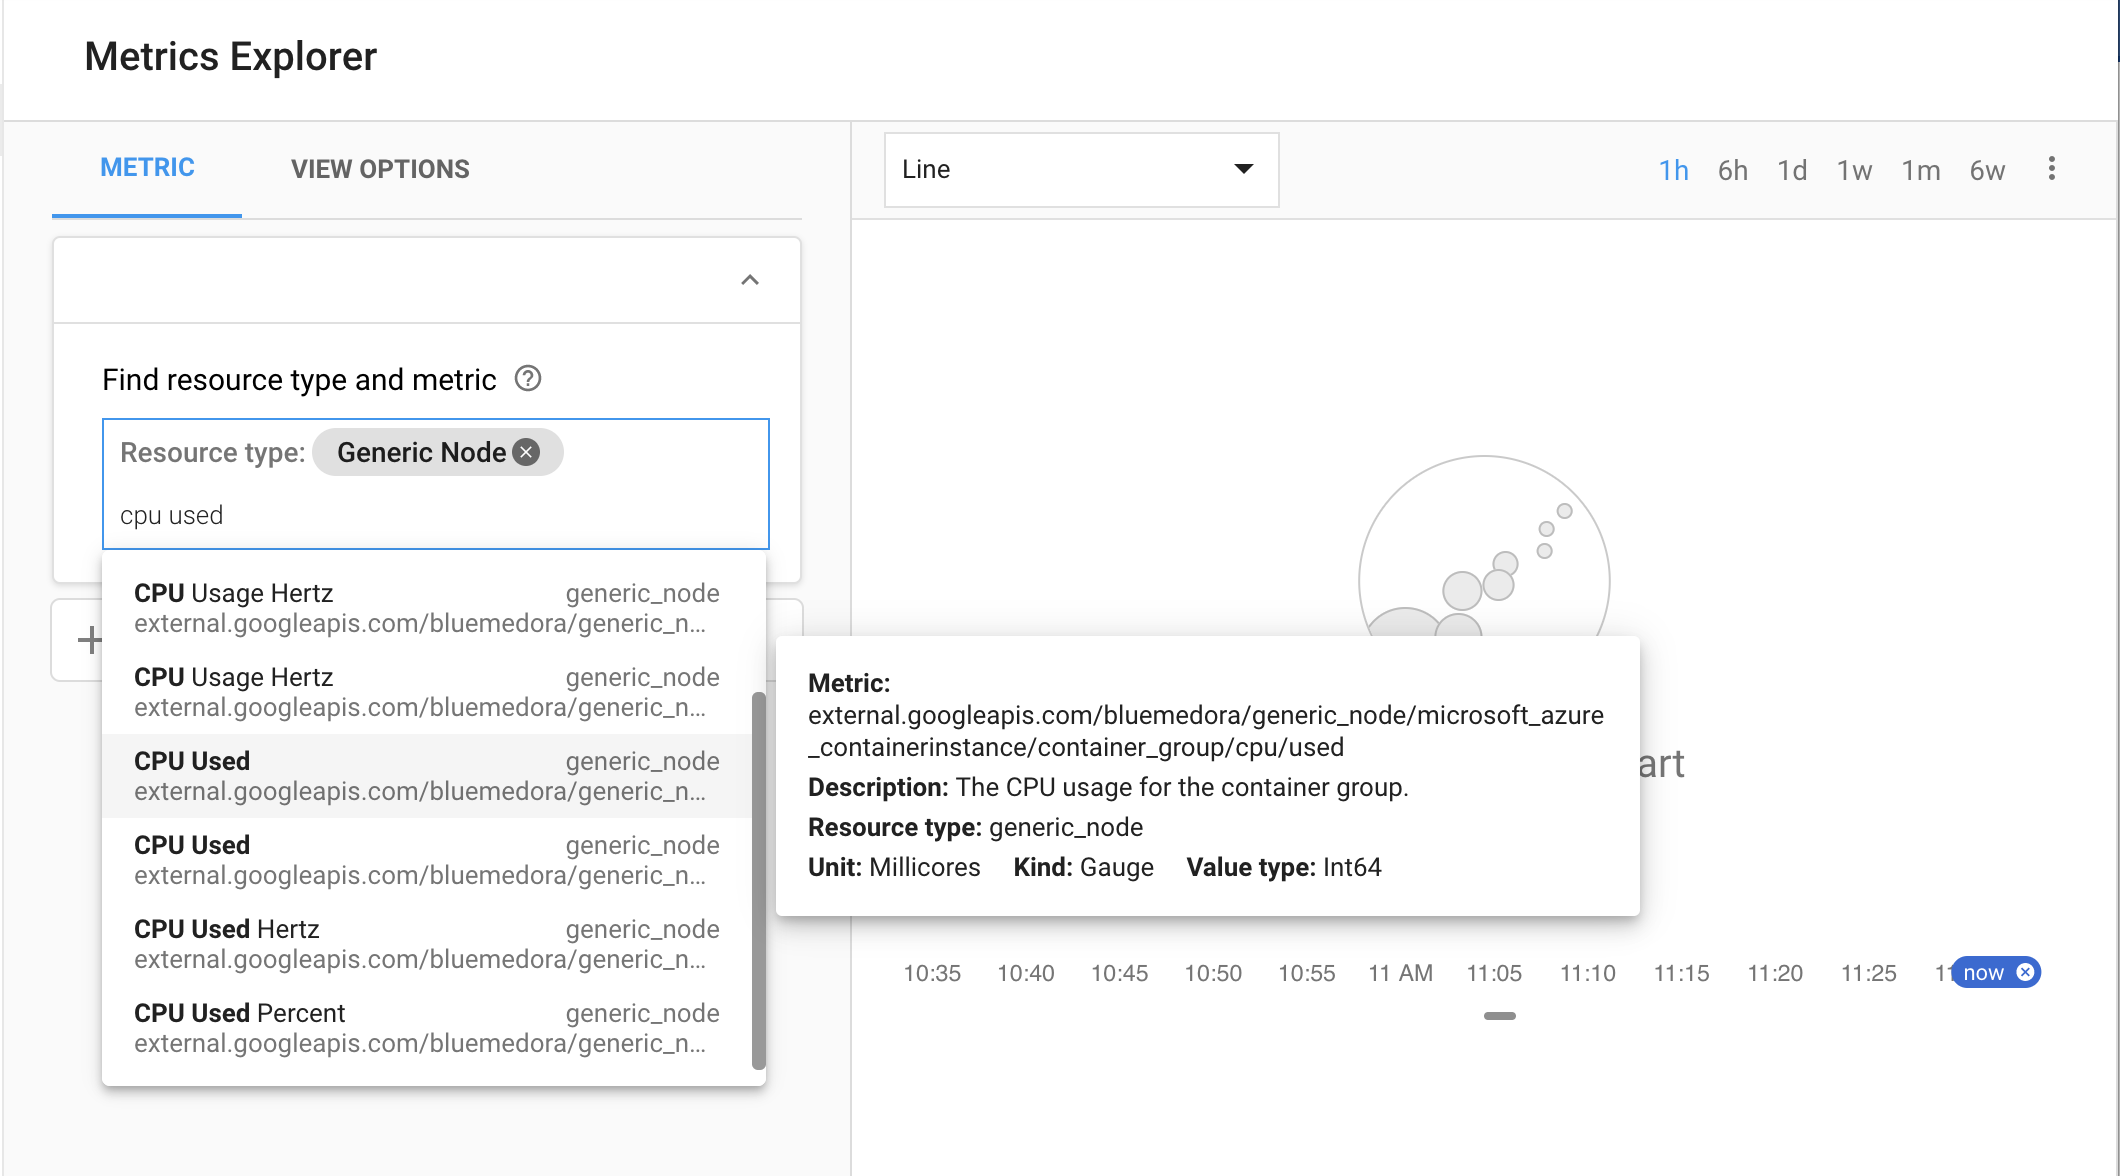
The Metrics Explorer can produce a chart for the metric.
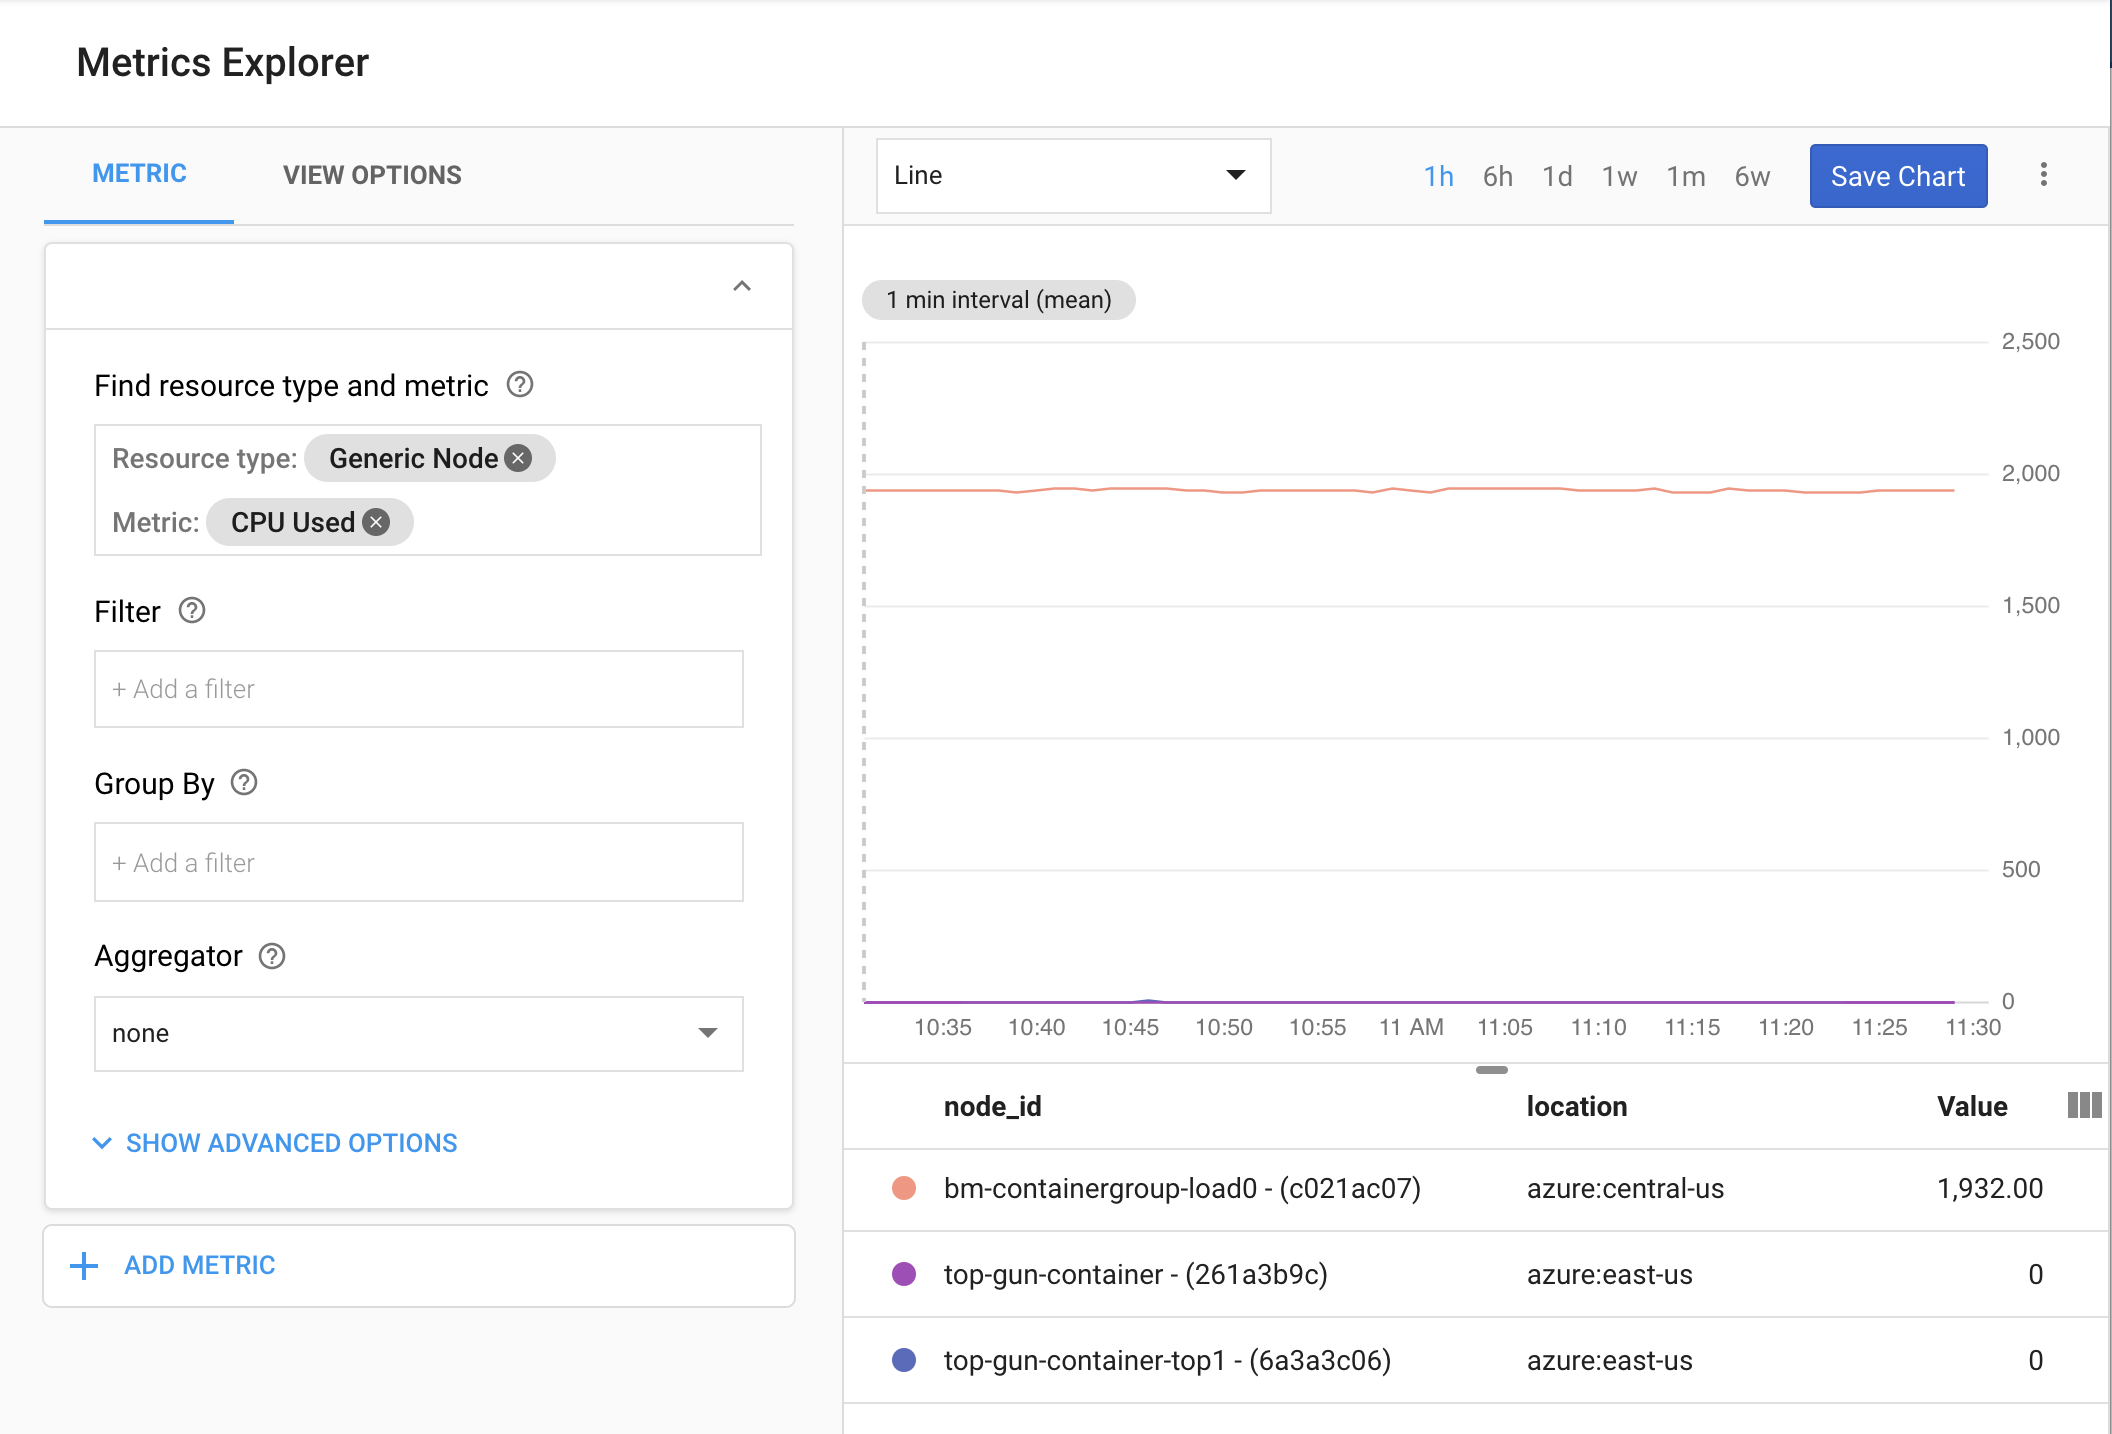
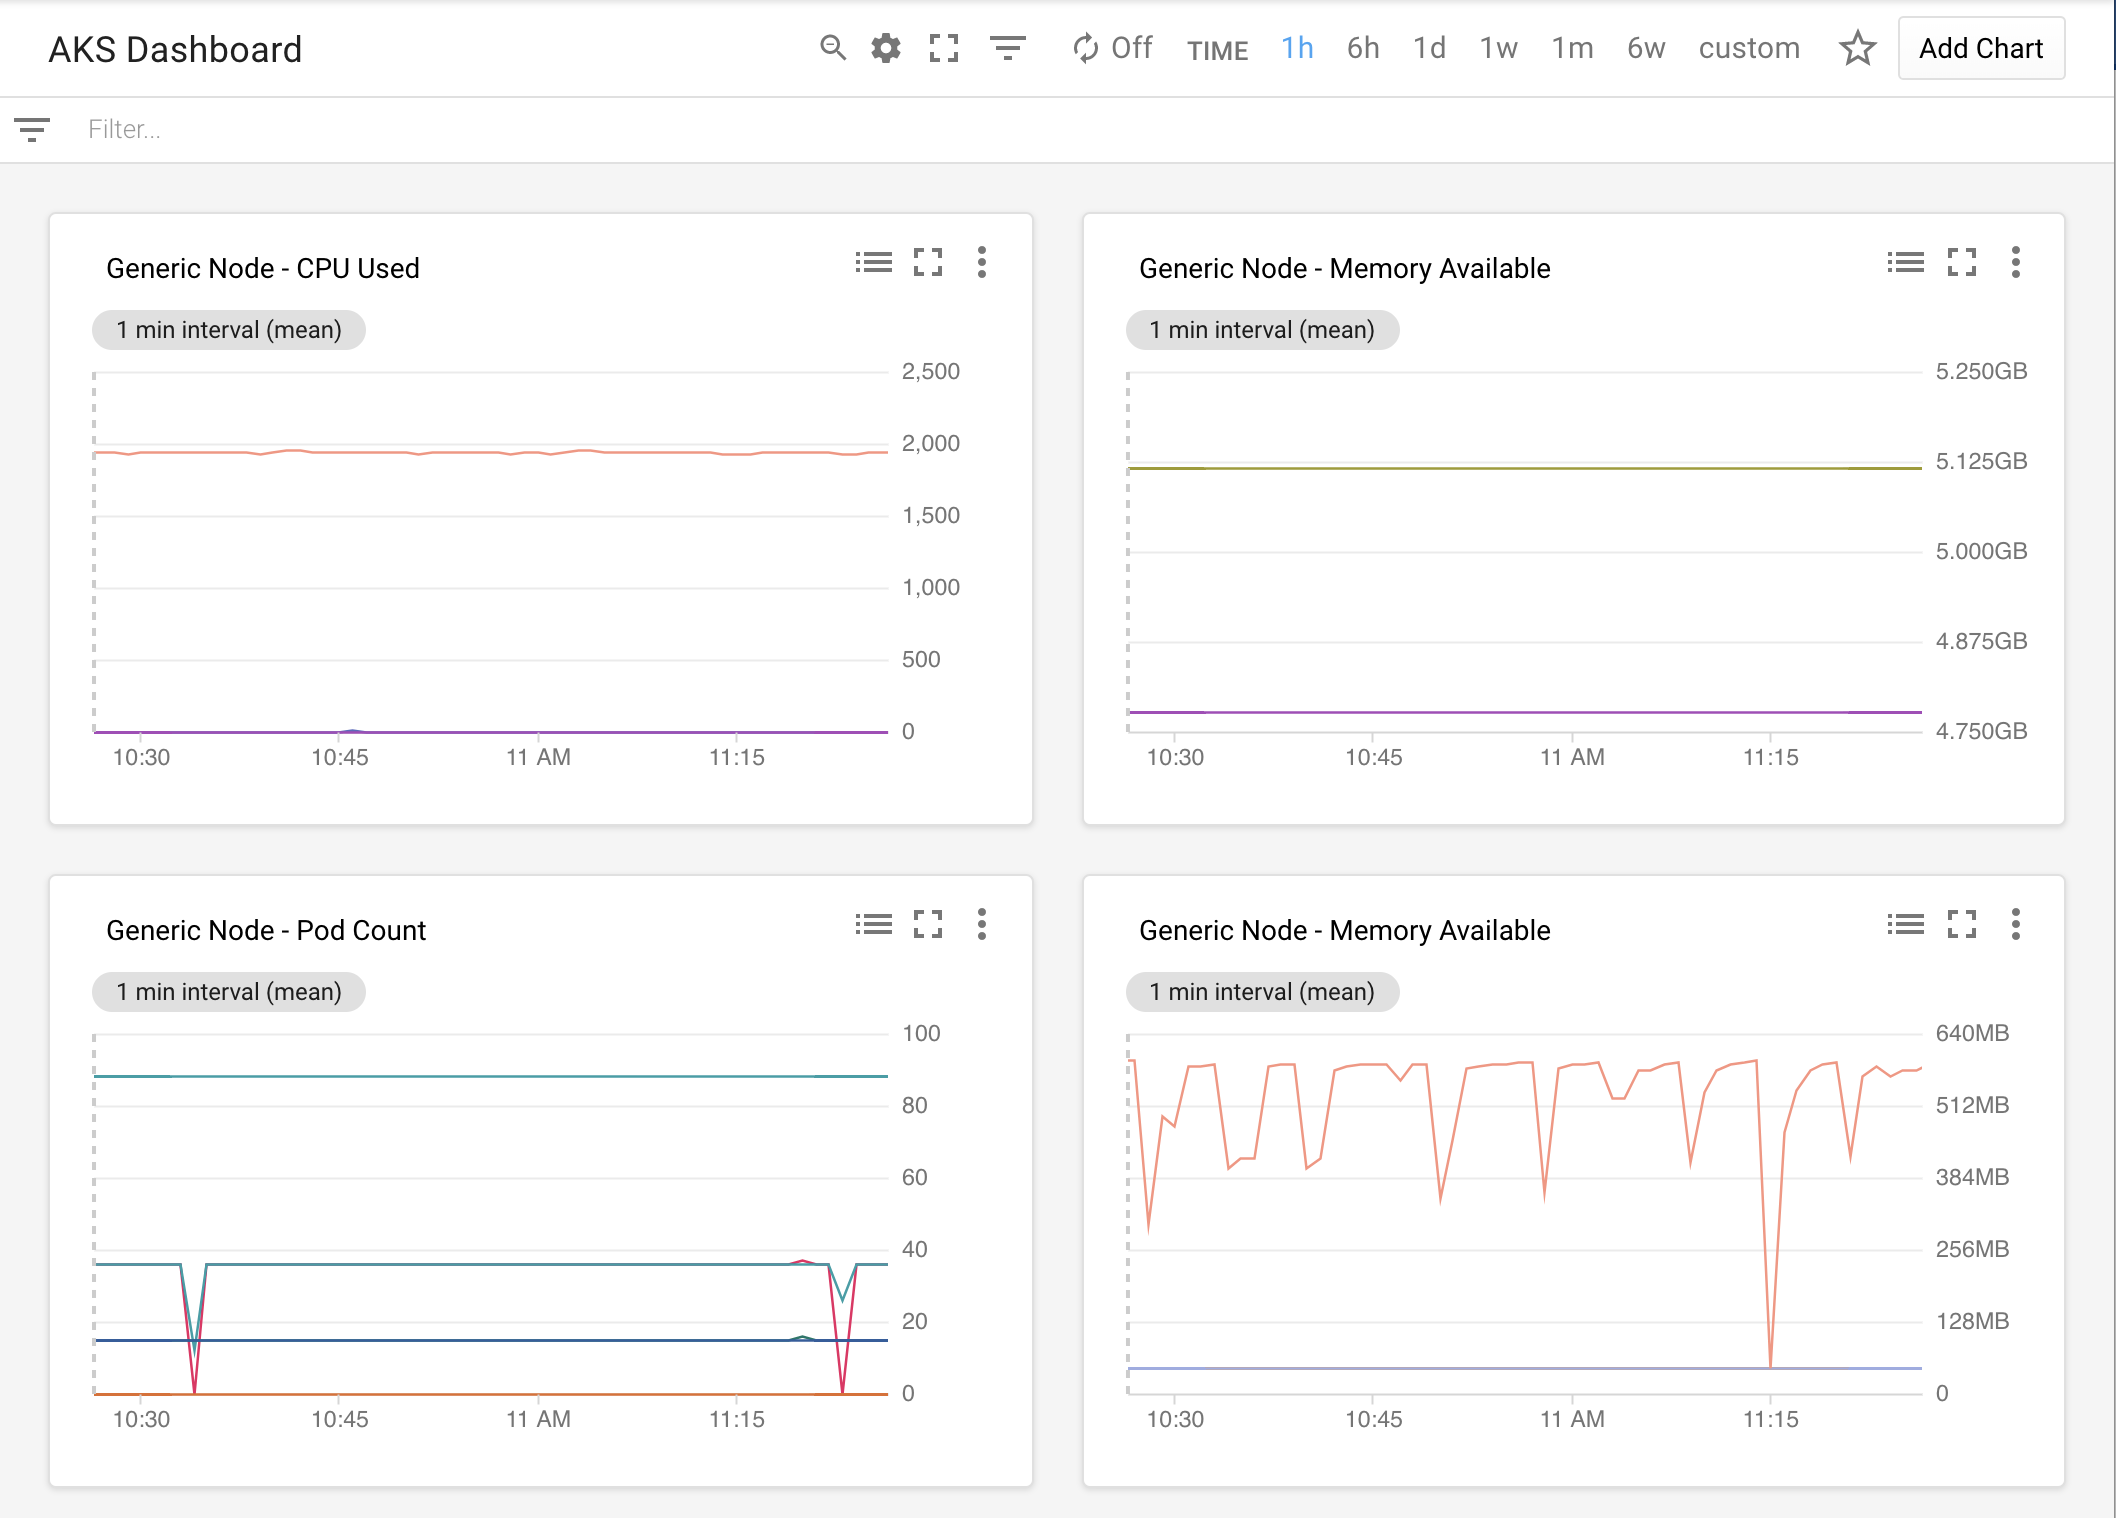
Like all metrics in Monitoring, you can use these metrics to build dashboards like the one in the following screenshot. The dashboard represents metrics produced by AKS, collected by BindPlane, stored in Monitoring, and displayed on a dashboard.
vSphere on-premises cluster metrics
The last part of this example includes database metrics from vSphere. The metrics from vSphere appear in Monitoring and can be used in the same way as any other metric in Monitoring. You can see that the Oracle metrics from vSphere appear in the Metrics Explorer.

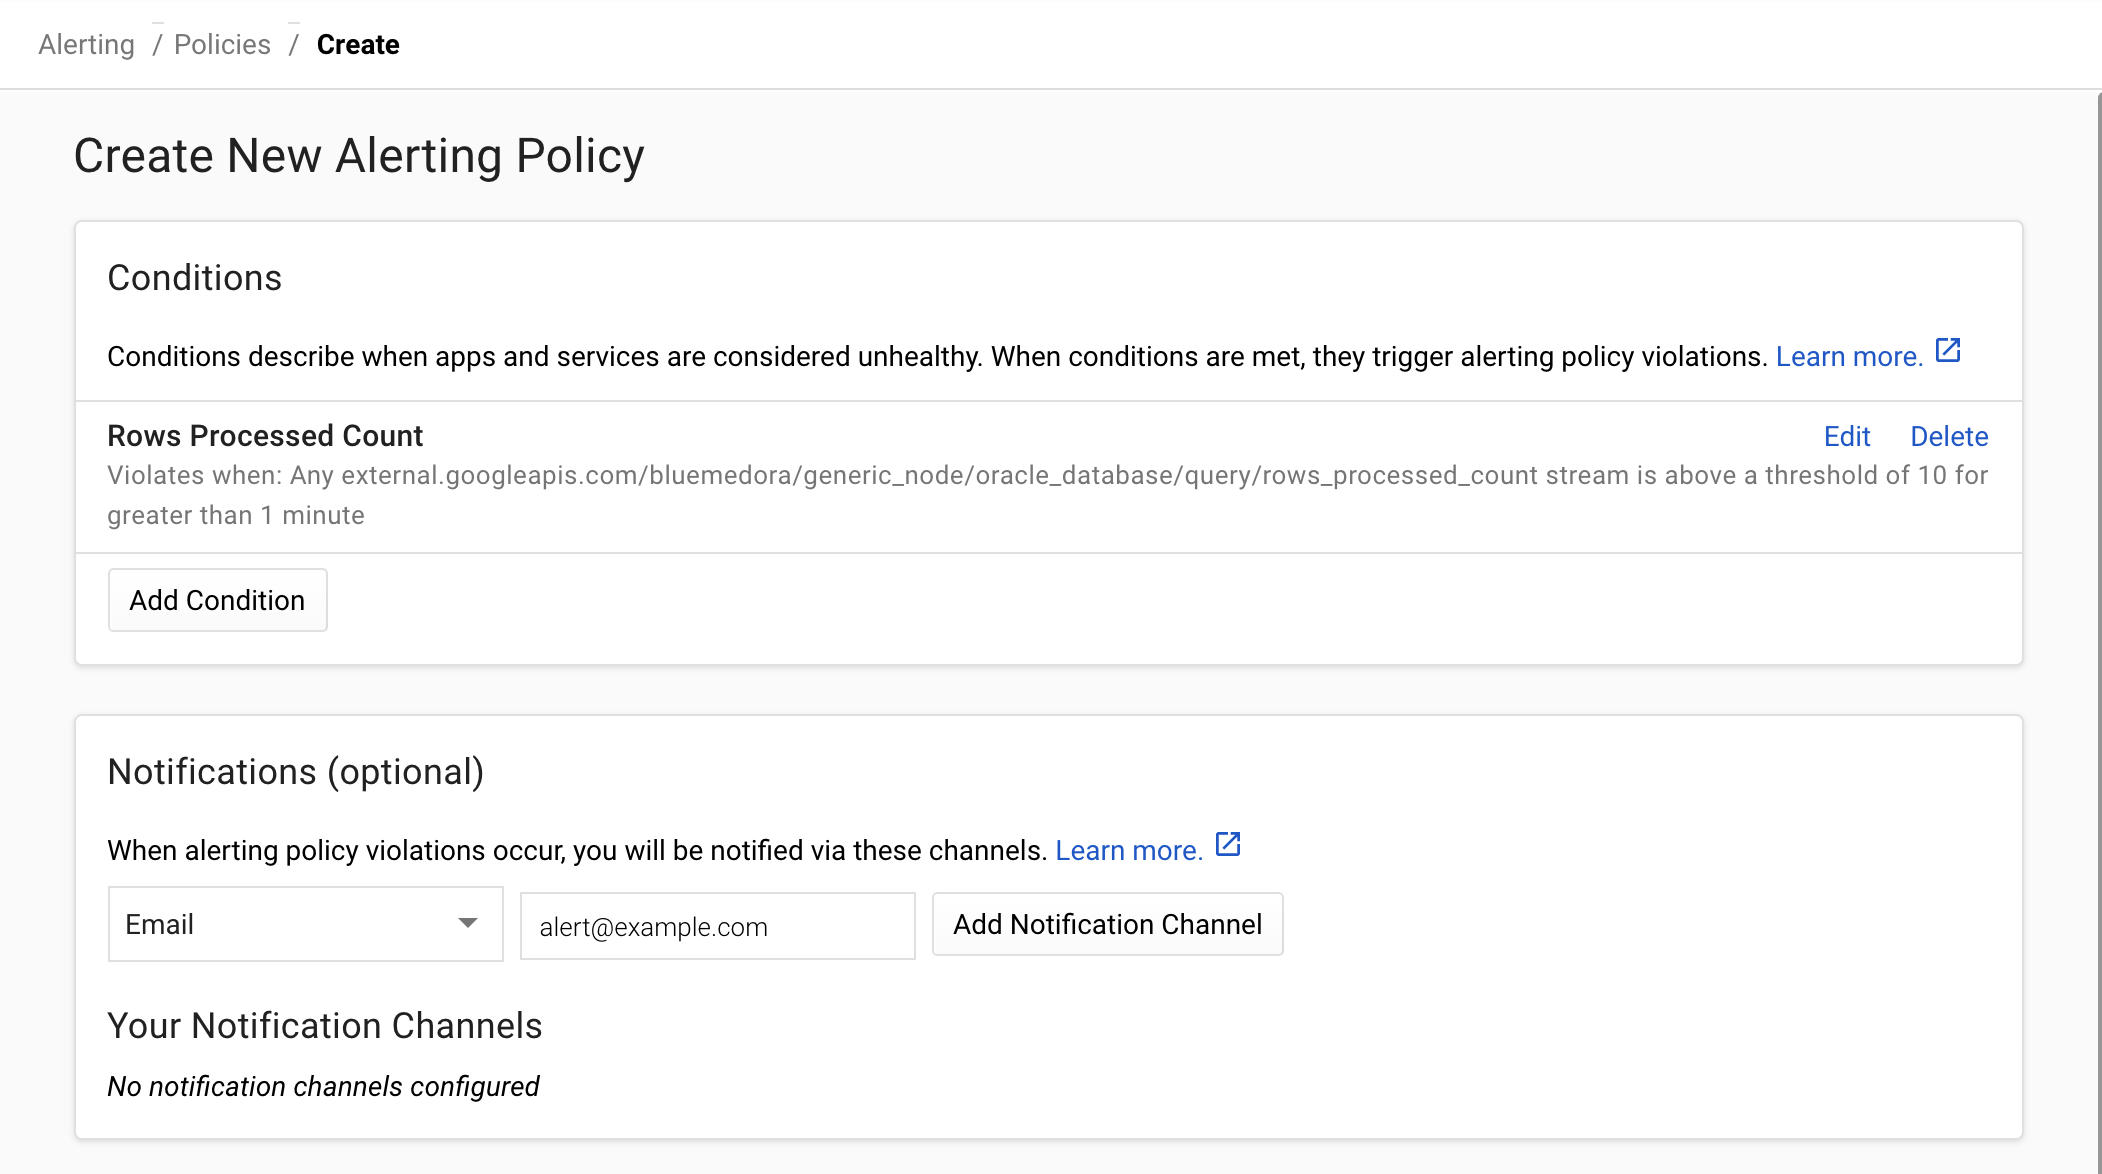
Like all metrics in Monitoring, metrics can be used to build alerts like the one in the following screenshot.
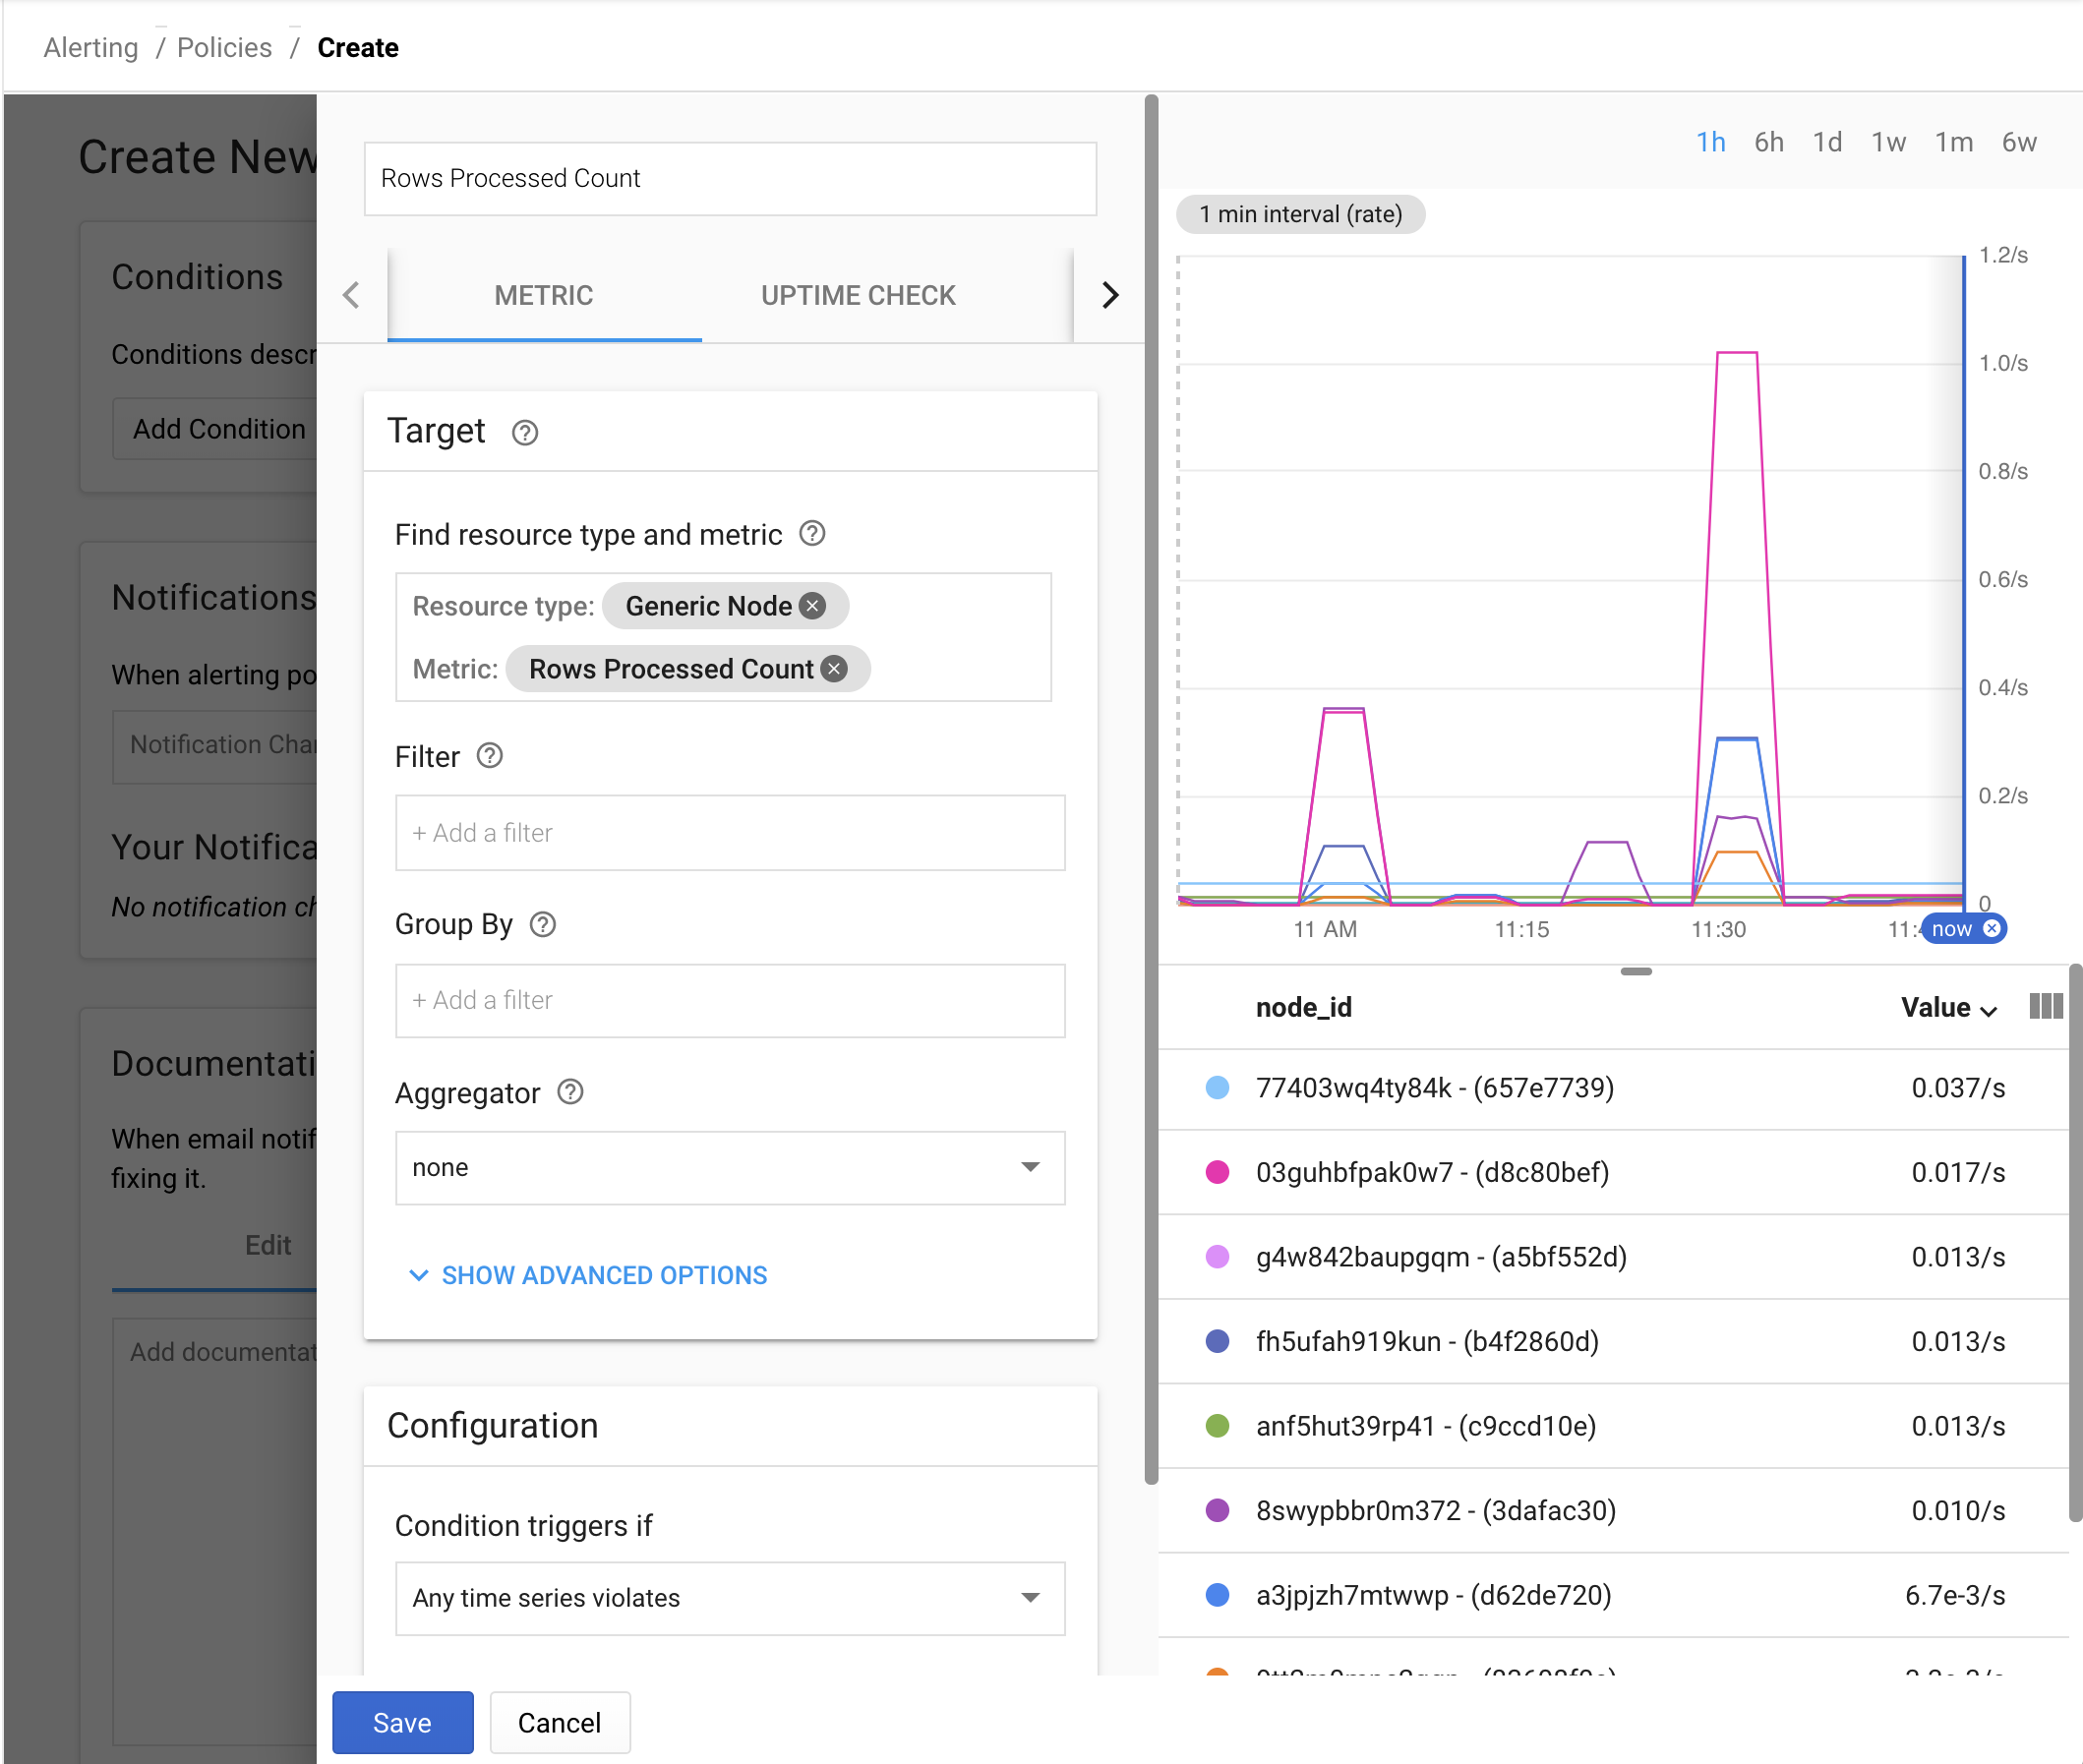
The alert represents metrics produced by Oracle running in vSphere, collected by BindPlane, stored in Monitoring, and used to configure an alert.
Conclusion
Monitoring provides dashboards, alerting, and incident response for you to get insights into your platforms. Together, Monitoring and BindPlane provide you the ability to gain visibility into your on-premises resources.
What's next
- Cloud Logging and Cloud Monitoring
- BindPlane setup instructions for Logging
- Explore reference architectures, diagrams, and best practices about Google Cloud. Take a look at our Cloud Architecture Center.