This page explains how to work with findings on the Security Command Center Findings page in the Google Cloud console. A finding is a record of a security issue that the Security Command Center services create when they detect security a issue.
Some of the actions that you can perform on findings page include the following:
- Query findings
- Inspect findings
- Mute findings
- Add security marks to findings
Findings are listed in the Findings query results panel of the Findings page. You can click on a finding to see the details of the finding, as well as its full JSON format.
For information about working with findings by using the Security Command Center API, see Accessing Security Command Center programmatically.
IAM roles for Security Command Center
The IAM roles for Security Command Center can be granted at the organization, folder, or project level. Your ability to view, edit, create, or update findings, assets, and security sources depends on the level for which you are granted access. To learn more about Security Command Center roles, see Access control.
View findings in the Google Cloud console
By default, the Findings query results panel of the Findings page displays all active findings that are not muted and that are either new or updated over the last seven days.
To see specific findings, edit the findings query to specify the values or attributes that the findings you need to see must or must not contain.
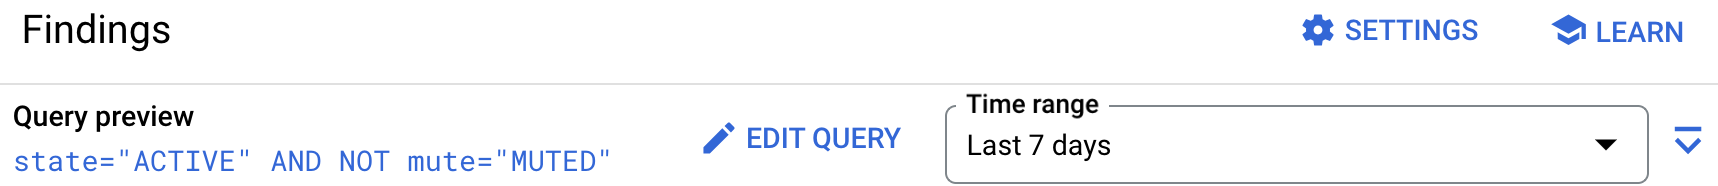
The following example is the default finding query:
state="ACTIVE"
AND NOT mute="MUTED"
You can see the current finding query in the Query preview field of the Findings page.
Adjust the time range to view more findings
You can adjust the time range that is used for your queries
in the Time range field to the right on the Query editor
action bar.
The default time range is Last 7 days.
The time range is based on the value of the eventTime attribute of the
findings, which reflects the time at which the finding record was last
updated.
Finding availability
A finding usually becomes available for you to query in Security Command Center less than a minute after the service that generates the finding stores it in the Security Command Center findings database. Findings remain available for querying for at least 13 months.
Security Command Center stores one or more snapshots of each finding. A
snapshot of a finding is deleted 13 months after the timestamp
in the eventTime field. If all snapshots for a finding are deleted,
the finding can no longer be queried or recovered.
For more information about Security Command Center data retention, see Data retention.
Find and view specific findings
You can find and view specific findings or groups of findings by editing the findings query on the Findings page. You can edit the query in the following ways:
- In the Quick filters panel, select one or more predefined attribute filters to add them to a query.
- In the Add filter menu of the Query editor panel, select one or more of the predefined attribute filters to add them to a query.
- Edit the findings query directly in the Query editor panel.
- On the details panel for a finding, from the drop-down menu for a particular attribute, select a predefined filter for that attribute to add it to a query.
Selecting a predefined filter adds the filter to the query automatically.
Use the Quick filters panel for commonly used, high-level filter options. Use the Add filter menu for more granular and advanced filters that are based on lower-level finding attributes.
For more information about creating and editing finding queries in the console, see Edit a findings query in the Google Cloud console.
View the details of a finding
To learn more about a finding, open the detailed view of the finding by clicking the finding name in the Category column in the Findings query results panel.
In the detail view, you can find information that is critical for understanding a finding, investigating a threat, or addressing a vulnerability.
The detail view for findings includes the following tabs that you can select to learn more about a finding and take action:
- The Summary tab, which is the default view, highlights key information and attributes about the finding.
- The Source properties tab, where you can see the attributes of
the
sourcePropertiesobject of the finding JSON. - The JSON tab, where you can see the full JSON format of the finding.
You can take certain actions on the finding in the detail view, as well as find links to additional information that is related to the finding.
Learn about the finding in the detail view
The detail view of a finding highlights important information about the finding that you can use to understand and address the underlying security issue.
Information on the Summary tab
The Summary tab provides information about the finding in the following sections:
- What was detected
Details about the finding that was detected, such as the following:
- An AI-generated summaryPreview
- The finding severity
- The finding state,
ACTIVEorINACTIVE - Any key fields that are related to the specific finding
- Vulnerability
Information from the CVE record that corresponds to the vulnerability, if any. The Vulnerability section includes information from the CVE record, such as:
- CVE ID
- CVE score
- Impact
- Exploitation activity
- Attack exposure
The attack exposure score and the time at which the score was last calculated. Clicking the score opens a visual depiction of the affected high-value resources and the associated attack path.
- Affected resource
Details about the asset associated with the finding, including technical and security contacts. This section also contains a menu that lets you view the resource's details.
- Security marks
The security marks that are associated with this finding, if any.
- Next steps
Guidance on what you can do to remediate the issue detected. Only certain services, such as Security Health Analytics, provide next steps.
- Related links
Links to key sources of security information outside of Security Command Center. Only certain services, such as Event Threat Detection, provide related links.
- Detection service
Details about the service, or source, that detected the finding.
Information on the Source properties tab
For some findings, the details panel includes a Source properties tab
that highlights certain properties from the sourceProperties object of the
finding JSON.
Source properties differ for each finding and for each service that runs on Security Command Center. There's no assurance that source properties are standardized across all services. For this reason, we strongly discourage consuming source properties programmatically. If you want a source property to be standardized across all services, let us know by sending your feedback.
Information on the JSON tab
The JSON tab contains the complete JSON structure of the currently selected finding, which can be useful when you're investigating a finding or looking up attributes that you can use in your finding queries.
To copy the JSON object to your clipboard, click Copy.
The JSON structure of a finding contains the following objects:
findings: The finding's attributes. These attributes are standardized across all built-in and integrated services (also known as security sources). For more information, seeFinding.resource: The attributes of the affected resource. For more information, seeResource.sourceProperties: The service-specific properties of the finding.
You can also use the ListFindings API
to list findings and get their JSON definitions.
Take action on a finding from the detail view
You can take a variety of actions on a finding from the finding's detail view, such as mute the finding or add attributes from the finding to the current finding query.
Mute a finding in the detail view
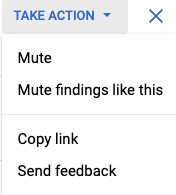
From the Take action menu in detail view of a finding, you can mute or unmute the finding, or create a rule that mutes all future findings like the current finding.
For complete instructions for muting a finding or creating a mute rule, see Mute findings in Security Command Center.
Add attribute filters to a query from the detail view
From the detail view of a finding, you can add filters for the displayed attributes to the current findings query.
For instructions, see Add attribute filters from the details view of a finding.
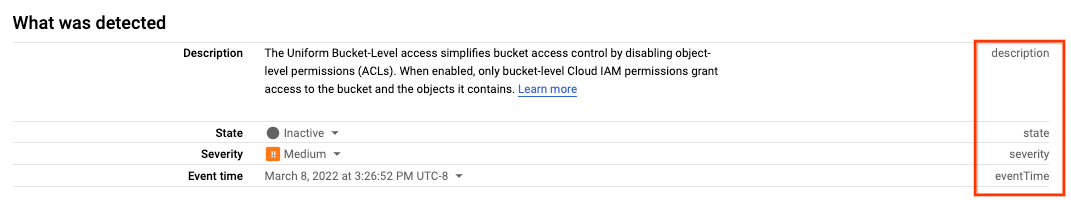
View attribute API names in the detail view of a finding
Most finding attributes that are displayed in Google Cloud console have a corresponding name that is used in the Security Command Center API. In the detail view of a finding, you can find and copy the corresponding API name of the displayed finding attributes.
Share the detail view of a finding
To share the detail view of a finding, you can copy the URL of the detail view page for sharing with others.
To copy the detail view URL to your clipboard, in the Take action menu, click Copy link.
Send feedback about the finding to Google Cloud
To send feedback to Google Cloud, open the Take action menu and click Send feedback.
The feedback tool lets you capture and include a screenshot.
The following sections describe the Summary, Source properties, and JSON tabs.
Display details of other findings in the Findings query results panel
To see the details of the findings that precede or follow the finding that you are currently viewing, use the next or previous button to go to the next or previous finding, without having to go back to the Findings page.
Add security marks to findings in the Google Cloud console
You can add security marks to findings, edit the security marks, or remove them from findings in the Findings query results panel.
A security mark is a custom key-value label that you can use to annotate a finding, associate a finding with other findings that share the same security mark, and query findings.
To create, edit, or remove security marks in the Google Cloud console, in the action bar of the Findings query results panel, click Set security marks.
For complete instructions for setting security marks on findings or assets, see Using security marks.
Mute findings in the Google Cloud console
You can mute and unmute findings on the Findings page by using either the Mute options in the Findings query results action bar or by clicking Take action in the details panel of a finding.
You can mute individual findings or create mute rules that mute current and future findings based on filters you define.
Muted findings are hidden and silenced, but you can still view them by adding
the mute="MUTED" filter to your finding query. Muted findings continue
to be logged for audit and compliance purposes.
You can view the currently defined mute rules on the Mute rules tab in Security Command Center settings.
For detailed instructions on how to mute and unmute findings, see Mute findings in Security Command Center.
Change the state of a finding
A finding can have one of two states: Active or Inactive.
A state of Active means that the security issue that is identified by
the finding persists in your environment as a potential threat or
vulnerability.
A state of Inactive means that the security issue has been addressed.
You might want to change the state of a finding for a variety of reasons,
such as to change the state of a finding to Inactive as soon as it is
addressed, so you don't have to wait for the next scan to change the state
for you.
To change the state of a finding in the Google Cloud console:
Go to the Findings view in Security Command Center.
If necessary, select your Google Cloud project or organization.

In the Findings query results panel, select the finding.
In the action bar of the Findings query results panel, click Change active state. A popup menu appears.
In the Change active state popup menu, select either Active or Inactive.
Configure the Findings page
You can control some of the elements that appear on the Findings page.
Adjust columns of query results
You can add or remove columns from the Findings query results panel.
You can remove any column except for Category.
By default, the Finding query results panel shows the following columns, but you might need to scroll right to see them:
- Category: the name of the finding type.
- Severity: the severity of the finding. For more information about finding severity levels, see Severity classifications for findings.
- Attack exposure score: The attack exposure score of the finding.
- Event time: either when the finding was first detected or when it was last updated.
- Create time: when the finding was created in Security Command Center.
- Resource display name: the display name of the resource in which the issue was detected.
- Resource full name: the full name of the resource in which the issue was detected.
- Resource path: the path to the resource in which the issue was detected.
- Resource type: the type of resource in which the issue was detected.
- Security marks: Any security marks that are added to the finding.
- Finding class: the class of the finding, such as
THREAT,VULNERABILITY, andMISCONFIGURATION.
To select the finding columns you want to display, complete the following steps:
- On the right of the Findings query results action bar, click view_column Columns.
- In the menu that appears, select the columns that you want to display.
- To hide a column, deselect the column name.
- Click Apply to apply the changes to the Findings query results panel.
Column selections are preserved the next time you view the Findings page, even if you change projects or organizations. To clear all custom column selections, click Clear column selections.
Adjust Finding page panels
To provide more screen space for editing queries or viewing findings, you can collapse and expand the following panels:
- The Quick filters panel.
- The Query editor panel.
To collapse a panel, click the Toggle panel icon, first_page or first_page.
To expand the panel, click the icon again.
Send feedback to the Security Command Center team
We are always looking for ways to improve our service. Your feedback will help us improve our products and create a better experience for all Security Command Center users.
To send feedback, follow these steps:
Go to the Findings view in Security Command Center.
If necessary, select your Google Cloud project or organization.
Click Options, and select Send feedback.
What's next
- Learn about security sources.
- Learn how to use security marks.
- Learn how to configure Security Command Center.
- Learn how to form a findings filter using the Security Command Center API.