This page describes how to get information about errors that have occurred in your data load (catalog and user events) and predictions.
For help with setting up alerts, see Setting up alerts.
Introduction
Providing accurate catalog information and user events to Recommendations AI is important to getting the highest quality recommendations. Understanding the source of data load and prediction errors helps you find and fix any errors in your site.
Seeing aggregated integration errors
To see the aggregated errors generated by your data upload processes and prediction requests, use the Errors page.
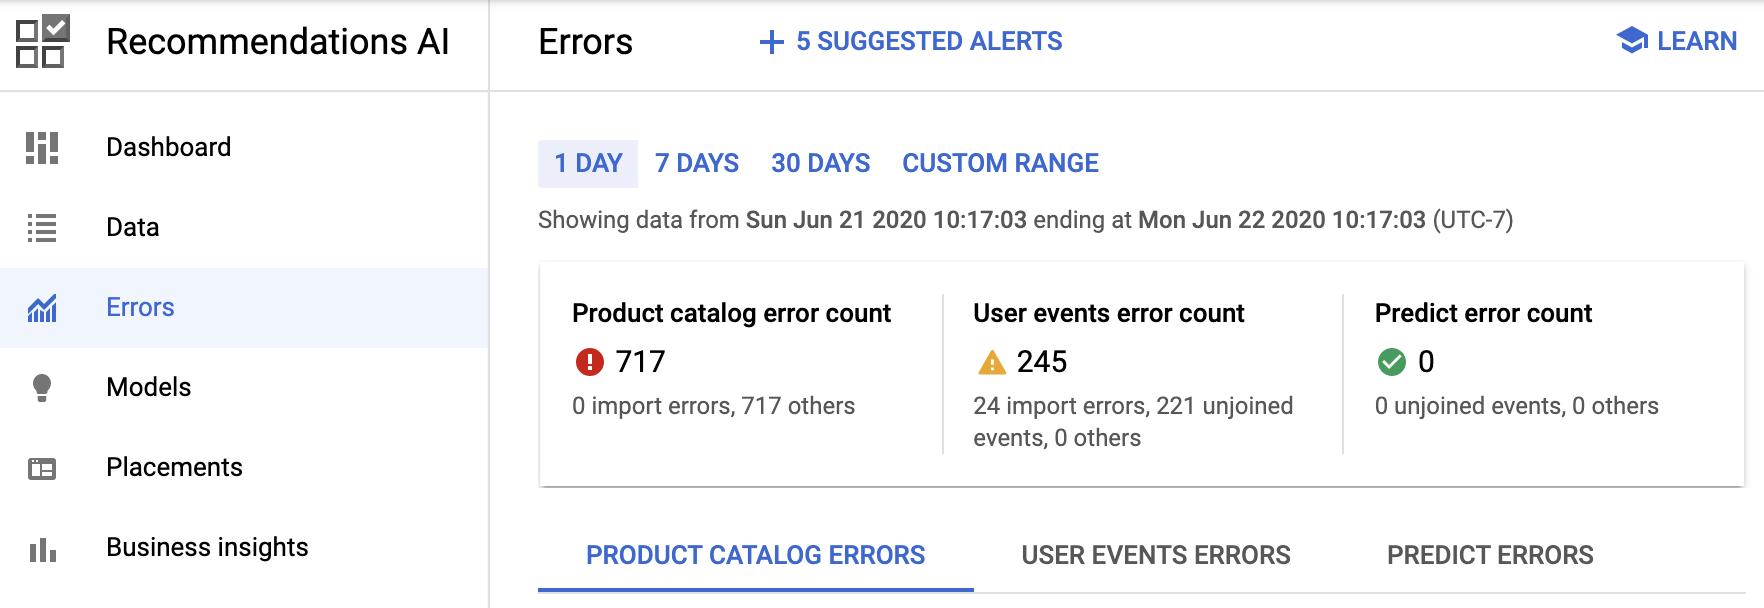
Click the tabs to choose between Product catalog errors, User event errors, and Predict errors. The system also logs errors from your User Event/Catalog Imports, such as a malformed line in your Google Cloud Storage file. Our system logs up to 100 errors per import file. You can define the time period for which errors are displayed and filter based on the error type.
You can click an individual error to see the logs for that error in Cloud Logging.
This is an example of logs for an individual error:
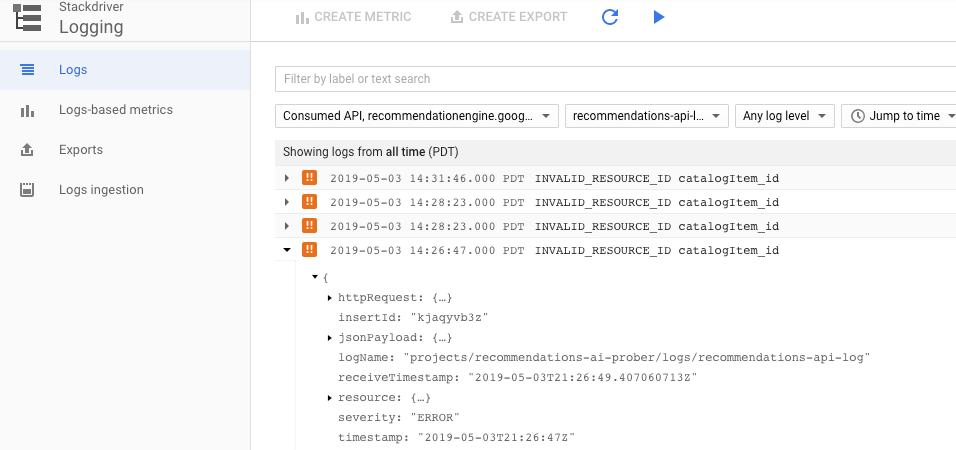
You can open individual error logs by expanding that log. Error logs provide more detail about the request, including the request and response payloads and error details. This information can help you determine where the erroneous method call is located in your site.
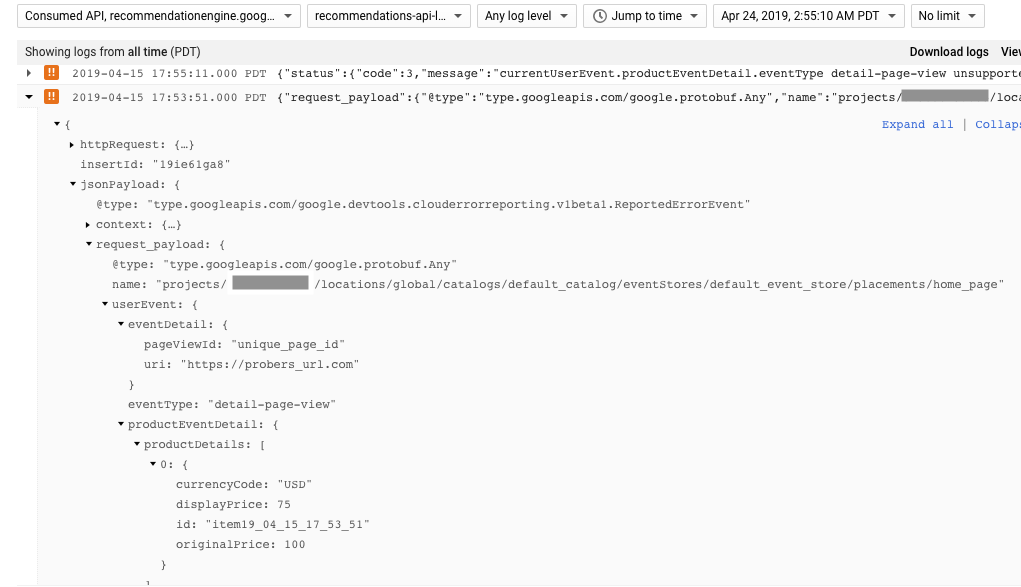
For example, here is an error log expanded to show the request payload information:
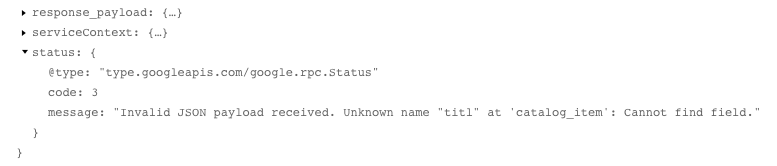
For invalid JSON errors, you can get more information about the issue by
expanding the status field:
Seeing status for a specific integration operation
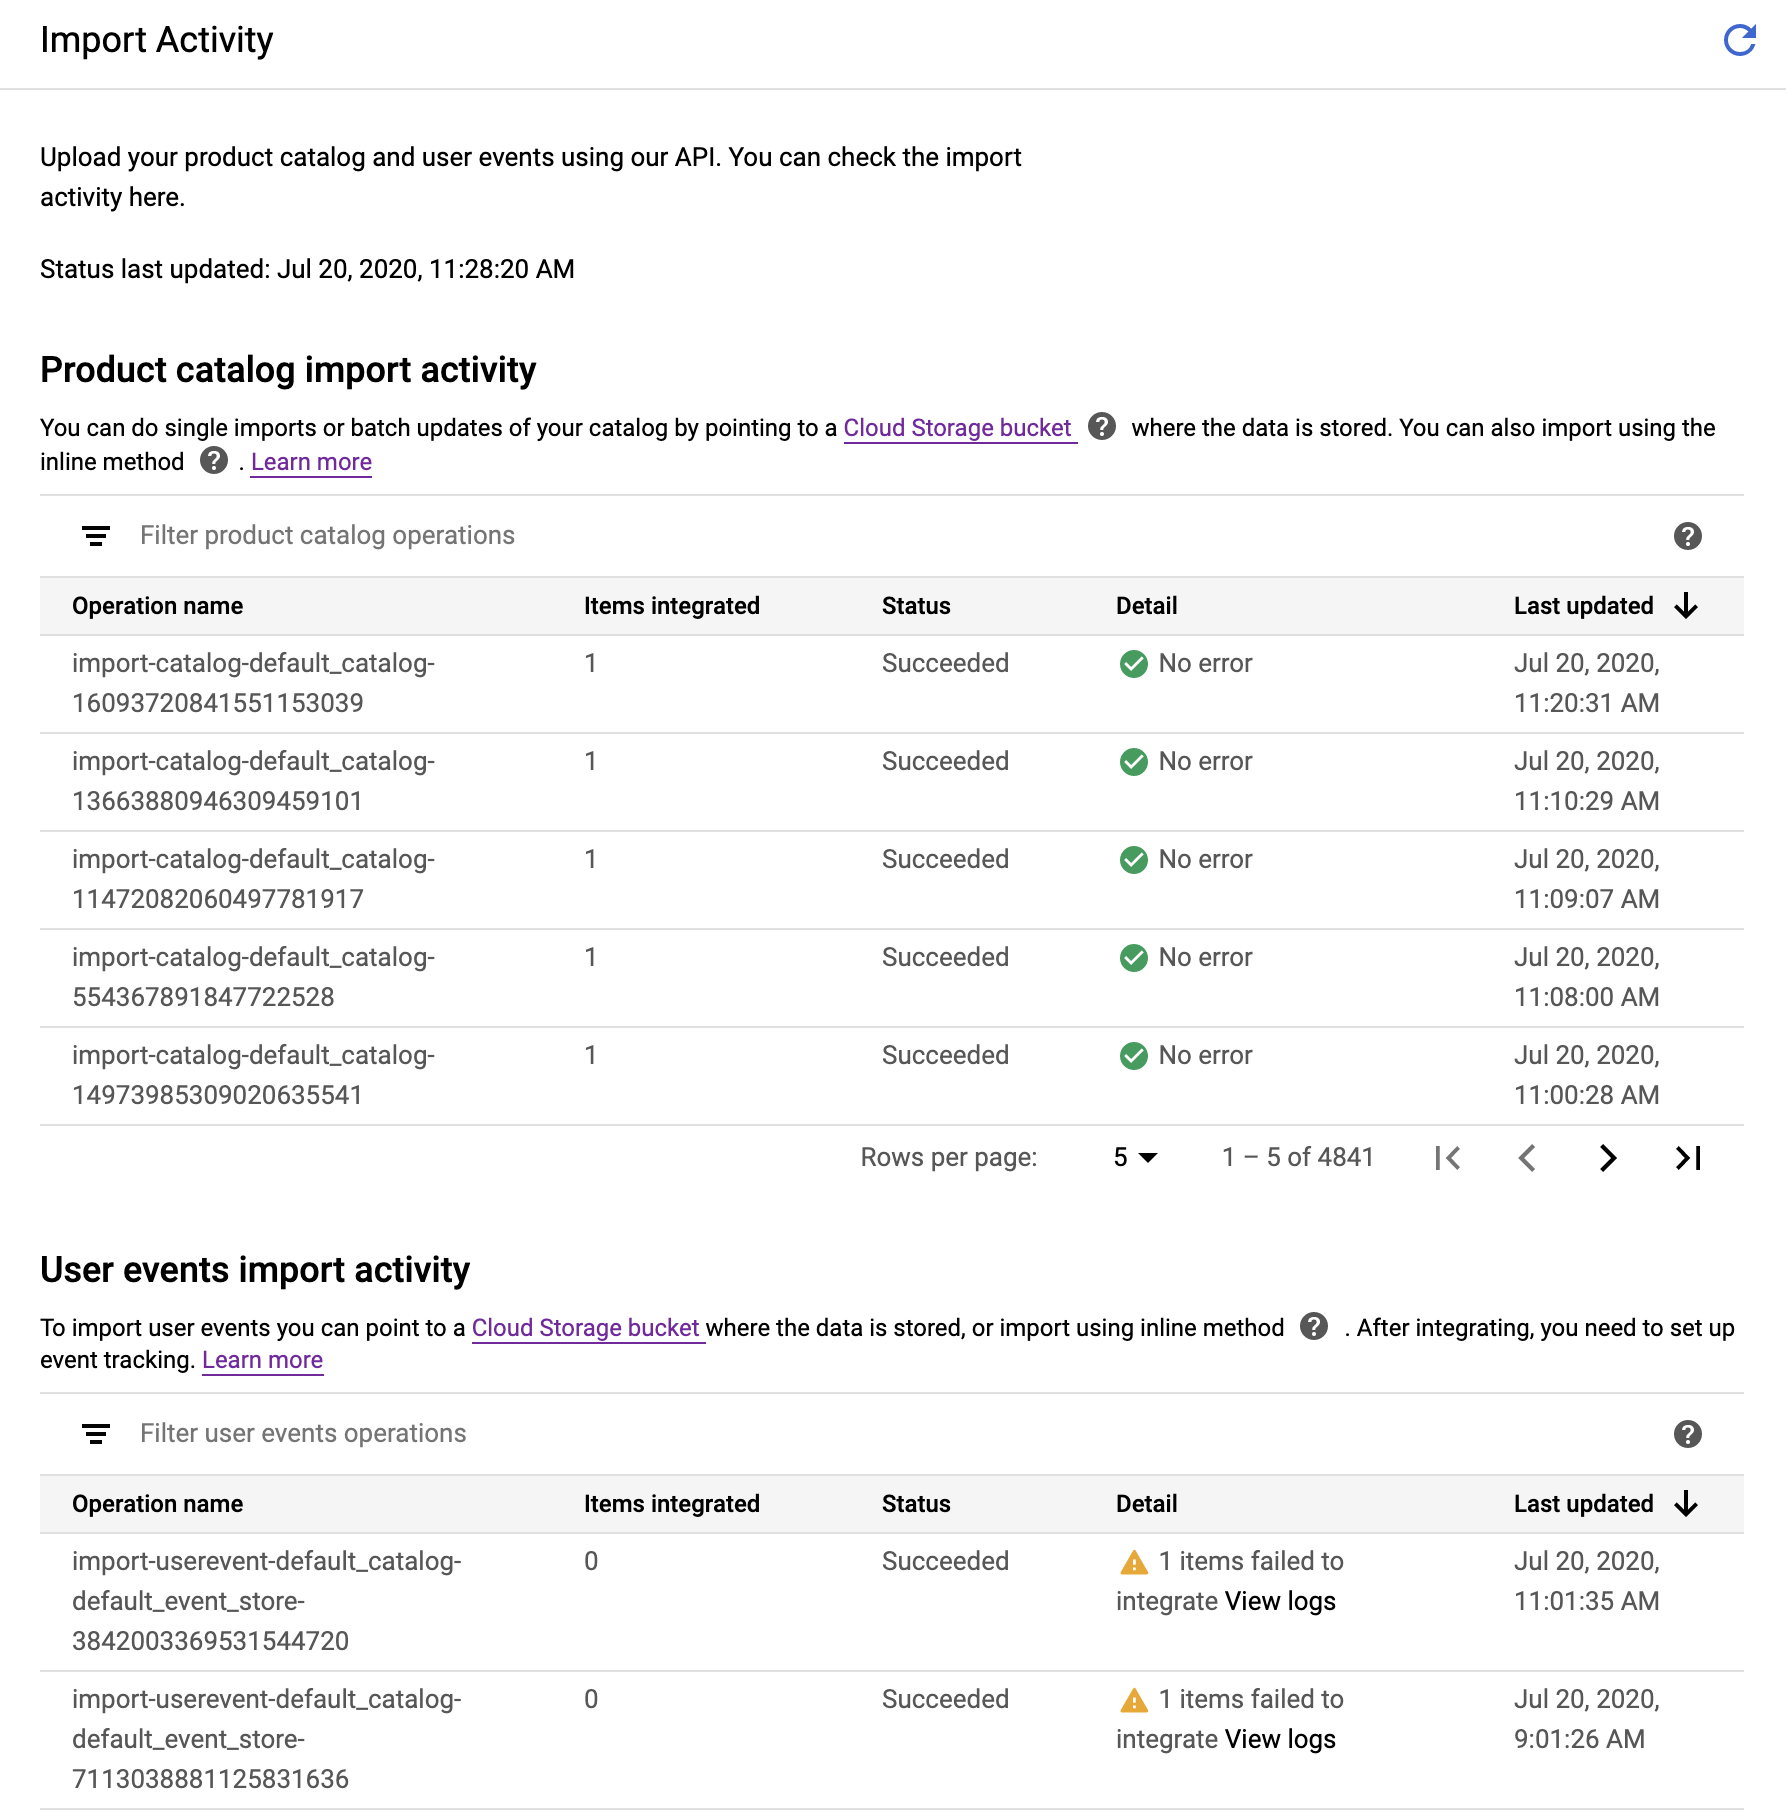
You can see status for a specific integration operation by using the integration activity panel:
Go to the Recommendations AI Data page in the Google Cloud console.
Go to the Recommendations AI Data pageOpen the import activity panel by clicking View Import Activity on the right side of the button bar.
You can inspect errors for specific integration operations.
Click View logs in the Detail column of any operation with an error to inspect its log files in Cloud Logging.
Error types
MISSING_FIELD: A required field value is not set; for example, a catalog item is missing its title.INVALID_TIMESTAMP: The timestamp is invalid, such as being too far in the future, or formatted incorrectly.FIELD_VALUE_TOO_SMALL: The value in the field is lower than the required minimum; for example, a negative price.INCORRECT_JSON_FORMAT: The JSON in the request is incorrectly formatted, such as a missing { bracket.INVALID_LANGUAGE_CODE: The language code is incorrectly formatted.FIELD_VALUE_EXCEEDED: The value in the field is higher than the allowed maximum.INVALID_RESOURCE_ID: The resource ID is invalid; for example, a non-existentcatalog_idin the resource name.FIELD_SIZE_EXCEEDED: The number of entries in the field exceeds the maximum limit.UNEXPECTED_FIELD: A field that was expected to be empty has a value; for example, a transaction for a detail page view event.INVALID_FORMAT: The field is not formatted correctly, such as a malformed stringRESOURCE_ALREADY_EXISTS: You tried to create a resource that already exists, such as a previously created catalog item.INVALID_API_KEY: The API key does not match the project in your request.INSUFFICIENT_PERMISSIONS: You do not have permission to execute the request; this error is usually related to the lack of a required IAM permission.UNJOINED_WITH_CATALOG: The request includes a catalog item ID that does not exist in the catalog. Make sure your catalog is up to date.BATCH_ERROR: The request has multiple errors; for example, an inline import with 10 items that fail validation for different reasons.INACTIVE_RECOMMENDATION_MODEL: You queried a model that is not active for serving.ABUSIVE_ENTITY: The visitor ID or user ID associated with the request has sent an abnormal number of events in a short period of time.FILTER_TOO_STRICT: The prediction request filter blocked all prediction results. Generic (not personalized) popular items are returned, unless the call specifiedstrictFilteringas false, in which case no items are returned. Some common reasons why this issue occurs:- You are specifying a filter tag that doesn't exist in your catalog. It can take up to a day for a filter tag update to take effect.
- Your filter is too narrow.
Viewing logs directly
You can also open your log files directly in Logging. For example, this link opens logs for all Recommendations AI errors in the past hour:
Viewing high-level data load metrics
After your data upload system is running successfully, you can also use the Catalog and Event tabs on the Recommendations AI Data page to view high-level error metrics for your data ingestion to ensure that everything is running smoothly.
You can also add alerts to let you know if something goes wrong with your data upload system.
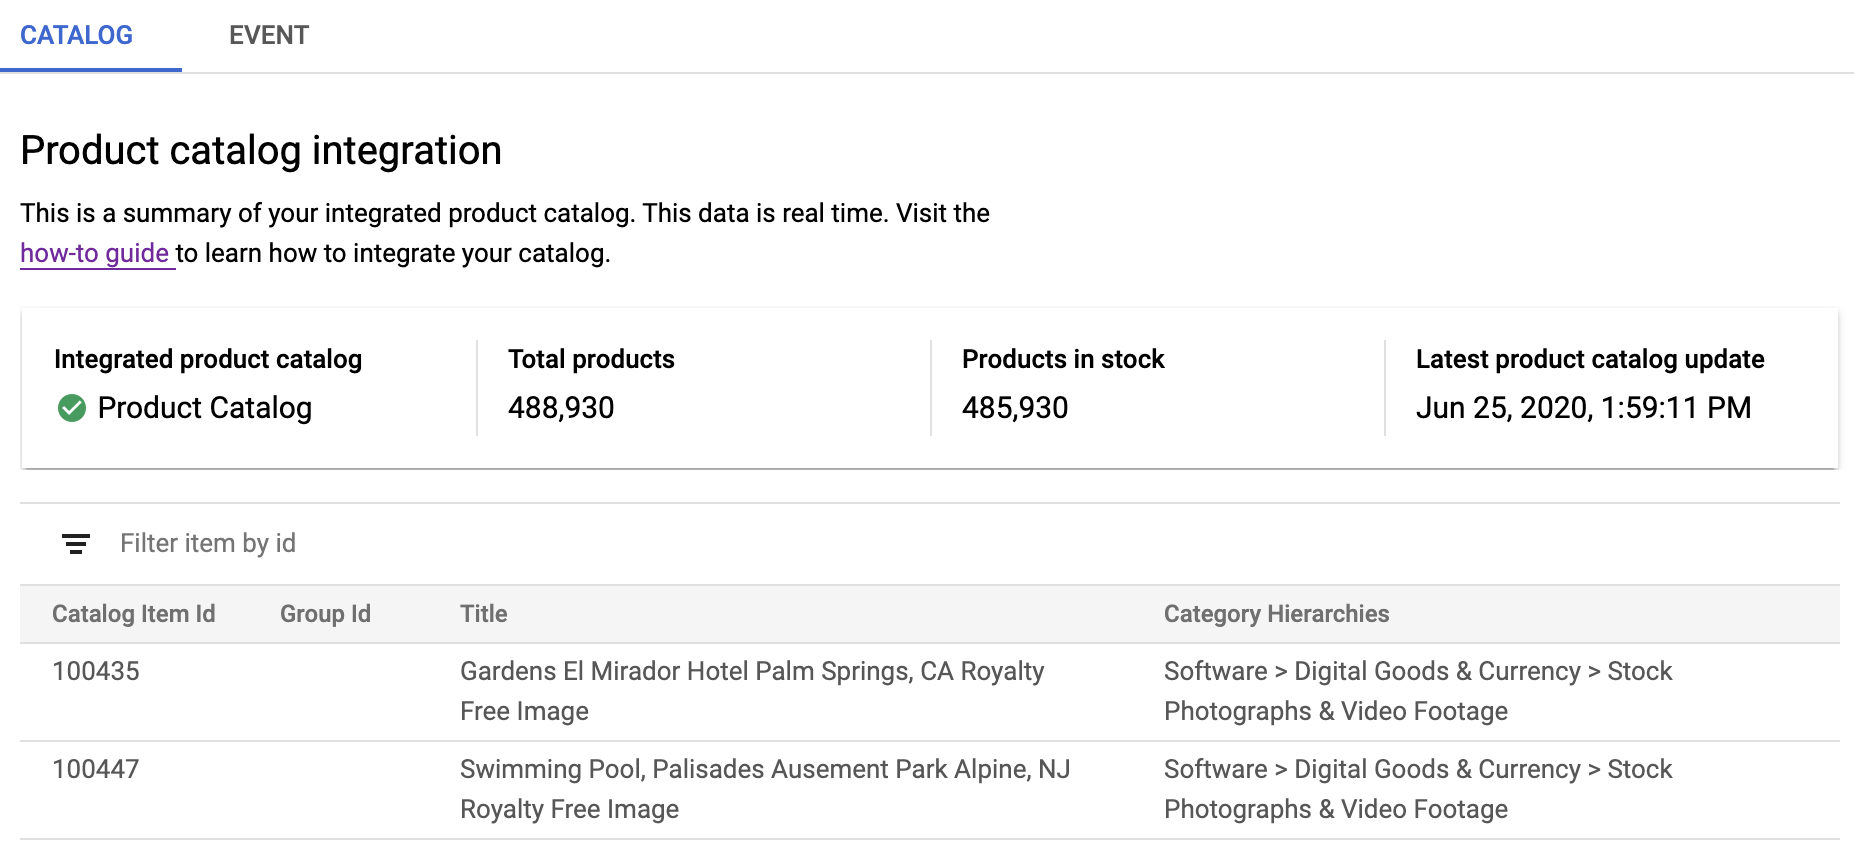
Catalog data summary
The high-level data statistics in the Catalog tab show you how many items you have imported, how many are in stock, and when you last imported catalog items.
You can also see a preview of the catalog items you have uploaded, and filter based on the catalog item ID.
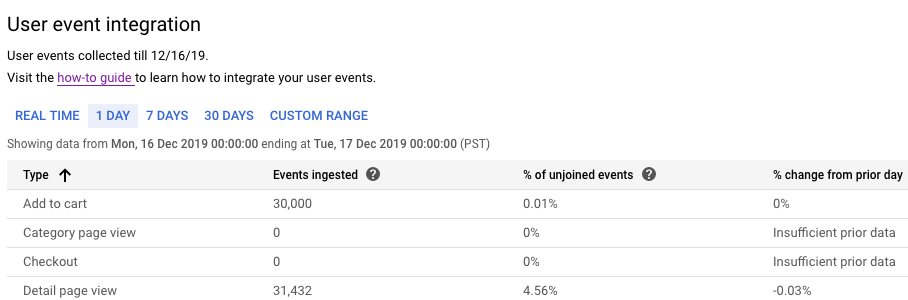
User event recording statistics
For each type of user event, you can see in the Event tab how many you have recorded, how many of those were not able to associated with a catalog item (unjoined events), and how the numbers differed from previous periods. You can choose a time period of one day, one week, and one month, or you can enter a custom time range.
You can see a graph of user events ingested over time, and filter it by user event type.
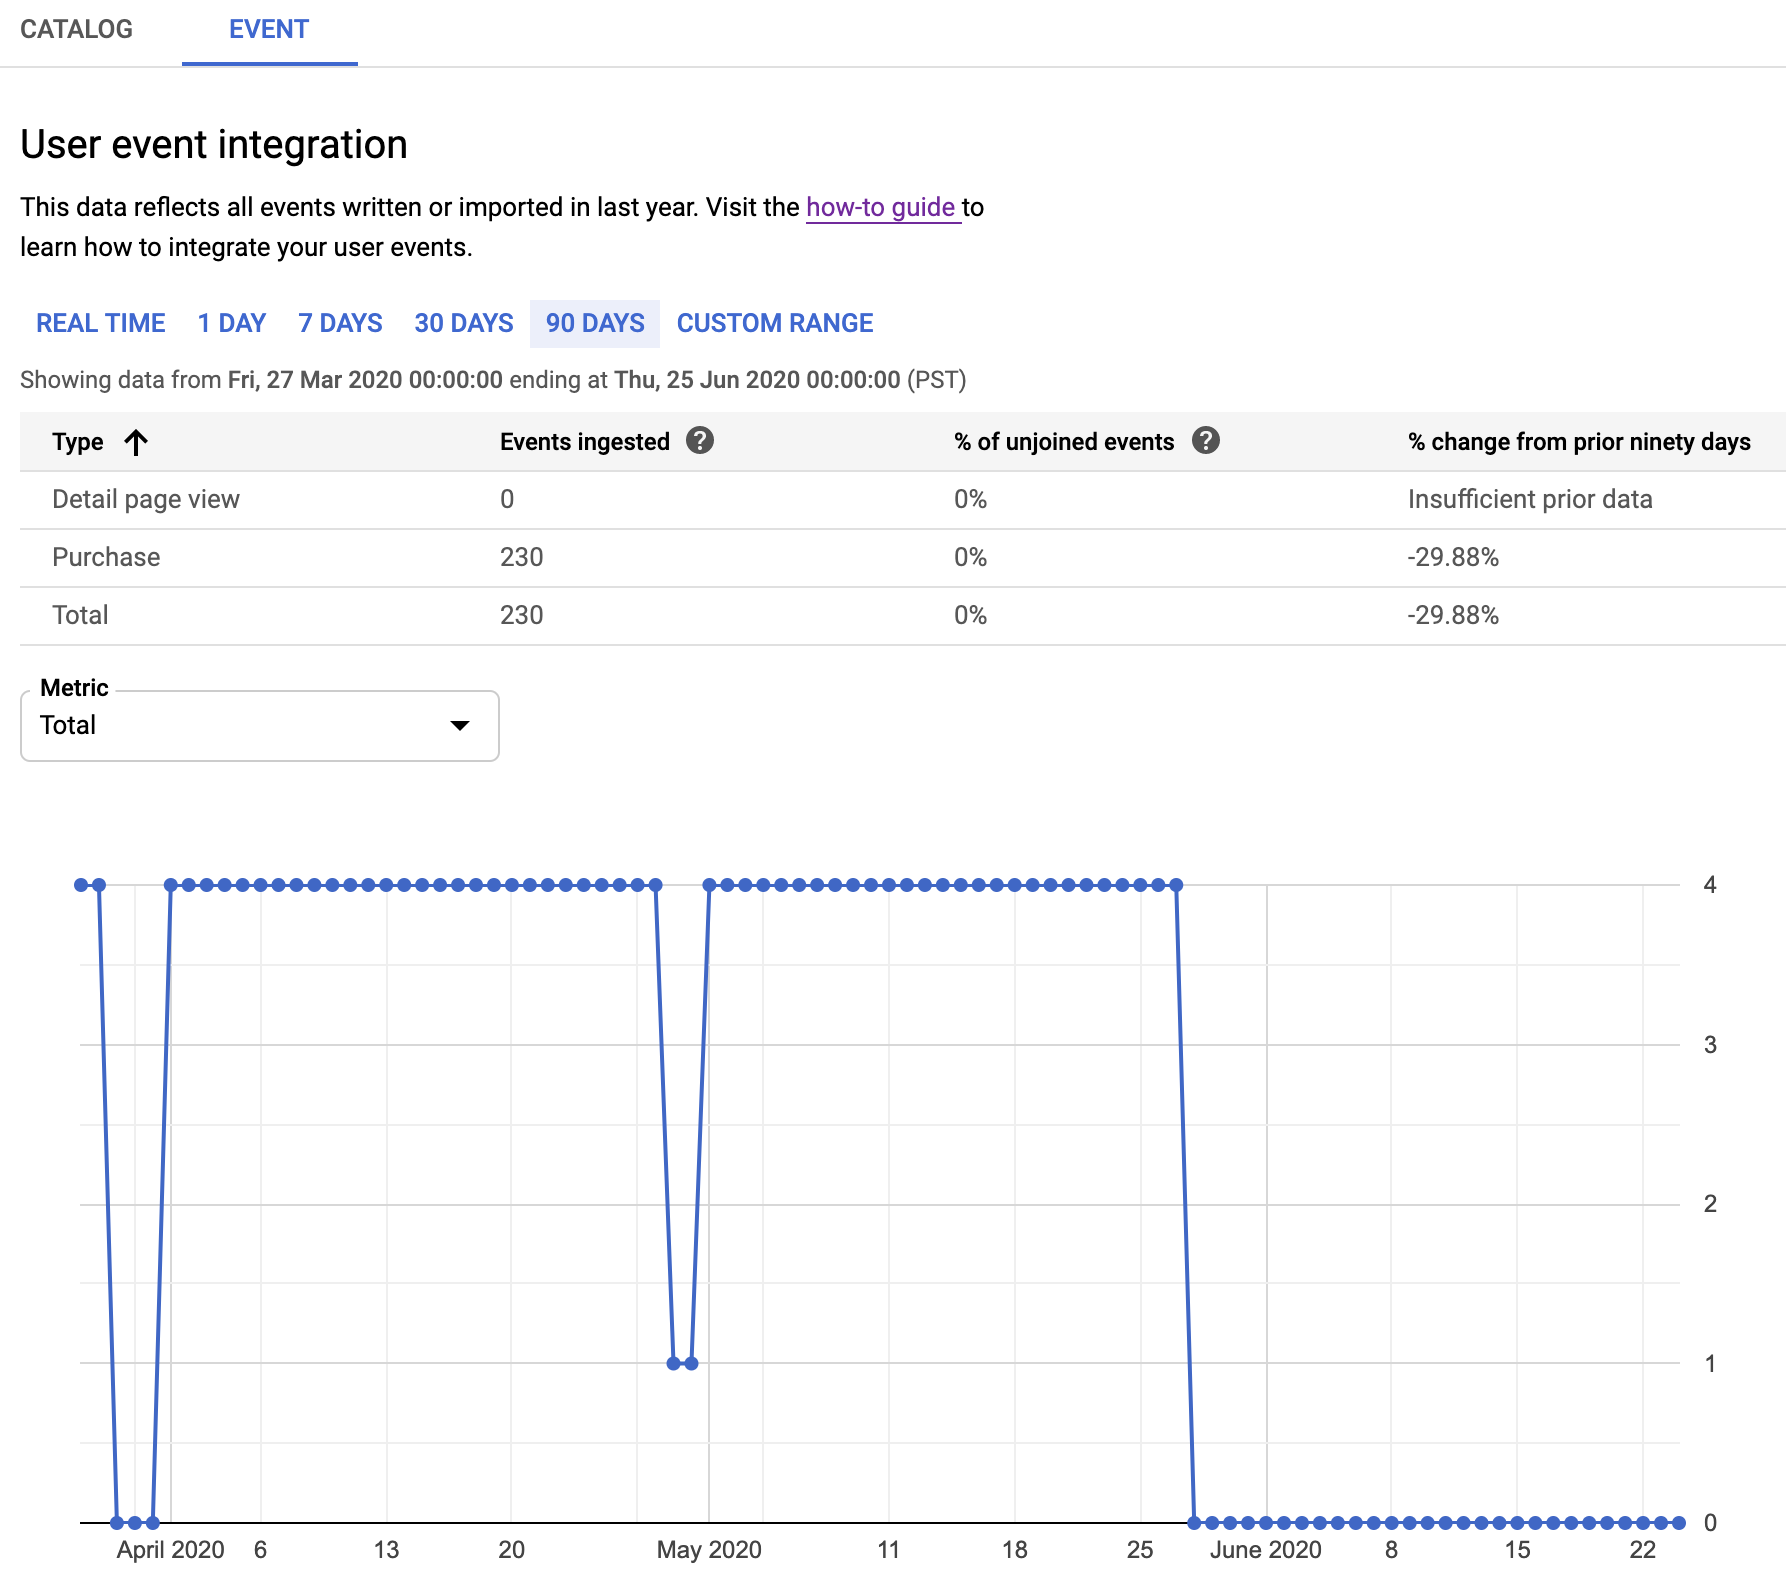
Unjoined events
When a user event or prediction request refers to a catalog item that has not been uploaded to Recommendations AI, it is an unjoined event. Unjoined user events are still logged, and unjoined prediction requests are handled, but neither can be used to further enhance the model for future predictions. For this reason, you should make sure that your unlogged event percentage is very low for both user events and prediction requests.
You can see your unjoined user event percentage in the Event tab on the Data page:
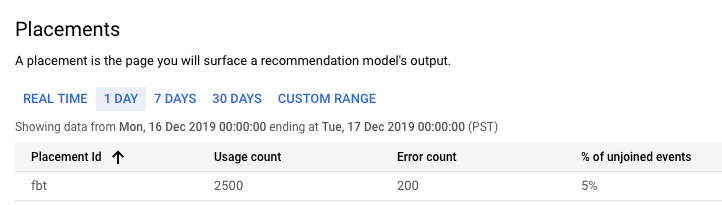
You can see your unjoined prediction request percentage on the Placements page:
API errors
You can see a graph of API errors over time, displayed by method name, by clicking View API metrics on the button bar of the Errors page.
What's next
- Learn how to set error alerts for your data feeds.
- Learn more about Error Reporting.
- Learn more about viewing logs in Logging.