Interact with the flame graph
Cloud Profiler displays profiling data by using flame graphs. For a conceptual introduction, see Flame graphs.
The flame graph is composed of frames. Each frame represents a function in the service:
The width of a frame corresponds to its consumption of the metric being analyzed. The top frame, for example, represents the entire service and consumes 100% of the metric being analyzed. Therefore, this frame is shown as full width.
By default, the frame color corresponds, where possible, to the function's package. If package information is unavailable, as with Node.js, the names of the source files are used to color the function blocks. In a call stack, a change in block color means a transition from one package to another. You can change the way the frames are colored. For more information, see Color mode.
The flame graph shows one or more call stacks with the values averaged over a set of profiles:
- Each individual profile represents data collected one time per minute from a single instance of the configured service in a single Compute Engine zone. The collection period for a profile varies with the profile type. See Profile collection for more information.
- A maximum of 250 profiles are averaged. If there are more than 250 profiles available, 250 of them are selected randomly as a sample set.
- The top frame, or "root", in a flame graph represents the entire service. Under the "root" frame, is another frame or set of frames making up the second row in the graph. Each of these color-coded frames is a top-level call made by the service. Under each of those colored function frames is another set of function frames, each of which is responsible for some part of the resource of the frame above it. The hierarchy of function frames in the graph represents the call sequence, and the width of a frame represents that function or method's contribution to the resource consumption.
For example, the profiler graph of the consumed heap for the docdemo-service
shows that the service calls different top-level frames, one
of them is the Go runtime's main function. The width of these
top-level frames show the majority of the heap is consumed by the call stack
involving Go runtime's main,
application-specific main, allocOnce, and allocImpl:
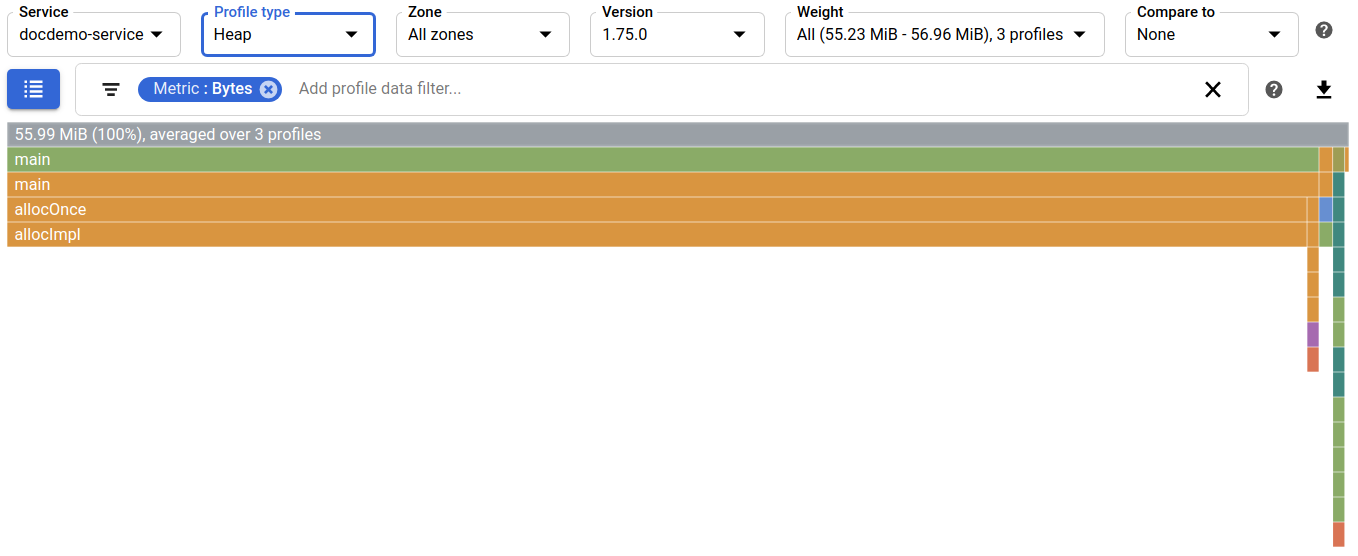
The root frame displays metric consumption information.
Hovering over a frame
When you hold the pointer over a frame in the flame graph, a frame tooltip opens and displays additional information about the frame:
- Function name
- Function filename
- Absolute usage and percentage usage
In the metric consumption information, the prefix total indicates that the metric-value and percentage are for a function and its children. In contrast, the prefix self indicates the metric-value and percentage are for the function with the consumption of its children excluded.
The dialog also includes buttons:
- Focus: Focuses the graph on the current frame's function.
- Show stacks: Adds a filter to only show the stacks that include this frame's function.
- Show history: Opens the history view for the frame's function.
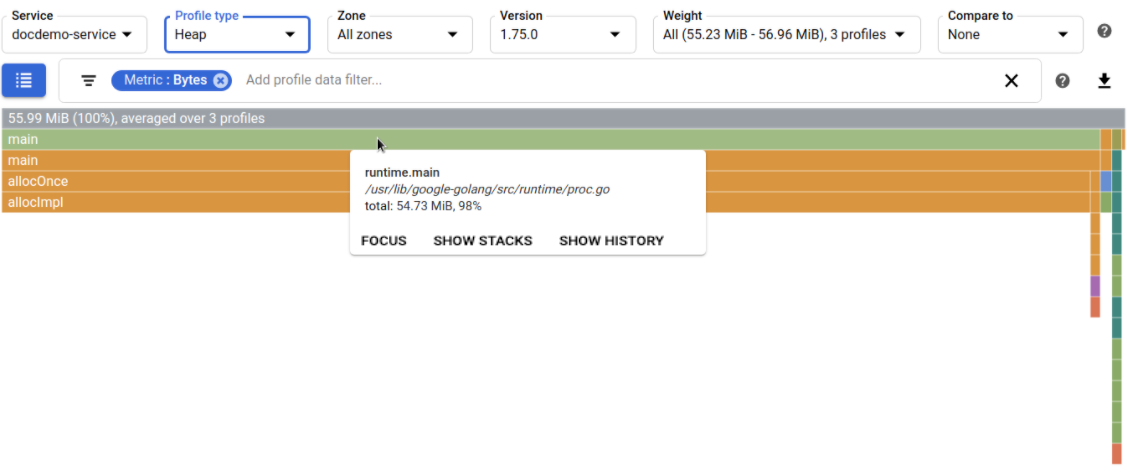
In this example, the tooltip shows that the runtime.main function
is located in the /usr/local/go/src/runtime/proc.go file. The
metric consumption information shows that runtime.main and its children
consume 54.73 MiB of
memory, or about 98% of the total memory consumed by the program:
Selecting a frame
When you select a frame, the flame graph is redrawn with that frame shown full width and the colors higher in the call stack are muted. Selecting on a frame doesn't change any settings, it only changes how the graph is displayed. To revert to the original view, select the root (top) frame.
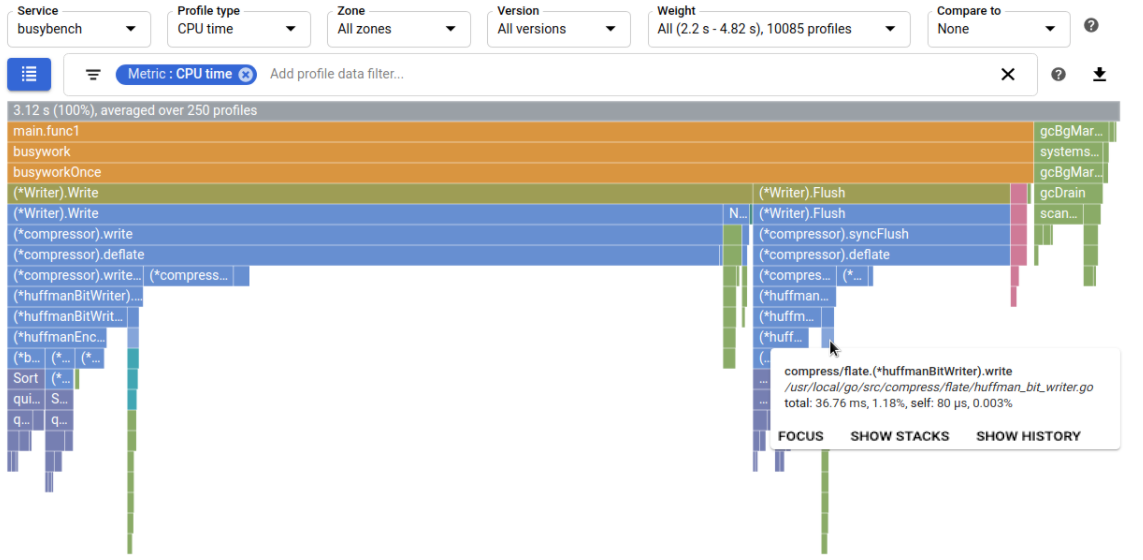
In the following example, the pointer
is on a tiny frame and it is difficult to view the call stack. The tooltip
identifies (*huffmanBitWriter).write as the frame function:
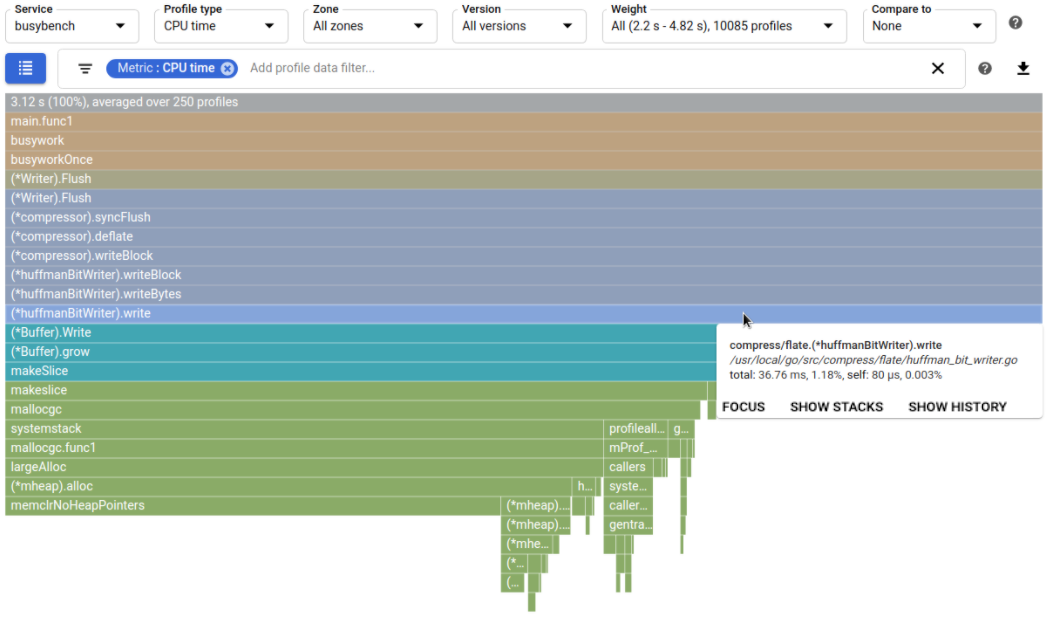
After you select the frame, the graph is redrawn, making the call stack more visible:
What's next
- Filter the flame graph.
- Focus the flame graph on a function.
- View historical trends.
- Compare profiles.