OpenCensus is a free, open source project whose libraries:
- Provide vendor-neutral support for the collection of metric and trace data across multiple languages.
- Can export the collected data to various backend applications, including Cloud Monitoring, by using exporters.
Although Cloud Monitoring provides an API that supports defining and collecting user-defined metrics, it is a low-level, proprietary API. OpenCensus provides an API that follows the style of the language community, along with an exporter that sends your metric data to Cloud Monitoring through the Monitoring API for you.
OpenCensus also has good support for application tracing; see OpenCensus Tracing for a general overview. Cloud Trace recommends using OpenCensus for trace instrumentation. To collect both metric and trace data from your services, you can use a single distribution of libraries. For information about using OpenCensus with Cloud Trace, see Client Libraries for Trace.
Before you begin
To use Cloud Monitoring, you must have a Google Cloud project with billing enabled. If necessary, do the following:
-
In the Google Cloud console, on the project selector page, select or create a Google Cloud project.
-
Make sure that billing is enabled for your Google Cloud project.
- Ensure the Monitoring API is enabled. For details, see Enabling the Monitoring API.
For applications running outside of Google Cloud, your Google Cloud project must authenticate your application. Typically, you configure authentication by creating a service account for your project and by configuring an environment variable.
For applications you run on an Amazon Elastic Compute Cloud (Amazon EC2) instance, create the service account for the instance's AWS Connector project.
For information about creating a service account, see Getting started with authentication.
Install OpenCensus
To use metrics collected by OpenCensus in your Google Cloud project, you must make the OpenCensus metrics libraries and the Stackdriver exporter available to your application. The Stackdriver exporter exports the metrics that OpenCensus collects to your Google Cloud project. You can then use Cloud Monitoring to chart or monitor those metrics.
Go
To authenticate to Monitoring, set up Application Default Credentials. For more information, see Set up authentication for a local development environment.
Using OpenCensus requires Go version 1.11 or higher. The dependencies are handled automatically for you.Java
To authenticate to Monitoring, set up Application Default Credentials. For more information, see Set up authentication for a local development environment.
For Maven, add the following to thedependencies element in your
pom.xml file:
Node.js
To authenticate to Monitoring, set up Application Default Credentials. For more information, see Set up authentication for a local development environment.
- Before installing the OpenCensus core and exporter libraries, make sure you've prepared your environment for Node.js development.
- The easiest way to install OpenCensus is with
npm:
npm install @opencensus/core
npm install @opencensus/exporter-stackdriver
- Place the
requirestatements shown below at the top of your application's main script or entry point, before any other code:
Python
To authenticate to Monitoring, set up Application Default Credentials. For more information, see Set up authentication for a local development environment.
Install the OpenCensus core and Stackdriver exporter libraries by using the following command:pip install -r opencensus/requirements.txt
The requirements.txt file is in the GitHub repository for these samples,
python-docs-samples.
Write user-defined metrics with OpenCensus
Instrumenting your code to use OpenCensus for metrics involves three steps:
- Import the OpenCensus stats and OpenCensus Stackdriver exporter packages.
- Initialize the Stackdriver exporter.
- Use the OpenCensus API to instrument your code.
The following example is a minimal program that writes metric data using OpenCensus. The program runs a loop and collects latency measures, and when the loop finishes, it exports the stats to Cloud Monitoring and exits:
Go
To authenticate to Monitoring, set up Application Default Credentials. For more information, see Set up authentication for a local development environment.
Java
To authenticate to Monitoring, set up Application Default Credentials. For more information, see Set up authentication for a local development environment.
Node.js
To authenticate to Monitoring, set up Application Default Credentials. For more information, see Set up authentication for a local development environment.
Python
To authenticate to Monitoring, set up Application Default Credentials. For more information, see Set up authentication for a local development environment.
The program creates an OpenCensus view
that is called task_latency_distribution. This string becomes part of the
name of the
metric when it is exported to Cloud Monitoring. See Retrieving metric
descriptors to see how the OpenCensus view is realized
as a Cloud Monitoring metric descriptor.
You can therefore use the view name as a search string when selecting a metric
to chart.
-
In the navigation panel of the Google Cloud console, select Monitoring, and then select leaderboard Metrics explorer:
- In the Metric element, expand the Select a metric menu,
enter
OpenCensus/task_latency_distributionin the filter bar, and then use the submenus to select a specific resource type and metric:- In the Active resources menu, select your monitored resource. If you run the program on a local environment, then select Global.
- In the Active metric categories menu, select Custom.
- In the Active metrics menu, select Task latency distribution.
- Click Apply.
The following screenshot shows the time series collected after running the program on a local environment:
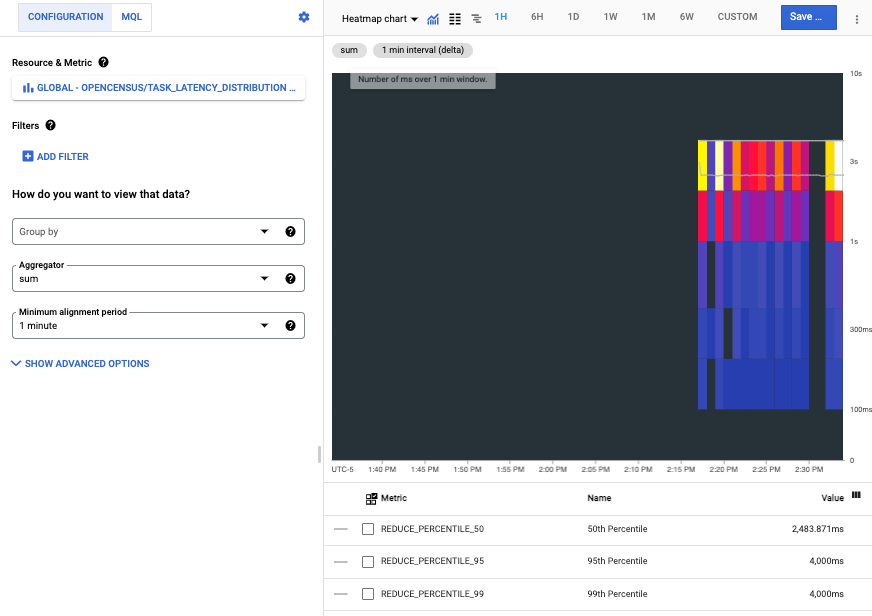
Each bar in the heatmap represents one run of the program, and the colored components of each bar represent buckets in the latency distribution.
Read OpenCensus metrics in Cloud Monitoring
You use user-defined metrics, including those metrics written by OpenCensus, like built-in metrics. You can chart them, set alerts on them, read them, and otherwise monitor them.
This section illustrates how to use APIs Explorer to read metric data. For information about how read metric data by using the Cloud Monitoring API or by using client libraries, see the following documents:
- List metric and resource types explains how to list and examine the resource types and metric types in your system.
- Retrieve time-series data explains how to retrieve time series data from metrics using the Monitoring API.
For example, the screenshot shown in the previous section is from Metrics Explorer. When you use charting tools, we recommend that you use the name of the OpenCensus view to filter the list of metrics. For more information, see Select metrics when using Metrics Explorer.
Retrieve metric descriptors
To retrieve the metric data by using the Monitoring API directly,
you need to know the Cloud Monitoring names
to which the OpenCensus metrics were exported. You can determine these names
by retrieving the metric descriptors that the exporter creates and then
looking at the type field. For details on metric descriptors, see
MetricDescriptor.
To view the metric descriptors created for the exported metrics, do the following:
- Go to the
metricDescriptors.listreference page. In the Try this API widget on the reference page, complete the following fields:
Enter the name of your project in the
namefield. Use the following name structureprojects/PROJECT_ID. This document uses a project with the IDa-gcp-project.Enter a filter into the
filterfield. There are many metric descriptors in a project. Filtering lets you eliminate those descriptors that aren't of interest.For example, because the name of the OpenCensus view becomes part of metric name, you can add a filter like this:
metric.type=has_substring("task_latency_distribution")The key
metric.typeis a field in a type embedded in a time series. SeeTimeSeriesfor details.Click Execute.
The following shows the returned metric descriptor:
    {
      "metricDescriptors": [
        {
          "name": "projects/a-gcp-project/metricDescriptors/custom.googleapis.com/opencensus/task_latency_distribution",
          "labels": [
            {
              "key": "opencensus_task",
              "description": "Opencensus task identifier"
            }
          ],
          "metricKind": "CUMULATIVE",
          "valueType": "DISTRIBUTION",
          "unit": "ms",
          "description": "The distribution of the task latencies",
          "displayName": "OpenCensus/task_latency_distribution",
          "type": "custom.googleapis.com/opencensus/task_latency_distribution"
        }
      ]
    }
This line in the metric descriptor tells you the name of the metric type in Cloud Monitoring:
"type": "custom.googleapis.com/opencensus/task_latency_distribution"
You now have the information you need to manually retrieve the data
associated with the metric type. The value of the type field is also
shown in the Google Cloud console when you chart the metric.
Retrieve metric data
To manually retrieve time-series data from a metric type, do the following:
- Go to the
timeSeries.listreference page. In the Try this API widget on the reference page, complete the following fields:
- Enter the name of your project in the
namefield. Use the following name structureprojects/PROJECT_ID. In the
filterfield, enter the following value:metric.type="custom.googleapis.com/opencensus/task_latency_distribution"Enter values for the
interval.startTimeandinterval.endTimefields. These values must be entered as a timestamp, for example2018-10-11T15:48:38-04:00. Ensure thestartTimevalue is earlier than theendTimevalue.Click the Execute button.
- Enter the name of your project in the
The following shows the result of one such retrieval:
    {
      "timeSeries": [
        {
          "metric": {
            "labels": {
              "opencensus_task": "java-3424@docbuild"
            },
            "type": "custom.googleapis.com/opencensus/task_latency_distribution"
          },
          "resource": {
            "type": "gce_instance",
            "labels": {
              "instance_id": "2455918024984027105",
              "zone": "us-east1-b",
              "project_id": "a-gcp-project"
            }
          },
          "metricKind": "CUMULATIVE",
          "valueType": "DISTRIBUTION",
          "points": [
            {
              "interval": {
                "startTime": "2019-04-04T17:49:34.163Z",
                "endTime": "2019-04-04T17:50:42.917Z"
              },
              "value": {
                "distributionValue": {
                  "count": "100",
                  "mean": 2610.11,
                  "sumOfSquaredDeviation": 206029821.78999996,
                  "bucketOptions": {
                    "explicitBuckets": {
                      "bounds": [
                        0,
                        100,
                        200,
                        400,
                        1000,
                        2000,
                        4000
                      ]
                    }
                  },
                  "bucketCounts": [
                    "0",
                    "0",
                    "1",
                    "6",
                    "13",
                    "15",
                    "44",
                    "21"
                  ]
                }
              }
            }
          ]
        },
        [ ... data from additional program runs deleted ...]
      ]
    }
The returned metric data includes the following:
- Information about the monitored resource on which the data was collected.
OpenCensus can automatically detect
gce_instance,k8s_container, andaws_ec2_instancemonitored resources. This data came from a program run on a Compute Engine instance. For information on using other monitored resources, see Set monitored resource for exporter. - Description of the kind of metric and the type of the values.
- The actual data points collected within the time interval requested.
How Monitoring represents OpenCensus metrics
Direct use of the Cloud Monitoring API for user-defined metrics is supported; using it is described in Create user-defined metrics with the API. In fact, the OpenCensus exporter for Cloud Monitoring uses this API for you. This section provides some information about how Cloud Monitoring represents the metrics written by OpenCensus.
The constructs used by the OpenCensus API differ from the constructs used by Cloud Monitoring, as does some use of terminology. Where Cloud Monitoring refers to “metrics”, OpenCensus sometimes refers to “stats”. For example, the component of OpenCensus that sends metric data to Cloud Monitoring is called the “stats exporter for Stackdrdiver”.
For an overview of the OpenCensus model for metrics, see OpenCensus Metrics.
The data models for OpenCensus stats and Cloud Monitoring metrics do not fall into a neat 1:1 mapping. Many of the same concepts exist in each, but they are not directly interchangeable.
An OpenCensus view is analogous to the
MetricDescriptorin the Monitoring API. A view describes how to collect and aggregate individual measurements. Tags are included with all recorded measurements.An OpenCensus tag is a key-value pair. An OpenCensus tag corresponds generally to the
LabelDescriptorin the Monitoring API. Tags let you capture contextual information that you can use to filter and group metrics.An OpenCensus measure describes metric data to be recorded. An OpenCensus aggregation is a function applied to data used to summarize it. These functions are used in exporting to determine the
MetricKind,ValueType, and unit reported in the Cloud Monitoring metric descriptor.An OpenCensus measurement is a collected data point. Measurements must be aggregated into views. Otherwise, the individual measurements are dropped. An OpenCensus measurement is analogous to a
Pointin the Monitoring API. When measurements are aggregated in views, the aggregated data is stored as view data, analogous to aTimeSeriesin the Monitoring API.
What's next
OpenCensus provides the authoritative reference documentation for its metrics API and for the Stackdriver exporter. The following table provides links to these reference documents:
Language API Reference Documentation Exporter Documentation Quickstart Go Go API Stats and Trace Exporters Metrics Java Java API Stats Exporter Metrics NodeJS NodeJS API Stats Exporter Metrics Python Python API Stats Exporter Metrics