This document describes how to create user-defined metrics and how to write this metric data by using the Cloud Monitoring API. User-defined metrics use the same elements that the built-in Cloud Monitoring metrics use:
- A set of data points.
- Metric-type information, which tells you what the data points represent.
- Monitored-resource information, which tells you where the data points originated.
User-defined metrics, sometimes called custom metrics, can be used in the same way as built-in metrics. That is, you can create charts and alerts for this metric data.
To instrument your application, we recommend that you use a vendor-neutral instrumentation framework that is open source, such as OpenTelemetry, instead of vendor- and product-specific APIs or client libraries. For information about instrumenting your application, see Instrumentation and observability.
Before you begin
To learn about the structures that underlie all metrics, see Metrics, time series, and resources
To use Cloud Monitoring, you must have a Google Cloud project with billing enabled. When necessary, do the following:
-
In the Google Cloud console, on the project selector page, select or create a Google Cloud project.
-
Make sure that billing is enabled for your Google Cloud project.
- Ensure the Monitoring API is enabled. For details, see Enabling the Monitoring API.
For applications running outside of Google Cloud, your Google Cloud project must authenticate your application. Typically, you configure authentication by creating a service account for your project and by configuring an environment variable.
For applications you run on an Amazon Elastic Compute Cloud (Amazon EC2) instance, create the service account for the instance's AWS Connector project.
For information about creating a service account, see Getting started with authentication.
Create a user-defined metric type
To create a user-defined metric, you either define a
MetricDescriptor object
that specifies various information about the metric,
or you write metric data. When you write metric data,
Monitoring creates the metric descriptor for you based
on the structure of the data you provide.
For information about designing a metric descriptor, see
Metric descriptors for user-defined metrics.
Auto-creation of metric descriptors
If you write metric data when a metric descriptor for that user-defined metric doesn't yet exist, then a metric descriptor is created automatically. However, this new metric descriptor might not be exactly what you want; auto-creation of metric descriptors involves some assumptions and defaults.
Cloud Monitoring creates a new MetricDescriptor when
the TimeSeries object included in a call to
timeSeries.create references a
Metric object that specifies a nonexistent
metric-type name.
Cloud Monitoring uses the following rules to populate the
MetricDescriptor:
type: The type is copied from theMetricobject'stypefield.name: The name is created from the project ID in the method call and the value of thetypein theMetricobject.labels: The labels that appear in theMetricobject. Each label descriptor in the new metric descriptor has the following fields:key: the label key in theMetricobject.valueType:STRINGdescription: not set
metricKind: The metric kind is set toGAUGEunless you specify themetricKindparameter of theTimeSeriesobject. When you specify themetricKind, the new metric has that kind. You can specify onlyGAUGEandCUMULATIVEkinds.valueType: The value type is taken from the typed value of thePointbeing written. The value type must beBOOL,INT64,DOUBLE, orDISTRIBUTION. When you specify a value type in thevalueTypefield of theTimeSeries, that type must match the type of thePoint.unit: not setdescription:"Auto created custom metric.".displayName: not set
In a single timeSeries.create call, you can
include multiple TimeSeries
objects that refer to the same nonexistent metric type. In that case,
the labels in the new metric descriptor consist of the union of all the labels
in the Metric objects in all the time series in this call to
create.
Next step: See Write user-defined metrics.
Manual creation of metric descriptors
To create a metric descriptor, do the following:
Determine the structure of your metric descriptor. For help in making these choices, you can browse the built-in metrics and look at their time series data:
Choose a metric name for your user-defined metric.
Choose a display name and description for your metric. The display name is used in the Google Cloud console.
Choose a project or projects in which to define your user-defined metric and write its time series data. When you need the same metric in several projects, make identical definitions of the metric in each project.
To write user-defined metrics from resources managed by an AWS account, create the metric descriptor in the AWS connector project for that account.
Determine the metric's kind, value type, and (optionally) units. Not all value types and metric kinds are supported for user-defined metrics. For more information on these fields, see Value types and metric kinds.
Choose the metric's labels—their names, value types, and descriptions.
Determine the monitored resources against which the metric data is written. Choose from the following list:
aws_ec2_instance: Amazon EC2 instance.dataflow_job: Dataflow job.gae_instance: App Engine instance.gce_instance: Compute Engine instance.generic_node: User-specified computing node.generic_task: User-defined task.gke_container: GKE container instance.global: Use this resource when no other resource type is suitable. For most use cases,generic_nodeorgeneric_taskare better choices thanglobal.k8s_cluster: Kubernetes cluster.k8s_container: Kubernetes container.k8s_node: Kubernetes node.k8s_pod: Kubernetes pod.
Create a
MetricDescriptorobject, and then pass it as an argument to a call to themetricDescriptors.createmethod.
It is usually an error to call
metricDescriptors.create using the same type
name as an existing metric descriptor. However, if all the fields of the
new MetricDescriptor object match the fields of the
existing descriptor exactly, then it isn't an error but it has no effect.
In the following example, you create a gauge metric.
Protocol
To create a metric descriptor, use the
metricDescriptors.create method.
You can execute this method by using the APIs Explorer widget on the
method's reference page. See APIs Explorer for more
information.
The following are the sample parameters to
metricDescriptors.create:
- name (URL):
projects/[PROJECT_ID] Request body: supply a
MetricDescriptorobject such as the following:{ "name": "", "description": "Daily sales records from all branch stores.", "displayName": "Sales", "type": "custom.googleapis.com/stores/sales", "metricKind": "GAUGE", "valueType": "DOUBLE", "unit": "{USD}", "labels": [ { "key": "store_id", "valueType": "STRING", "description": "The ID of the store." }, ], }
Supply these values to the fields in the widget, using your project's ID
in place of [PROJECT_ID]:
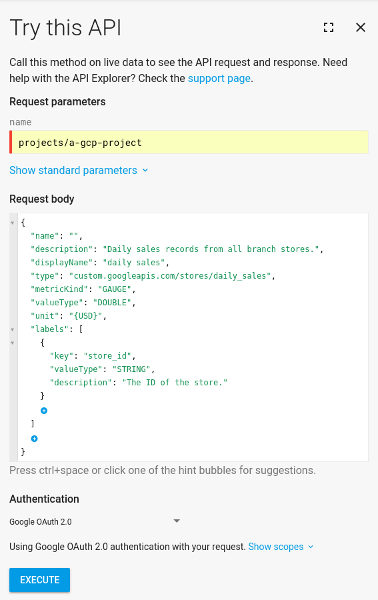
Click the Execute button to run the method.
When creating a new metric, the name field in the
MetricDescriptor is ignored and can be omitted. The create method returns
the new metric descriptor with the name field filled in, which in this
example would be the following:
"name": "projects/[PROJECT_ID]/metricDescriptors/custom.googleapis.com/stores/daily_sales"
If, for example, you want to get a metric's descriptor, you use this name.
C#
To authenticate to Monitoring, set up Application Default Credentials. For more information, see Set up authentication for a local development environment.
Go
To authenticate to Monitoring, set up Application Default Credentials. For more information, see Set up authentication for a local development environment.
Java
To authenticate to Monitoring, set up Application Default Credentials. For more information, see Set up authentication for a local development environment.
Node.js
To authenticate to Monitoring, set up Application Default Credentials. For more information, see Set up authentication for a local development environment.
PHP
To authenticate to Monitoring, set up Application Default Credentials. For more information, see Set up authentication for a local development environment.
Python
To authenticate to Monitoring, set up Application Default Credentials. For more information, see Set up authentication for a local development environment.
Ruby
To authenticate to Monitoring, set up Application Default Credentials. For more information, see Set up authentication for a local development environment.
See Troubleshoot API calls if you have difficulty.
Next step: See Write user-defined metrics.
Write user-defined metrics
You can write data only to metric types for user-defined metrics. To write your data,
use the timeSeries.create method.
When the time series exists, this
method appends a new data point to the existing time series. When the
time series doesn't exist, this method creates it and appends the data.
You write data points by passing a list of TimeSeries objects to
timeSeries.create.
The maximum list size is 200
and each object in the list must specify a different time series:
- The values of
metricandresourcefields identify a specificTimeSeriesobject. These fields represent the metric type of the data and the monitored resource from which the data was collected. - Omit the fields
metricKindandvalueType; they are ignored when writing data points. Each
TimeSeriesobject must contain only a singlePointobject:- The point's value and time interval must be consistent with the metric
type's definition. For information on time intervals for different
metric kinds, see
TimeInterval. - The point's time interval must be later than any point already in the time series.
- The end time of the interval must not be more than 25 hours in the past or more than five minutes in the future.
- The point's value and time interval must be consistent with the metric
type's definition. For information on time intervals for different
metric kinds, see
To write more than one point to the same time series, use a separate call to the
timeSeries.createmethod for each point. Don't write data to a single time series faster than one point each 5 seconds. When you add data points to different time series, there is no rate limitation.
Protocol
To write metric data, use the timeSeries.create
method.
You can execute this method by using the APIs Explorer widget on the
method's reference page. See APIs Explorer for more
information.
To write a point to the stores/daily_sales metric created in the
Manual creation of metric descriptors:
- Go to the reference page for
timeSeries.create. - Supply the parameters below to the APIs Explorer widget.
- Click the Execute button.
Use the following sample parameters:
- name:
projects/[PROJECT_ID] request body: include a list of
TimeSeriesobjects. The following sample has only one time series in the list.{ "timeSeries": [ { "metric": { "type": "custom.googleapis.com/my_metric", "labels": { "my_label": "my_value" } }, "resource": { "type": "gce_instance", "labels": { "project_id": "[PROJECT_ID]", "instance_id": "1234567890123456789", "zone": "us-central1-f" } }, "points": [ { "interval": { "endTime": "2018-06-01T10:00:00-04:00" }, "value": { "doubleValue": 123.45 } } ] } ] }
C#
To authenticate to Monitoring, set up Application Default Credentials. For more information, see Set up authentication for a local development environment.
Go
To authenticate to Monitoring, set up Application Default Credentials. For more information, see Set up authentication for a local development environment.
Java
To authenticate to Monitoring, set up Application Default Credentials. For more information, see Set up authentication for a local development environment.
Node.js
To authenticate to Monitoring, set up Application Default Credentials. For more information, see Set up authentication for a local development environment.
PHP
To authenticate to Monitoring, set up Application Default Credentials. For more information, see Set up authentication for a local development environment.
Python
To authenticate to Monitoring, set up Application Default Credentials. For more information, see Set up authentication for a local development environment.
Ruby
To authenticate to Monitoring, set up Application Default Credentials. For more information, see Set up authentication for a local development environment.
See Troubleshoot API calls if you have difficulty.
Delete user-defined metrics
To delete a user-defined metric, delete its metric descriptor. You can't delete the time-series data stored in your Google Cloud project; however, deleting the metric descriptor renders the data inaccessible. The data expires and is deleted according to the data retention policy.
You can't delete the metric descriptor for a built-in metric.
To delete your metric descriptor, call the
metricDescriptors.delete method.
Protocol
To delete a metric descriptor, use the
metricDescriptors.delete method.
You can execute this method by using the APIs Explorer widget on the
method's reference page. See APIs Explorer for more
information.
To delete the stores/daily_sales metric created in
Manual creation of metric descriptors:
- Go to the
reference page for
metricDescriptors.delete: Supply the name of the metric descriptor to the APIs Explorer widget:
name:
projects/[PROJECT_ID]/metricDescriptors/custom.googleapis.com/stores/daily_salesClick the Execute button.
C#
To authenticate to Monitoring, set up Application Default Credentials. For more information, see Set up authentication for a local development environment.
Go
To authenticate to Monitoring, set up Application Default Credentials. For more information, see Set up authentication for a local development environment.
Java
To authenticate to Monitoring, set up Application Default Credentials. For more information, see Set up authentication for a local development environment.
Node.js
To authenticate to Monitoring, set up Application Default Credentials. For more information, see Set up authentication for a local development environment.
PHP
To authenticate to Monitoring, set up Application Default Credentials. For more information, see Set up authentication for a local development environment.
Python
To authenticate to Monitoring, set up Application Default Credentials. For more information, see Set up authentication for a local development environment.
Ruby
To authenticate to Monitoring, set up Application Default Credentials. For more information, see Set up authentication for a local development environment.
See Troubleshoot API calls if you have difficulty.
Modify a user-defined metric
To modify a user-defined metric, you must update the
MetricDescriptor object that defines the metric.
The only supported modification is to add labels.
To add labels to an existing user-defined metric, use the
timeSeries.create method and include the new
labels with the time-series data. The labels are added to the metric
descriptor when the labels you attempt to write are valid and the total number
of labels is less than 30.
The time series data is then written as though the label had been there from the beginning.
If you want to do more than add new labels, then you must delete and recreate the metric descriptor. In this case, you lose all the time series data previously collected for the old metric descriptor. See Delete user-defined metrics for more information.
You can't rename a metric.