Migrate for Compute Engine provides metrics for migration components via Google Cloud Observability. Categories of metrics include:
- Health of your Migrate for Compute Engine infrastructure
- Storage usage
- Network usage
Viewing metrics in Google Cloud Observability
In the Google Cloud console, select Google Cloud Observability > Monitoring.
Confirm that the Project hosting your Migrate for Compute Engine infrastructure is shown to the right of the Google Cloud Observability logo.
On the left side of the screen choose Resources > Metrics Explorer.
For Resource Type, choose Generic Node.
If your project hosts multiple Velostrata Managers, you can Filter by Namespace.
Select a Metric from the dropdown, or copy and paste a Metric Name from the list below.
Finding your namespace
- Sign in to your Velostrata Manager
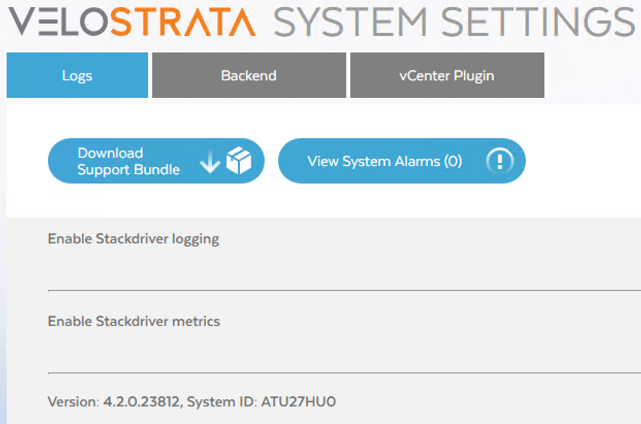
- Click System Settings.
- Click the Logs tab.
- Your Namespace is the value after System ID on the bottom of the page.
 .
.
Appendix: Metric Names
| Category | Google Cloud Observability Metric Name | Description |
|---|---|---|
| Disk Usage | scsi_target/data_access/received_command_count | Commands received by Cloud Extension |
| Disk Usage | scsi_target/data_access/command_latency/avg | Average latency on commands executed by Cloud Extensions |
| Disk Usage | scsi_target/data_access/total_bytes_count | Total bytes sent or received by the Cloud Extension |
| Disk Usage | scsi_target/usage/active_vms | Active number of VMs hosted by the Cloud Extension |
| Disk Usage | scsi_target/rpc/received_bytes_count | Total bytes received by the Cloud Extension |
| Disk Usage | scsi_target/rpc/sent_bytes_count | Total bytes sent by the Cloud Extension |
| Disk Usage | scsi_target/remote_access/received_command_count | Total commands received by the Cloud Extension |
| Disk Usage | scsi_target/remote_access/total_bytes_count | Total bytes read from the source platform by the Cloud Extension |
| Network Health | network/pinger/latency/min | Minimum latency on pings sent by the Cloud Extension |
| Network Health | network/pinger/latency/avg | Average latency on pings sent by the Cloud Extension |
| Network Health | network/pinger/latency/max | Maximum latency on pings sent by the Cloud Extension |
| Network Health | network/pinger/failed_request_count | Count of failed pings sent by the Cloud Extension |
| System Health | healthchecks/healthcheck_severity | Severity of health checks on the Cloud Extension |
| Velostrata Manager | management/management_tasks/finished_count | Count of finished tasks initiated by Velostrata Manager |
| Velostrata Manager | management/management_tasks/failed_count | Count of failed tasks initiated by Velostrata Manager |
| Velostrata Manager | management/management_tasks/duration_in_seconds/p50 | Average duration of tasks initiated by Velostrata Manager |
| Velostrata Manager | management/management_tasks/duration_in_seconds/p95 | 95th percentile duration of tasks initiated by Velostrata Manager |
| Velostrata Manager | management/management_tasks/running_count | Number of currently running tasks initiated by Velostrata Manager |
| Velostrata Manager | management/management_tasks/total_count | Total number of tasks initiated by Velostrata Manager |
| Velostrata Manager | management/management_api_impl/failed_api_calls_count | Failed API calls initiated by Velostrata Manager |
| Velostrata Manager | management/cloud_provider/request_count | Count of requests to GCP initiated by Velostrata Manager |
| Velostrata Manager | management/cloud_provider/failed_request_count | Count of failed requests to GCP initiated by Velostrata Manager |
| Velostrata Manager | management/mux_connectivity/backend_reconnect_count | Count of reconnects between Velostrata Backend and Velostrata Manager |
| Velostrata Manager | system/cpu_utilization/used | CPU usage of Velostrata Manager |
| Velostrata Manager | system/process/tomcat8/jvm/gct | Garbage collection time of Tomcat JVM hosting the Velostrata Manager |
| Velostrata Manager | system/service_start_count/management | Count of stop/starts of the Velostrata Manager |
| Velostrata Manager | healthchecks/healthcheck_severity | Severity of health checks on Velostrata Manager |
| Backend | read_storage_pool/concurrency | Concurrent requests to Velostrata Backend read storage pool |
| Backend | read_storage_pool/received_command_count | Commands received by Velostrata Backend |
| Backend | read_storage_pool/total_bytes_count | Total bytes read by Velostrata Backend read storage pool |
| Backend | read_storage_pool/failed_command_count | Failed commands to Velostrata Backend read storage pool |
| Backend | read_storage_pool/high_latency/num_above_10000_ms | Count of requests by Velostrata Backend that took more than 10 seconds to fulfill |
| Backend | read_storage_pool/command_latency/avg | Average latency commands to Velostrata Backend read storage pool |
| Backend | vsphere/received_command_count | Count of commands to vSphere sent by Velostrata Backend |
| Backend | vsphere/total_bytes_count | Total bytes read from vSphere by Velostrata Backend |
| Backend | vsphere/command_latency/avg | Average latency of commands to vSphere sent by Velostrata Backend |
| Backend | rpc/received_bytes_count | Command bytes received from Velostrata Manager by Velostrata Backend |
| Backend | rpc/sent_bytes_count | Command bytes sent from Velostrata Manager by Velostrata Backend |
| Backend | system/service_start_count/backend | Count of stop/starts of the Velostrata Backend service |
| Backend | healthchecks/healthcheck_severity | Severity of health checks on the Velostrata Backend. |
| Backend | vsphere/failed_command_count | Count of failed commands issued to vSphere by Velostrata Backend |