After your product launches, you can monitor its analytics to gain insight into how users find, deploy, and run your products, including how your marketing campaigns are performing.
To see your analytics:
- Open Producer Portal.
Click Analytics. The direct link to the Analytics page is
https://console.cloud.google.com/producer-portal/analytics.
In the analytics dashboard, you can see a view of your data, grouped by specific time intervals, and filter the data by the types of products you sell. You can also view the data organized by how users found your product, such as through a Google search, a direct link, or a specific referral URL.
The following sections describe the metrics that you can track in your dashboard.
To filter your data by time, product type, or acquisition channel, open the filter panel at the right of the page. If the panel isn't open, click Show panel on the top-right.
Analyzing your conversion rate
The Conversion rate tab shows how users move through the journey of discovering your products, and then deploying them or signing up, as applicable. Use these insights to develop and refine your go-to-market initiatives for more effective acquisitions.
You can group your data by solution or by channel, which shows how users found
your product's Cloud Marketplace listing. Each channel is a combination
of the source of the traffic, such as a social networking site,
and the medium, such as a paid ad. For example, the
Paid Social channel indicates traffic that came from a paid
ad on a major social network.
Learn about the default channels in Google Analytics.
If you use custom URLs for marketing campaigns, use the following sections to create your campaigns and add them for tracking.
Creating and tracking marketing campaigns
You can track conversion rates for your marketing campaigns by creating
custom URLs that direct users to your product's page. The custom URLs typically
have utm_ parameters that identify how users learned about your product.
For example, if you promoted your product in a winter newsletter to your contacts, the custom URL might look similar to the following:
https://console.cloud.google.com/marketplace/your-organization/solution-name?utm_source=newsletter&utm_medium=email&utm_campaign=winter_promo
After you create a custom URL, you can add the parameters from the URL to Producer Portal. When you select Campaigns, only traffic attributable to the campaign names you added is shown in the chart.
Creating custom URLs for campaigns
To create custom campaign URLs, set the utm_campaign query parameter on your
product URLs to a unique value. For example, the following URL sets the
utm_campaign query parameter to ft_spring_promo for the Google Click to
Deploy Wordpress product:
https://console.cloud.google.com/marketplace/details/click-to-deploy-images/wordpress?utm_campaign=ft_spring_promo
You can also filter and group by utm_source and utm_medium values, as long
as there is also a utm_campaign value defined.
You can use a tool like Google Analytics Campaign URL Builder to create your campaign URLs.
For background information on custom campaigns, and the types of utm_
parameters you can use, see the Google Analytics documentation.
Your products dashboard shows the source, medium, and name of your campaign.
Tracking campaigns in Producer Portal
In Producer Portal, use Add campaigns to add your campaigns for tracking.
Enter the utm_campaign values used in your URLs — just the utm_campaign
value, not the whole query string from the URL. For example, if you had the
following URL:
https://console.cloud.google.com/marketplace/your-organization/solution-name?utm_source=newsletter&utm_medium=email&utm_campaign=winter_promo
You would enter winter_promo as the campaign ID.
The portal can track multiple utm_campaign values, up to a limit of 2000. Use
Manage campaigns to rename or remove existing campaign values. Campaigns are
saved, and are loaded every time you visit Analytics.
There are two special campaign values that are always available: (not set) and
(other). (not set) means traffic with no campaign associated. (other) is
for campaigns with fewer than 5 users with success events.
After you add your campaigns, Producer Portal displays funnel analytics for
all historical visits to your product's details page that include the specified
utm_campaign values. This means you can retrieve for prior marketing
campaigns, not just new ones.

You can filter your campaign data by the following dimensions:
Source: the origin of your traffic, for example, a search engine (google.com), a domain (example.com), or the way you distribute the campaign information, such as
monthly_newsletter.Medium: the category of the source, such as organic search, web referral, paid media, etc. When you set up a custom campaign URL, you can create a custom medium as part of the URL using the
utm_mediumparameter.
Attributing funnel steps to campaign names
In most cases, a user follows your custom link, views a product, configures that product, and then deploys the product in a single session. In these cases, the campaign name is clearly attributable to each stage.
In other cases, a customer might follow the custom link to your listing, but might exit before deploying. If that customer returns later and deploys, that deployment is counted for the campaign that originally brought the customer to your Cloud Marketplace listing. If the customer visited your listing multiple times from different campaigns before finally returning in a session with no campaigns, the earliest campaign where they signed up for or deployed the product is credited.
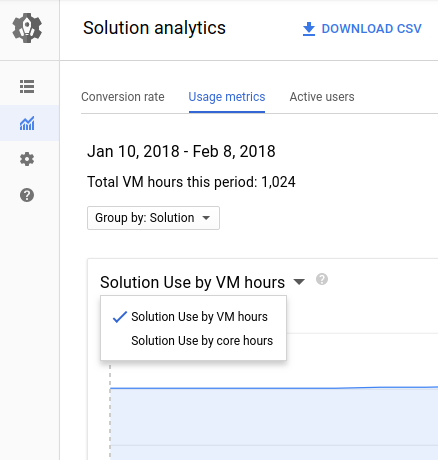
Usage metrics for virtual machines (VMs)
If you offer virtual machine (VM) products on Cloud Marketplace, the Usage metrics tab shows how much your products are being used over time. This information can be useful in answering questions like "Is my product's usage increasing?", or to estimate your monthly revenue for fixed-rate or usage-based billing models. You can group the data by products, deployment zones, and machine types.
You can view your product's usage by VM hours and core hours. Each metric is aggregated for a 24-hour period. For example, if you have 48 VM hours on a given day, that means an average of 2 VMs were running your product during that day. Similarly, if you have 144 core hours on a given day, there might have been 10 customers running g1-small VMs (0.6 cores each), or one customer running a 6-core custom VM.
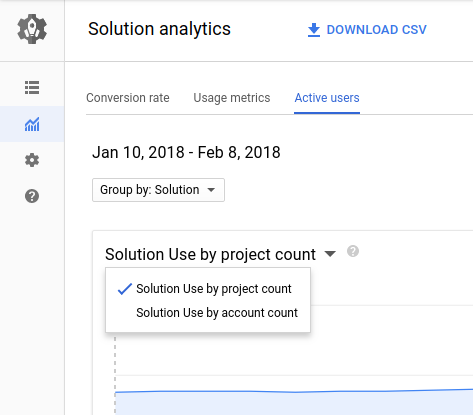
Active users for VMs
If you offer VM-based products, the Active users tab shows how many users are running your product over time.
This information can be used to answer questions like "How many active deployments of my software are there?" and "What size of VM do most of my users run?"
You can view the active users by projects, or by billing accounts. VMs are deployed to Google Cloud projects, but some customers might have multiple projects linked to a single billing account.