The Manage Alerts user page shows a list of all the alerts that you own or follow, or for which you are listed as a recipient, depending on your alerts permissions:
| Permissions | Alerts Displayed on the Manage Alerts User Page |
|---|---|
admin |
Users can see the alerts that they have created or followed, or for which they are listed as a recipient. |
create_alerts |
Users can see the alerts that they have created. |
follow_alerts |
Users can see the alerts that they have followed or for which they are listed as a recipient. |
Accessing the Manage Alerts user page
If your Looker admin has not given you alerts permissions, you will not be able to access this page from the user menu.
To navigate to the Manage Alerts user page, select the Profile menu and then select Alerts.

The Manage Alerts user page provides information about all alerts on the Looker instance. For alerts that you own, are following, or for which you are listed as a recipient, you can view these settings in the Manage Alerts user page table:
| Column | Definition |
|---|---|
| Alert Name | The title of the alert, which is set when the alert is created or edited. The default alert title indicates the conditions that need to be met or exceeded for the alert to be triggered. Select the alert name to open the Alert Details page for that alert. |
| Dashboard | The name of the dashboard that contains the tile with the alert. Follow the link to navigate to the dashboard. None indicates that the alert has become unsynced from its dashboard. To resolve an unsynced alert, see the Effect of dashboard edits on alerts documentation page. |
| Owner | The name of the user who created the alert. |
| Avg Run Time | The duration of the alert query in seconds. |
| Condition Met | A Yes or No that indicates whether the alert conditions were met when the alert query was last run. A -- symbol is displayed if the alert query has not yet run or if the alert query ran but it could not be determined whether the alert conditions were met. This column displays warning icons or error icons related to any warnings or errors that surface when the alert query is run or the alert notification is delivered. Hover over the warning or error icon to see the associated error message, if applicable.A warning icon with a stale alert warning indicates that the data on the dashboard tile did not change between the two most recent alert queries. Read more about this message in the Alert error and warning messages section on this page. |
| Frequency | The frequency at which the alert is checked for whether conditions have been met or exceeded. |
| Status | This column indicates whether the alert is currently active or disabled.
|
| Following | A button that indicates your following status for the alert. See more in the Following alerts section on this page. |
| Activity | A link that directs you to the alert's Activity tab on the Alert Details page. |
| Three-dot menu | A menu from which you can take additional actions on the alert. See more in the Alert management options section on this page. |
If a user deletes the dashboard or dashboard tile that the alert is on, that alert will be disabled: Any followers or recipients will no longer receive notifications when the alert conditions are met. On this page, the name of the dashboard will be deleted immediately for the alert. After the next time the alert query runs, the status will show as Disabled with a tooltip message indicating that the dashboard or dashboard element (tile) has been deleted. An admin can then permanently delete the alert from the three-dot menu that is to the right of the alert.
Filtering alerts
To filter the list of alerts, select the filter icon at the top of the alert list.
You can filter alerts by:
- Frequency — The frequency at which the alert is checked for whether conditions have been met or exceeded
- Minutes — Returns all alerts with a frequency of 15 minutes or 30 minutes
- Hourly — Returns all alerts with a frequency of Hour, 2 hours, 3 hours, 4 hours, 6 hours, 8 hours, or 12 hours
- Daily — Returns all alerts with a Daily frequency of any Time
- Weekly — Returns all alerts with a Weekly frequency of any Day or Time
- Monthly — Returns all alerts with a Monthly frequency of any Day or Time
- Condition Met — Indicates whether the alert conditions were met when the alert query was last run
- Yes — Alert conditions were met or exceeded
- No — Alert conditions were not met or exceeded
- Status — Indicates whether the alert is still being checked against its conditions
- Active — Alert is still being checked against its conditions
- Disabled — Alert is no longer being checked against its conditions
You can impose multiple filters on your results. To delete a filter, select the x next to the filter name. Refreshing the browser will also delete all selected filters.
Grouping alerts
Click the Group Alerts icon to open the Group By menu.
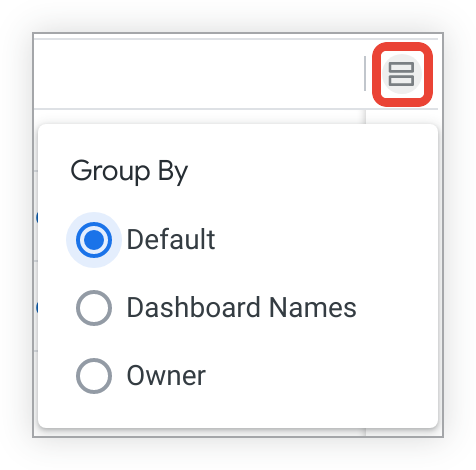
You can group alerts in the following ways:
- Default: No grouping
- Dashboard Names: In alphabetical order by the name of the dashboard on which the alert is set
- Owner: In alphabetical order by alert owner
Alert error and warning messages
The Manage Alerts user page displays any errors or warnings that are surfaced when the alert query is run or the alert notification is delivered. Hover over the warning or error icon in the Condition Met column to see the associated error message.
For alerts that are set up to deliver notifications to the Slack or Slack Attachment (API Token) integrations, the error message Notification delivery failed with existing configuration appears when the alert query determines that the alert conditions have been met but the notification could not be delivered. This failure may occur if something about the Slack configuration has changed since the alert was created — for example, if the Slack workspace that the alert was delivering to was disconnected from the Looker instance or if the Slack channel that the alert was delivering to was deleted, or if Looker cannot connect to the integrations.
Warning: Querying fresh data
A warning icon in the Condition Met column indicates that the data on the dashboard tile upon which the alert is based did not change between the two most recent alert queries. Hovering over this icon displays the message Stale Alert Warning and this text:
The data for this tile did not change between the two most recent alert queries. Verify that the caching policies defined for this dashboard tile are aligned with the alert frequency.
There are a few possible explanations for why the data did not change between queries. If this warning persists, talk to your Looker admin or developer to verify that the caching policies that are defined for this dashboard tile are aligned with the alert frequency setting.
Following alerts
The Following column shows clickable Unfollow and Follow buttons and unclickable Follow buttons.
If you're following the alert, you will see an Unfollow button next to the alert. If you select Unfollow, you will stop receiving notifications when this alert is triggered. After you select Unfollow, you will see different results, depending on your relationship to the alert (owner, recipient, or neither):
- If you own the alert, you will see a Follow button in this column.
- If you do not own the alert, this alert will be removed from this page once you refresh your browser.
- If you were listed as a recipient for an alert's notifications but did not follow the alert from the alert view window, you will see an unclickable Follow button. To unfollow the alert, you must unsubscribe directly from your alert notification.
You will see an unclickable Follow button next to the alert if any of these conditions are true:
- You own the alert but it is unfollowable.
- You were listed as an email recipient for the alert notifications but did not follow the alert from the alert view window. To unfollow the alert, you must unsubscribe directly from your alert notification.
- The alert is configured to send notifications to Slack.
Alert management options
To the right of each alert is a three-dot menu with these options:
- View Alert
- Edit Alert
- Disable Alert (if the alert is currently enabled)
- Enable Alert (if the alert is currently disabled)
Select View Alert to open the Alert Details page.
Select Edit Alert to open the alert window where you can modify the alert's settings. Select Save Alert to save changes or Cancel to close the alert window without saving.
If a user deletes the dashboard or dashboard tile that the alert is on, that alert will be disabled: Any followers or recipients will no longer receive notifications when the alert conditions are met. On this page, the alert owner will see immediately that the name of the dashboard has been deleted for the alert. After the next time the alert query runs, the alert Status will show as Disabled.
Alert Details page
The Alert Details page is a pop-up that shows a summary of alert information, which is configured by the alert owner. Alert owners and followers experience a different view of this page.
You can open the Alert Details page in one of these ways:
- Clicking the three-dot menu to the right of the alert and selecting View Alert
- Clicking the alert title
Configuring the Alert Details page
After you've created an alert, an entry for that alert appears on the Manage Alerts user page. Open the Alert Details page to configure the information about the alert that its followers and recipients can view:
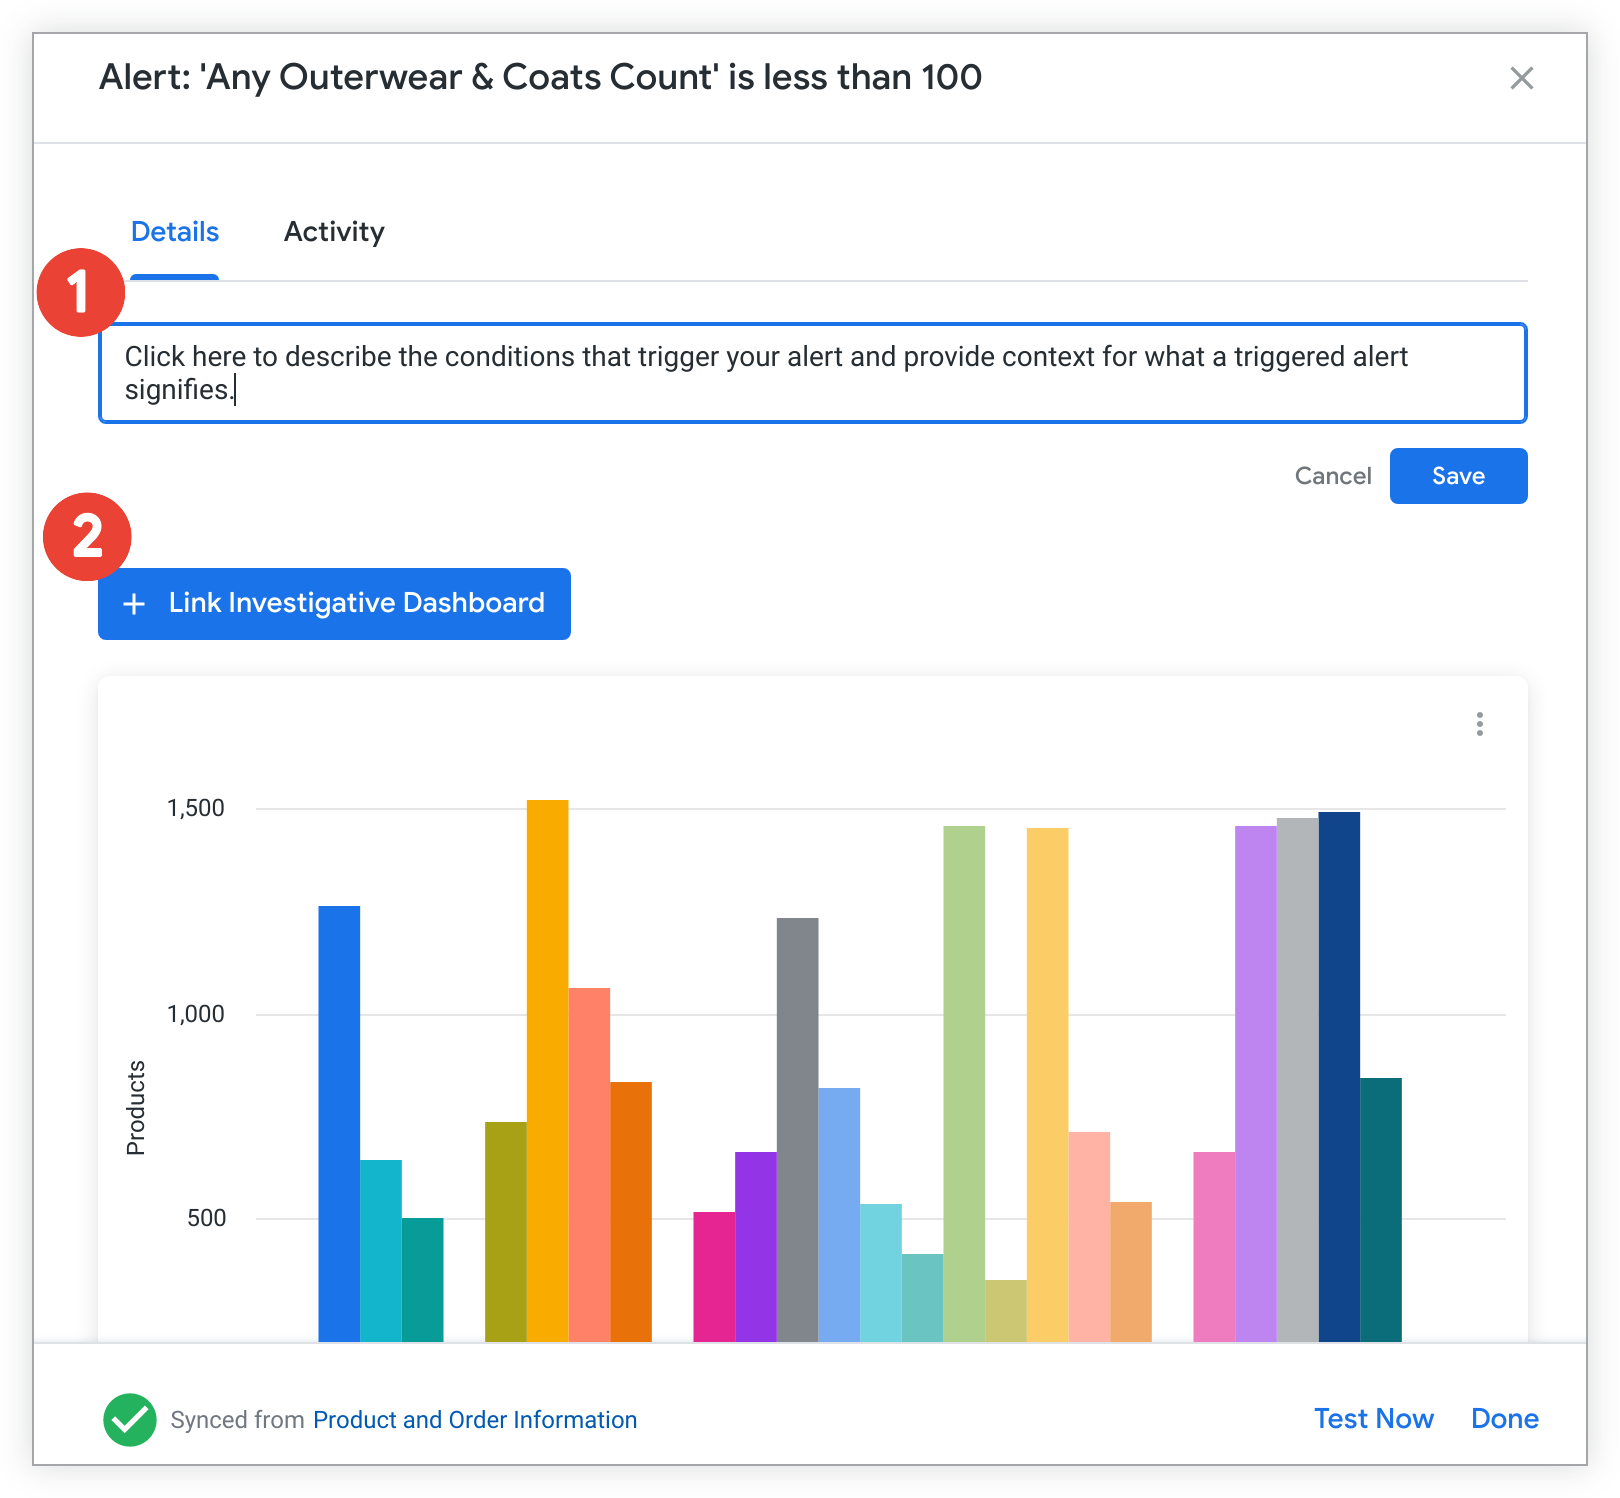
- Select inside the text box to add context about what conditions trigger your alert or what it means for an alert to be triggered. Select Save to save your description.
- Select the + Link Investigative Dashboard button to open a new window in which you can connect another dashboard to this alert.
In the Link Dashboard to Alert window, select the folder that contains the dashboard, and then select the name of the dashboard. The name of the linked dashboard will appear in place of the + Link Investigative Dashboard button. Select the button to navigate to the linked dashboard. You can delete the linked dashboard by clicking the x in the dashboard name — Looker will ask you to confirm that you want to delete the link to the dashboard.
Some alert details are displayed automatically on the Alert Details page and cannot be configured:
- Information about the alert's history (noted in the Activity tab of the page)
- The alert visualization
- The dashboard synchronization status and name of the dashboard with which the alert is associated
Other ways to interact with an alert you own include:
- Select the three-dot menu on the alert visualization, and then select Explore from here to open an Explore that is pre-set with the query for the dashboard tile on which the alert is set.
- Select the Test Now button to run an instant alert query — if the alert is triggered, a notification will be sent to its owner, recipients, and followers.
Select Done to close the Alert Details page.
Viewing the Alert Details page
You can view the Alert Details for an alert that you do not own if you're listed as a recipient for that alert or if you have chosen to follow the alert. Open the Details tab on the Alerts Detail page to view the information about an alert that its owner has configured:
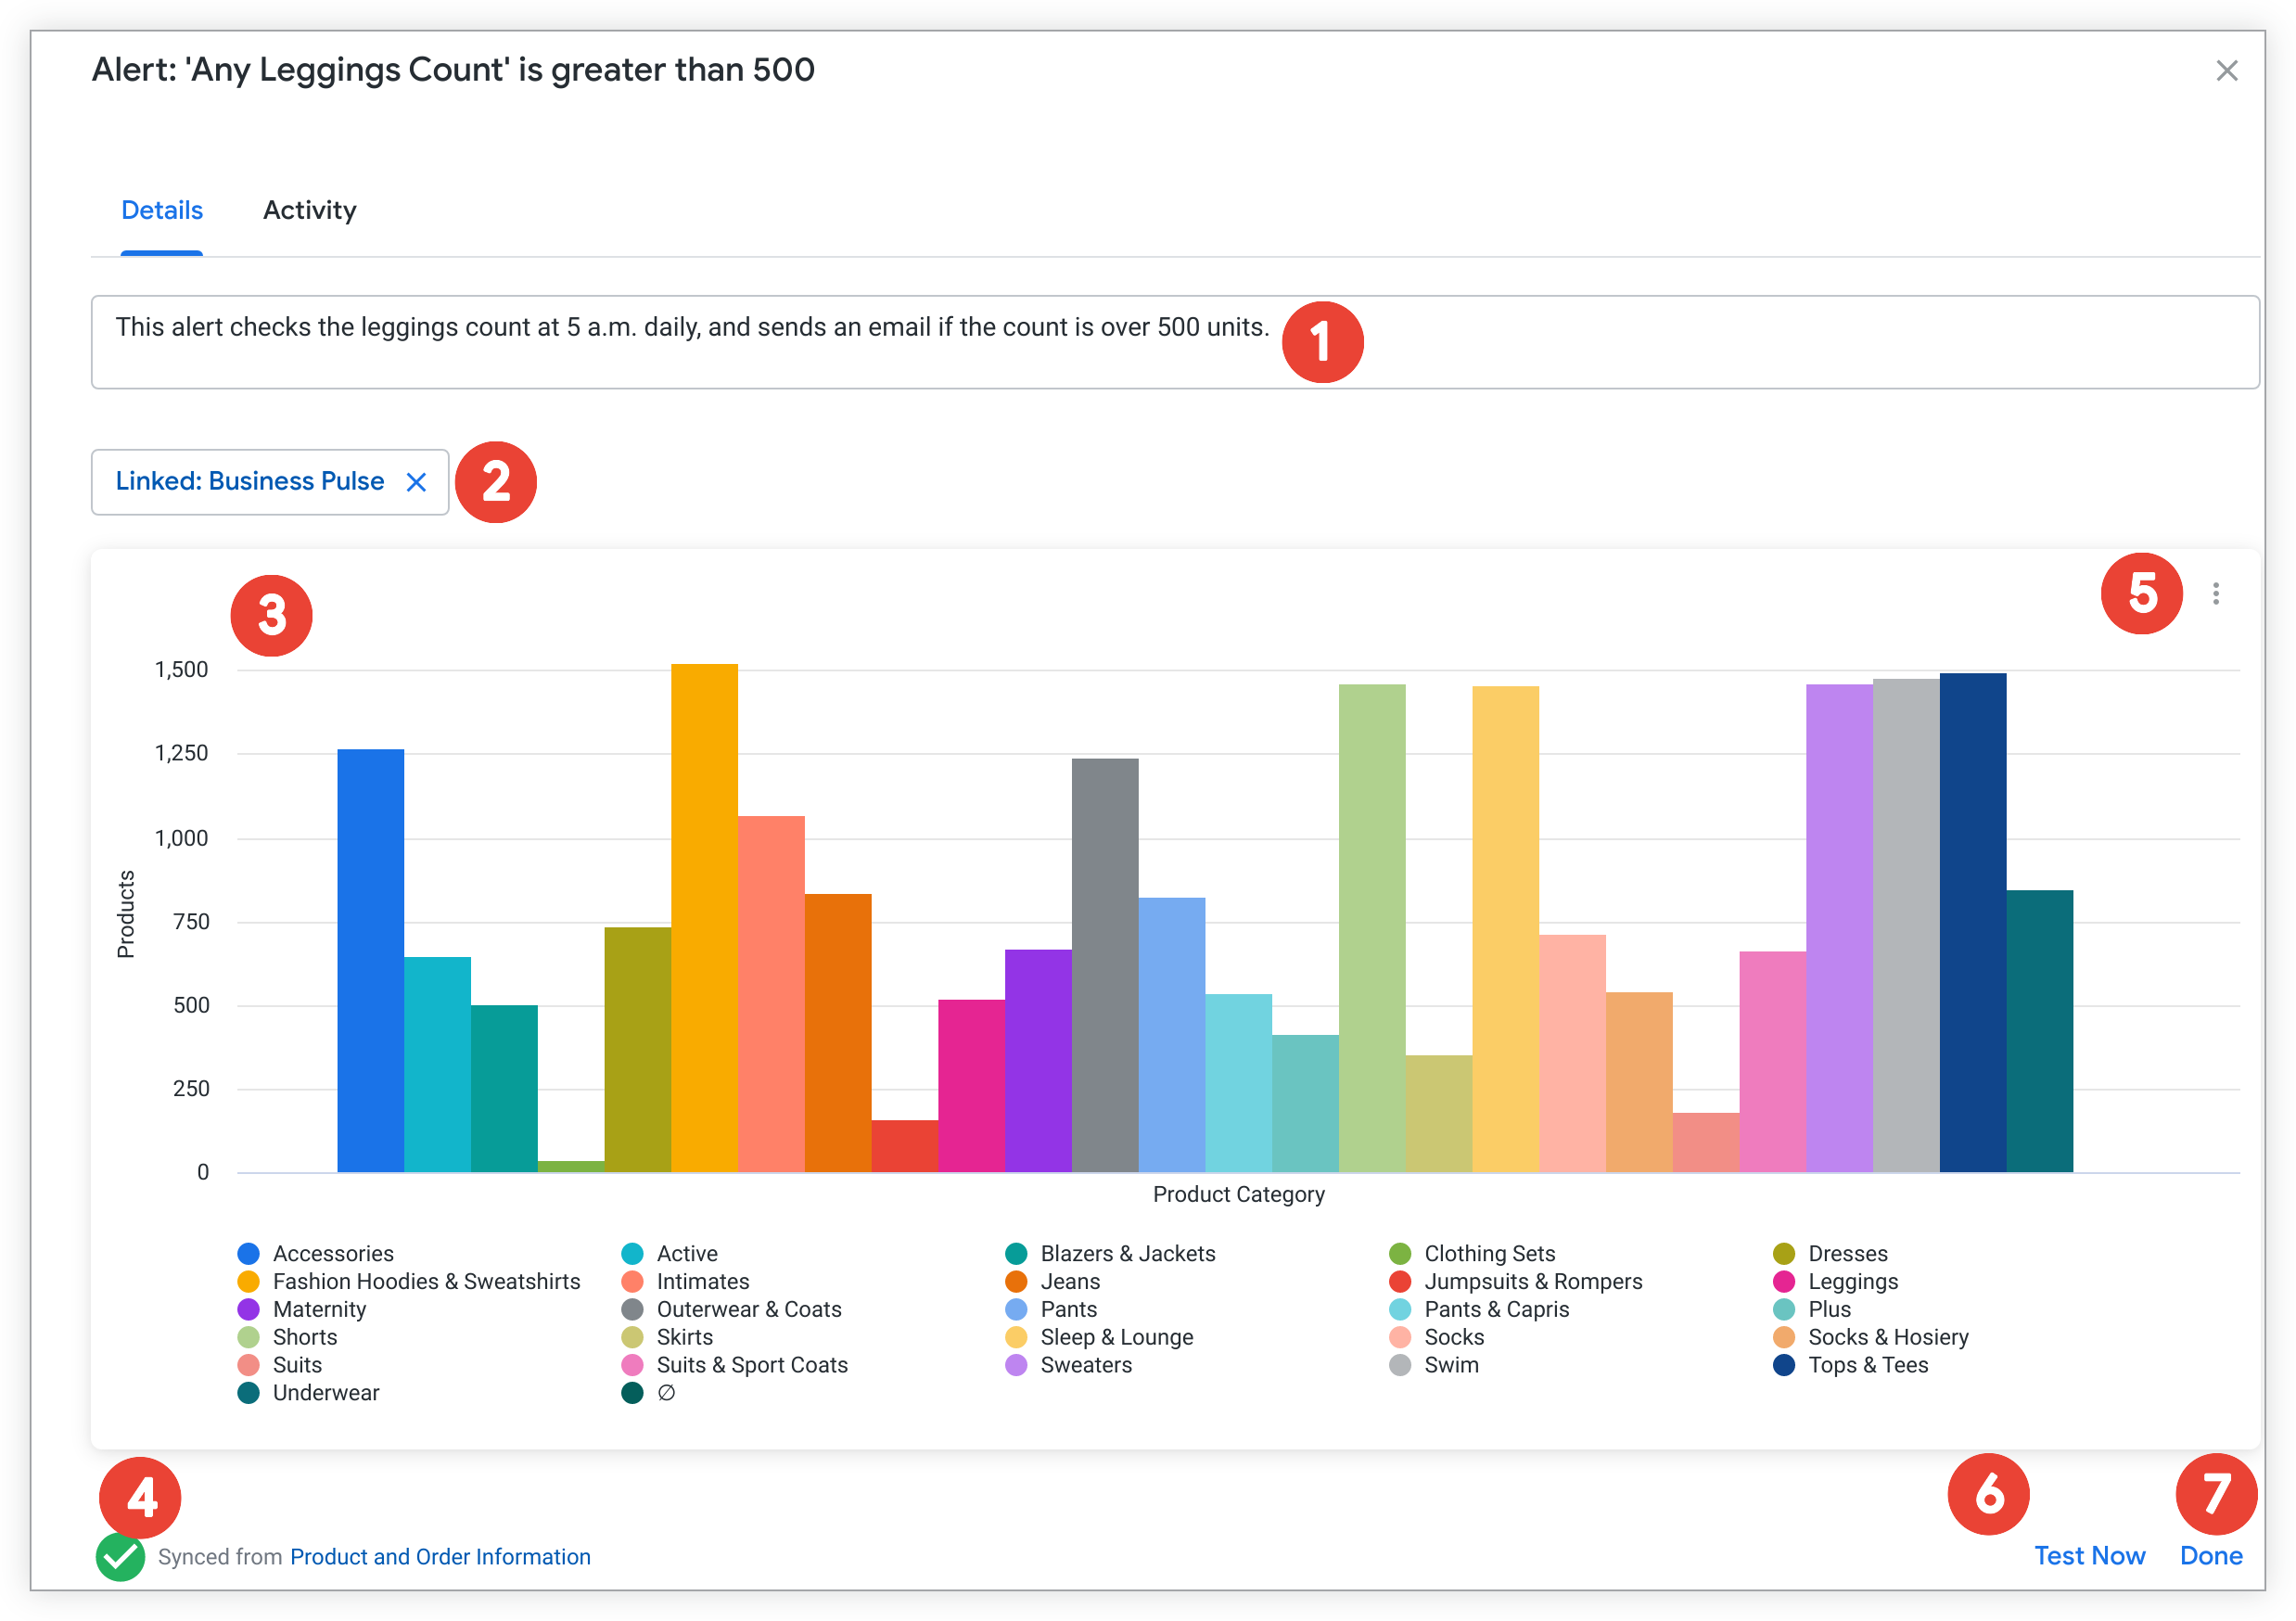
- View context about what conditions trigger your alert or what it means for an alert to be triggered.
- Select the linked dashboard to navigate to another dashboard that may add context to the alert query.
- View the alert visualization.
- View alert synchronization status.
- Select the three-dot menu on the alert visualization, and then select Explore from here to open an Explore that is pre-set with the query for the dashboard tile on which the alert is set.
- Select the Test Now button to run an instant alert query — if the alert is triggered, a notification will be sent to its owner, recipients, and followers.
- To close the Alert Details page, select Done.
Viewing alert activity
Looker runs an alert query at its specified frequency to check whether data has met or exceeded alert conditions. The results of these checks become the alert's history. You can select the Activity tab at the top of the Alert Details page to view the alert's history as well as additional information:
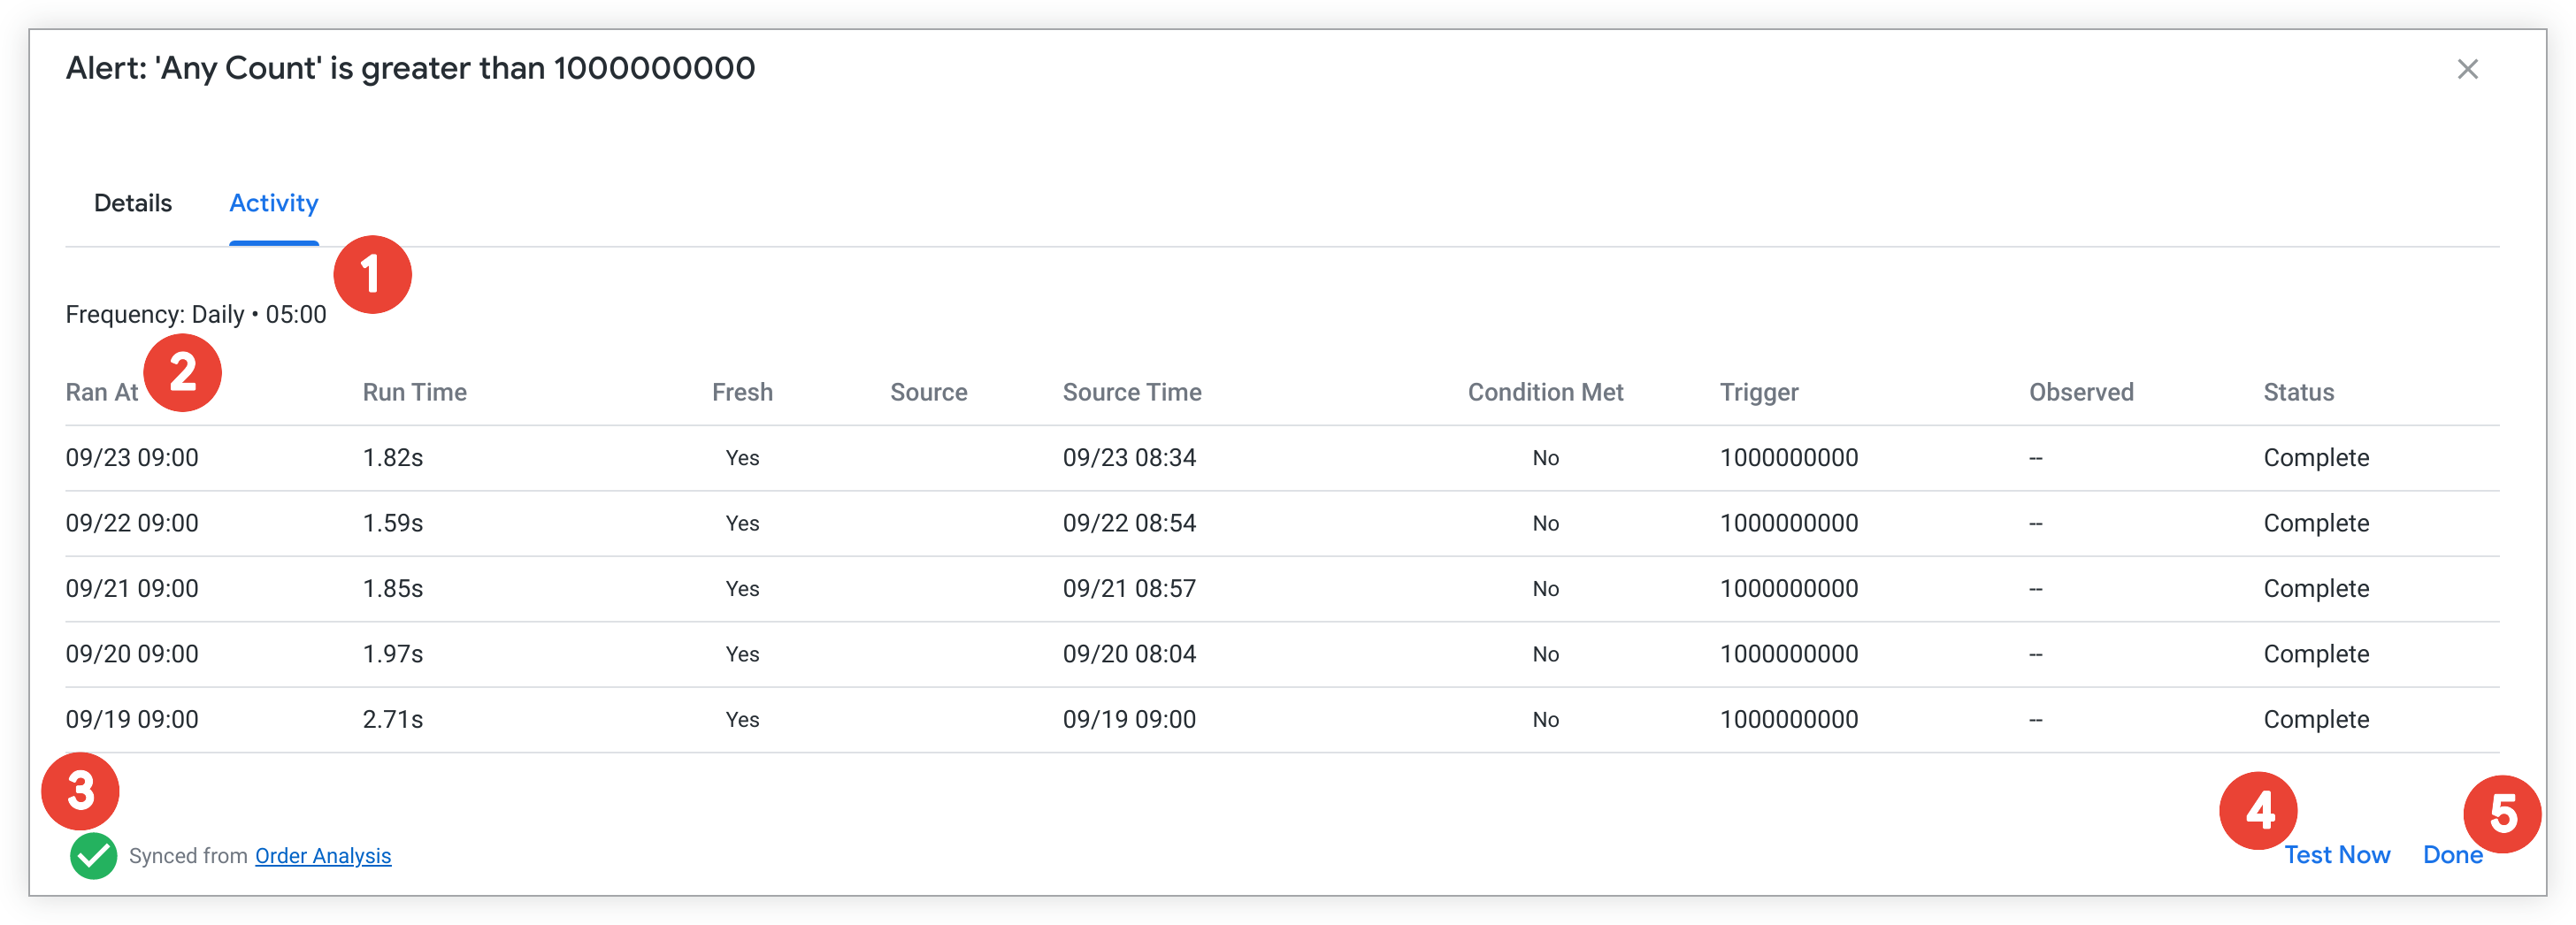
- View the frequency with which the alert is checked against its conditions.
- View alert metadata.
- View alert synchronization status.
- Select the Test Now button to run an instant alert query — if the alert is triggered, a notification will be sent to its owner, recipients, and followers.
- Select Done to close the Alert Details page.
Viewing alert metadata
The table on the Activity tab of the Alert Details page includes metadata about each alert run.
| Heading | Definition | Possible values |
|---|---|---|
| Ran At | The timestamp of when the alert query was initiated | Any timestamp in the format 6/25/2021, 10:45:21 AM
|
| Run Time | How long the alert query took to run | Any duration in the format 0.81s
|
| Fresh | A Boolean that indicates whether the alert query checked data that had changed between the two most recent alert queries. If the data changed; if the data did not change |
|
| Source | The origin of the data from which the alert query checked for the conditional value |
|
| Source Time | The timestamp of the database row from which the alert query checked for the conditional value | Any timestamp in the format 6/25/2021, 9:25:40 AM |
| Condition Met | A Boolean that indicates whether or not the alert conditions were met |
|
| Trigger | The conditional value that would trigger the alert if met or exceeded | Any numerical value |
| Observed | The observed value that met or exceeded the alert conditions and triggered the alert | Any numerical value |
| Status | The status of the alert query |
|
Viewing alert synchronization status
Both tabs on the Alert Details page show the alert's synchronization status and the name of the dashboard with which the alert is associated:
- A green encircled check mark indicates that the alert is still synced to its dashboard.
- A yellow triangular warning symbol indicates that the alert has become unsynced from its dashboard. The status includes a timestamp of when the synchronization was broken. An unsynced alert displays a None value in the Dashboard column. For information about resolving an unsynced alert, see the Effect of dashboard edits on alerts documentation page.