Dialogflow provides a web user interface called the Dialogflow CX Console (visit documentation, open console). You use this console to create, build, and test CX agents. The CX Console has a similar purpose as the ES Console, but the CX Console user interface is much more visual. It graphs each flow as a conversational state machine diagram, which makes complex agents easier to design and understand.
The Dialogflow CX Console is different from the Google Cloud Platform (GCP) Console (visit documentation, open console). The Dialogflow CX Console is used to manage Dialogflow CX agents, while the GCP Console is used to manage GCP-specific Dialogflow CX settings (for example, billing) and other GCP resources.
In most cases you should use the Dialogflow CX Console to build agents, but you can also use the Dialogflow CX API to build agents for advanced scenarios.
Quickstart, concept, and how-to guides take you through the steps of using the console. This guide provides a high-level summary of the console.
How the console is used
The console is used to create, build, manage, fine-tune, and test your projects and agents. With it, you can:
- Create projects.
- Create agents that contain all settings and data that define the conversational experience.
- Create flows and pages that are the building blocks for conversation control.
- Create entities to extract useful data from end-user input.
- Create intents that categorize end-user input.
- Test your agent via the simulator.
- And more ...
Project selector
When you initially load the console, you must select a project. The project selector interface is used to:
- Select pre-existing projects
- Create new projects

Agent selector
Once you select a project, you must select an agent. The agent selector interface is used to:
- Select existing agents
- Create new agents
- Create prebuilt agents
- Export and restore agents
- Delete agents
- Configure location settings
- Filter agents by location

Agent builder
Once a project and agent has been selected, the agent builder loads. The builder is arranged in the following panels:
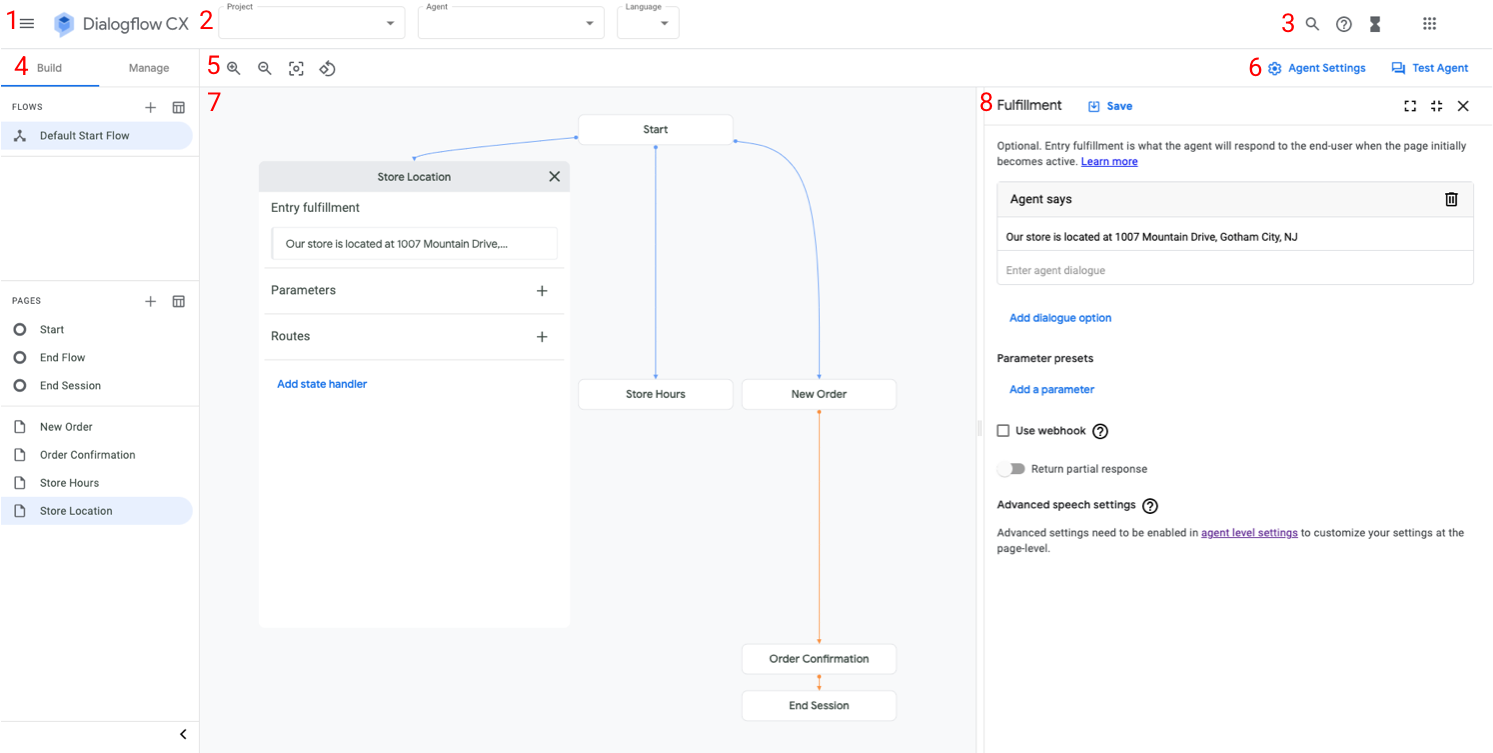
Console menu (1)
You can use this menu to switch between Dialogflow consoles.
Project and agent selection (2)
You can use these menus to change the project, agent, or currently active language for multilingual agents.
Search bar and task indicator (3)
Use the search bar search to search, filter, and access the core resources within the agent. The task indicator hourglass_full shows the status of tasks like training.
Build and Manage tabs (4)
The Build tab contains sections for managing flows and pages. When you select a flow in the flow section, the pages contained within the flow are listed in the pages section.
The Manage tab contains resources and tools available to the agent: intents, entity types, webhooks, etc.
Graph settings (5)
These buttons provide various controls for viewing and interacting with the agent graph.
Agent settings and simulator buttons (6)
The settings Agent Settings button opens the agent settings panel. The forum Test Agent button opens the simulator panel.
Graph (7)
The graph shows a visual representation of the selected flow, similar to a state machine diagram. Each node of the graph represents a page or flow start page. You can click a node to expand or contract it. When expanded, you can edit a nodes data.
The first node of the graph, called Start, is the start page of the flow.
Connecting lines from one node to another represent possible transitions. They are color-coded in the following way:
- Blue represents transitions defined for intent requirements or for intent and condition requirements.
- Orange represents transitions defined for condition requirements only.
- Cyan represents transitions defined for event handlers.
- Grey represents transitions other than described above (for example, a mixture of the above mentioned transition types).
When a transition can lead to another flow, the target flow is shown as a node.
Editing and simulator panels (8)
When editing agent content or testing the agent with the simulator, content-specific panels open on the right side of the console. These panels can be expanded to fill available console area, contracted to fill a portion of the right side of the console, or closed when you are finished.
Simulator
The simulator is used to test your agent. You can have a conversation with your agent while monitoring changes in session state.
You can also use the simulator to create executable test cases.
Simulator settings
When you first open the simulator, you need to select an agent environment or flow versions and an active flow. In most cases, you should use the draft environment and default start flow.
From buttons above the simulator, you can also:
- Enable or disable webhook calls at any time with the webhook toggle button.
- Enable or disable partial responses.
- Enable or disable sentiment analysis.
Simulator input
When interacting with the simulator, you provide end-user input as text, then press enter or click the send button. In addition to plain text, you can choose alternate input types with the input selector:
- Parameter: Inject a parameter value. You can provide new parameters or provide preset values for existing parameters.
- Event: Invoke an event.
- DTMF: Send dual-tone multi-frequency signaling (Touch-Tone) input for telephony interactions.
Simulator session state
When using the simulator to have a conversation with your agent, session state is shown to the left of the conversation. The currently active flow, currently active page, populated parameter values, and execution steps are shown. This information may help you debug an agent or verify its behavior in certain conversation scenarios.
Simulator limitations
For the simulator, the following limitations apply:
- You cannot set a parameter value to null.
- Conversations created using simulator are inaccessible using API methods.