This document describes the common causes of unexpected shutdowns and reboots of virtual machine (VM) instances and how to prevent them.
VM shutdowns and reboots can be caused by system events or admin activities. System event shutdowns and reboots are generated by Google systems or your VM's operating system. Admin activity shutdowns and reboots are generated by a user- or service account-generated API call. All shutdowns and reboots are logged, except for reboots that are initiated from within the VM.
Before you begin
-
If you haven't already, set up authentication.
Authentication is
the process by which your identity is verified for access to Google Cloud services and APIs.
To run code or samples from a local development environment, you can authenticate to
Compute Engine as follows.
Select the tab for how you plan to use the samples on this page:
Console
When you use the Google Cloud console to access Google Cloud services and APIs, you don't need to set up authentication.
gcloud
-
Install the Google Cloud CLI, then initialize it by running the following command:
gcloud init
- Set a default region and zone.
-
Diagnosing VM shutdowns and reboots
To diagnose the cause of a VM's spontaneous shutdown or reboot, you must query
your VM's logs. To quickly identify the cause of future VM shutdowns or reboots,
build a dashboard that contains the logs. After you query the logs, review the
method and principalEmail fields to determine what event and which user or
service initiated the shutdown or reboot.
Querying Cloud Audit Logs
Query Cloud Audit Logs to display a list of system events and admin activities that might have caused the shutdown or reboot.
Console
In the Google Cloud console, go to the Logs Explorer page.
In the Query field, enter the following query:
resource.type="gce_instance"
"VM_NAME"
logName:("logs/cloudaudit.googleapis.com%2Fsystem_event" OR "logs/cloudaudit.googleapis.com%2Factivity")
Replace
VM_NAMEwith the name of the VM that shut down or rebooted.If the event you're looking for happened more than an hour ago, set a custom time frame by clicking the clock symbol and entering a custom range.

Click Run query. The results are displayed in the Query results section.
Click the expander arrow next to each result to show detailed information.
See Reviewing Cloud Audit Logs to learn more about the
methodandprincipalEmailfields that are associated with shutdowns and reboots, and what you can do to prevent them.
gcloud
View Cloud Audit Logs using the
gcloud logging readcommand:gcloud logging read --freshness=TIME 'resource.type="gce_instance" "VM_NAME" logName:("logs/cloudaudit.googleapis.com%2Fsystem_event" OR "logs/cloudaudit.googleapis.com%2Factivity")'Replace the following:
TIME: the amount of time you want to query. For example,1hqueries log entries in the past hour. For information about date and time formats, see gcloud topic datetimes.VM_NAME: the name of the VM that shutdown or rebooted.
The results display.
See Reviewing Cloud Audit Logs to learn more about the
methodandprincipalEmailfields that are associated with shutdowns and reboots, and what you can do to prevent them.
Reviewing Cloud Audit Logs
Review the method and principalEmail fields of the Cloud Audit Logs to
determine why your VM was shut down or rebooted.
Review the
methodfields of the Cloud Audit Logs and compare them with the methods listed in the following table.Method Shutdown type Description compute.instances.repair.recreateInstanceSystem event If your VM belongs to a managed instance group (MIG), the MIG recreates the VM if the VM's state changes from
RUNNINGand the MIG did not initiate the change in state.Changes of instance state that are not initiated by the MIG include:
- Hardware failures.
- Terminating a preemptible instance.
- Infrastructure maintenance events when the VM instance is not set to live migrate.
- Deleting a MIG instance by using one of the following methods:
- The
instances.deleteAPI method - The
gcloud compute instances deletecommand
- The
compute.instances.hostErrorSystem event A host error (
compute.instances.hostError) means that there was a hardware or software issue on the physical machine hosting your VM that caused your VM to crash. A host error which involves total hardware failure or other hardware issues might prevent live migration of your VM. If your VM is set to automatically restart, which is the default setting, Google restarts your VM, typically within three minutes from the time the error was detected. Depending on the issue, the restart might take up to 5.5 minutes.VMs with local SSD disks
If a host error occurs on a VM that has one or more Local SSD disks attached, Compute Engine makes a best effort to reconnect to the VM and preserve the Local SSD data. While Compute Engine is recovering your VM and Local SSD disk, the host system and the underlying disk are unresponsive.
You can specify how much time Compute Engine spends trying to recover Local SSD data by setting the Local SSD recovery timeout.
For more information about how Local SSD disks behave when a host error occurs, see Local SSD data persistence.
Unresponsive VMs
Occasionally, a VM might become unresponsive before a host error is detected. You can reduce the time Compute Engine waits to restart or terminate the VM by setting the host error recovery timeout (Preview). For more information, see Set availability policies.
Physical hardware and software failures can happen occasionally but are rare occurrences. To protect your applications and services from these potentially disruptive system events, review the following resources:
Google also offers managed services such as App Engine and the App Engine flexible environment.
compute.instances.automaticRestartSystem event This event occurs after a
hostErrorevent or aterminateOnHostMaintenanceevent if your VM'sautomaticRestarthost maintenance policy is set totrue. In the logs, ahostErroror aterminateOnHostMaintenancelog entry precedes this log.If you want to change your VM's host maintenance policy, see Updating options for an instance.
compute.instances.guestTerminateSystem event Your VM's operating system initiated the shutdown. compute.instances.terminateOnHostMaintenanceSystem event If you set your VM's
onHostMaintenancehost maintenance policy toTERMINATE, Compute Engine stops your VM when there is a maintenance event where Google must move your VM to another host.If you want to change your VM's
onHostMaintenancepolicy, see Updating options for an instance.compute.instances.preemptedSystem event Compute Engine preempted your Spot VM or legacy preemptible VM:
- When Compute Engine preempts a Spot VM, Compute Engine either stops or deletes the Spot VM based on its termination action. Spot VMs do not have a maximum runtime.
- When Compute Engine preempts a preemptible VM, Compute Engine stops the VM after a maximum runtime of 24 hours. To avoid these limitations, use Spot VMs instead.
Spot VMs and preemptible VMs are excess Compute Engine capacity, so Compute Engine might preempt them any time that capacity is needed elsewhere. You can help mitigate the effects of preemption by following the best practices. Alternatively, if you require VMs with user-controlled runtimes, create standard VMs instead.
compute.instances.stopAdmin activity A user or service account stopped your VM.
Continue to the next step to identify the user or service account that stopped your VM. For information about restarting your VM, see Restarting a stopped instance.
compute.instances.deleteAdmin activity A user or service account deleted your VM.
Continue to the next step to identify the user or service account that deleted your VM. For information about creating a new VM, see Creating and starting a VM.
compute.instances.insertAdmin activity A user or service account created your VM.
Continue to the next step to identify the user or service account that created your VM. For information about creating a new VM, see Creating and starting a VM.
compute.instances.resetAdmin activity A user or service account reset your VM.
Continue to the next step to identify the user or service account that stopped your VM.
Review the
principalEmailfields of the Cloud Audit Logs to identify the user or service that initiated the shutdown or reboot. The following table include common Google managed services that initiate shutdowns or reboots.Email Description system@google.comA system event caused the shutdown or reboot. project-number@cloudservices.gserviceaccount.comA Google-managed service account initiated the shutdown.
To determine which project the service initiated the shutdown from, review the service account's
project-number.To determine which Google service made the request, review the
protoPayload.requestMetadata.callerSuppliedUserAgentfield.If a user triggered the shutdown or reboot, their email address appears in the
principalEmailfield. For example,cloudysanfrancisco@gmail.com.Administrators can prevent users from changing the state of project VMs by changing Identity and Access Management permissions on user accounts. For more information, see Granting, changing, and revoking access to resources.
Monitor VM lifecycle events
You can monitor VM lifecycle events (including shutdowns, reboots, and host errors) by building a Cloud Monitoring dashboard.
This dashboard enables you to visualize system events and admin activities that are described in further detail in the Reviewing Audit Logs section of this document.
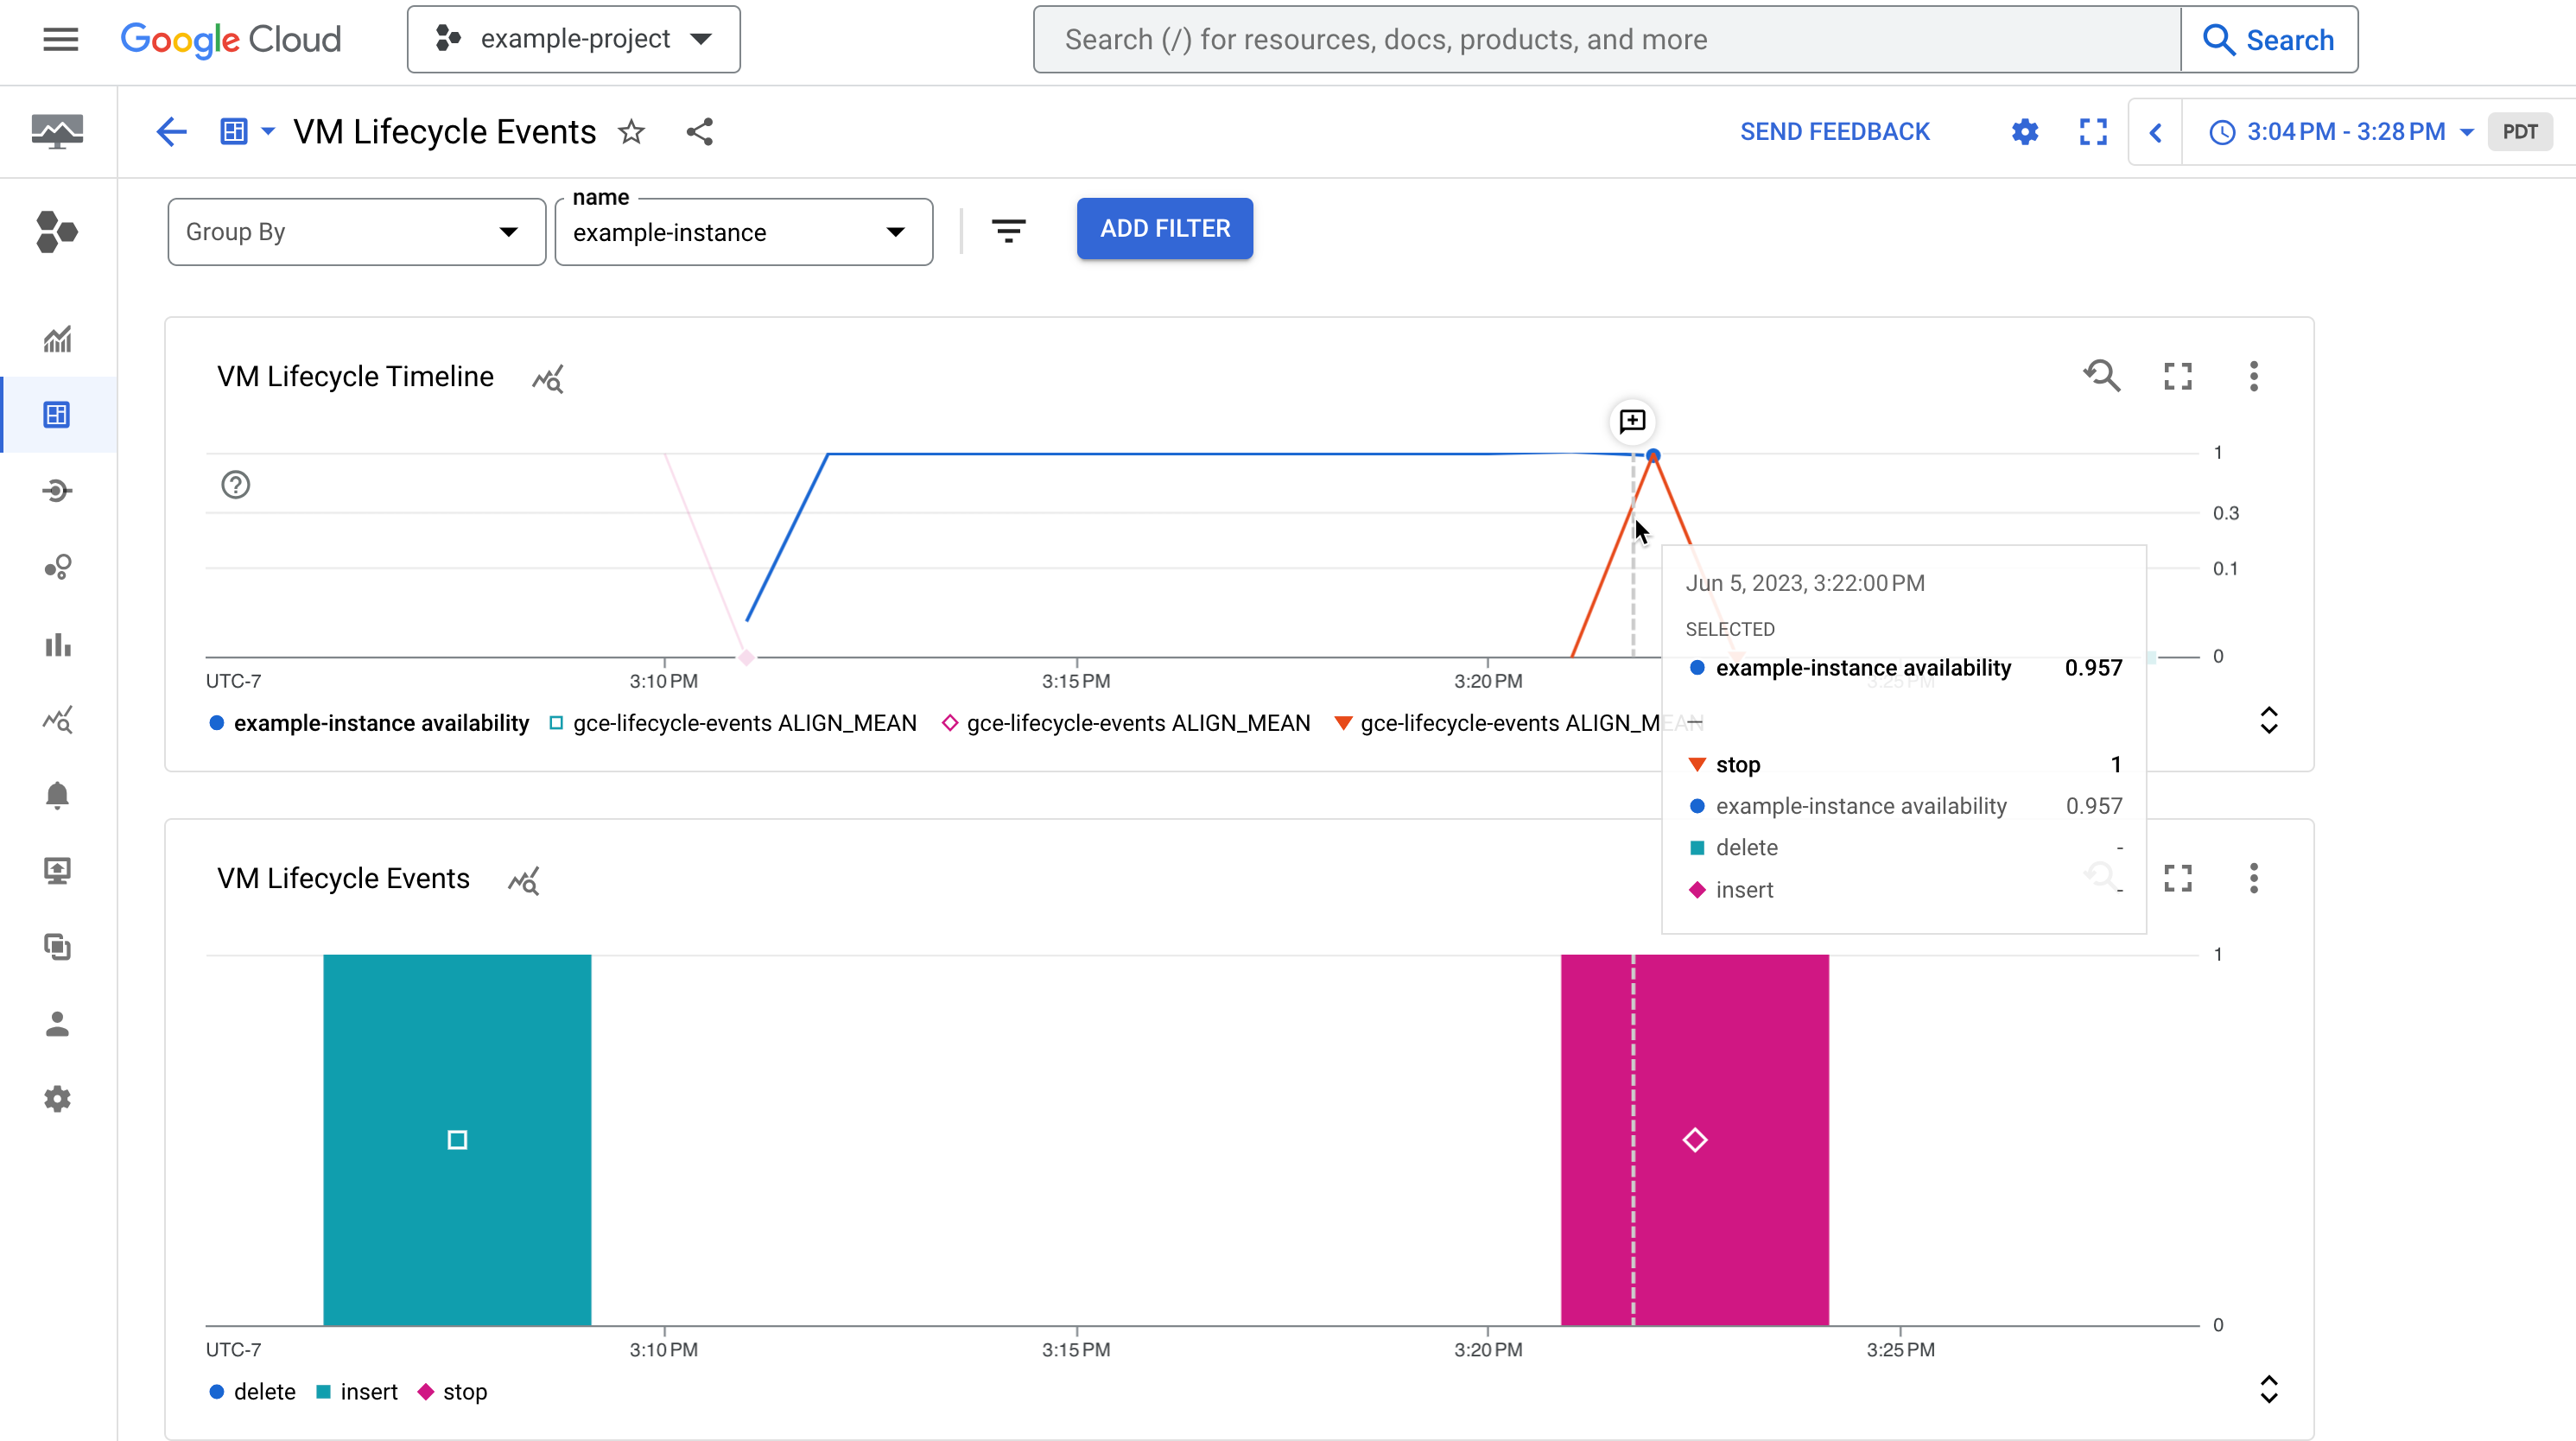 Figure 1. An example dashboard showing the availability of an instance and its lifecycle events such as a stopped instance.
Create log-based metric
To capture VM lifecycle events, create a user-defined log-based metric. This metric uses Audit Logs to keep count of the number of times a particular VM lifecycle event has occurred.
To get the permissions that you need to create the metric,
ask your administrator to grant you the
Logs Writer (roles/logging.logWriter) IAM role on the project.
For more information about granting roles, see Manage access.
You might also be able to get the required permissions through custom roles or other predefined roles.
Create a user-defined log-based metric by doing the following:
In the Google Cloud console, go to the Log-based Metrics page.
Click on Create Metric.
In the Metric Type section, do the following:
- Select
Counter. - Leave Distribution at the default setting of unselected.
In the Details section, enter the following information:
- Log-based metric name:
vm-lifecycle-events. You must use this exact name for the dashboard to work correctly. - Description: Optional — Enter a description for this metric.
- Units:
1
In the Filter selection section, specify the following:
- From the Select log scope drop-down-menu, select: Project logs
- In the Build filter enter:
resource.type = "gce_instance" AND
log_id("cloudaudit.googleapis.com/activity") OR
log_id("cloudaudit.googleapis.com/system_event")
operation.first="true"
In the Labels section, click Add label.
Specify the following:
- Label name:
method - Label type:
STRING - Field name:
protoPayload.methodName - Regular expression:
(recreateInstance|hostError|automaticRestart|guestTerminate|terminateOnHostMaintenance|preempted|insert|stop|delete|reset|start)
- Label name:
Click Done
Click Create metric.
Use the dashboard
No data appears on the dashboard until a VM experiences a system event or an admin activity. To test that the dashboard works, perform an admin activity, such as a stop and start operation:
- Perform a
stopandstartoperation on any existing VM, or create a new VM for testing purposes.
To get the permissions that you need to use the dashboard,
ask your administrator to grant you the
Monitoring Dashboard Viewer (roles/monitoring.dashboardViewer) IAM role on the project.
For more information about granting roles, see Manage access.
You might also be able to get the required permissions through custom roles or other predefined roles.
Open Dashboards in the Google Cloud console.
From the Dashboard List tab open the
GCE VM Lifecycle Events Monitoringdashboard.Select the VM from the Name drop-down menu.
Narrow the time series to a relevant timeframe.
For more ways to filter the dashboard see Add a temporary filter.
The dashboard contains two charts that display a timeline of system events and admin activities that occur on a VM:
The VM Lifecycle Timeline chart displays the following:
- The
compute.googleapis.com/instance/uptimemetric that indicates whether the VM was running at a given point in time, where 1 is up and 0 is down. Note this metric reflects availability as a result of user activity and system events, and is not an indication of Compute Engine SLA. - The
vm-lifecycle-eventslog-based metric to count the number of lifecycle actions, such asstoporstartthat performed were performed against the VM at a given point in time
- The
The Events chart shows the same
vm-lifecycle-eventslog-based metric but in a magnified view for easier readability. Note that although the X-axes are aligned, the colors are not synchronized between the two charts.
Investigating mass VM shutdown across projects
Compute Engine might shut down multiple VMs that are connected to a Shared VPC host project, if the Shared VPC host project's billing is inactive or disabled.
To determine if your VMs have been shut down by a mass shutdown request, look
for stop operations initiated by cloud-cluster-manager@prod.google.com.
Starting an affected instance returns an error similar to the following:
Starting instance(s) INSTANCE_NAME...failed.
ERROR: (gcloud.compute.instances.start) The default network interface [nic0] is frozen.
To resolve this issue, do the following:
Identify the Shared VPC used by the VMs, by using the
gcloud compute instances describecommand:gcloud compute instances describe VM_NAME \ --format="flattened(networkInterfaces[].network)"
The output is similar to the following:
networkInterfaces[0].network: https://www.googleapis.com/compute/v1/projects/SHARED_VPC_PROJECT/global/networks/FROZEN_NETWORK
Verify in the Shared VPC's host project if billing has been disabled.
resource.type="project"
protoPayload.request.@type="type.googleapis.com/google.internal.cloudbilling.billingaccount.v1.DisableResourceBillingRequest"
protoPayload.response.resourceBillingInfo.billingAccountAssignmentType="DISABLED"
If applicable, Enable billing on the host project.
To help prevent this issue from reoccurring, read Secure the link between a project and its billing account.