Cloud Composer 1 | Cloud Composer 2
This page provides troubleshooting steps and information for common issues with Airflow schedulers.
Identify the source of the issue
To begin troubleshooting, identify if the issue happens at DAG parse time or while processing tasks at execution time. For more information about parse time and execution time, read Difference between DAG parse time and DAG execution time.
Inspecting DAG Processor logs
If you have complex DAGs then the DAG Processor, which is run by the scheduler, might not parse all your DAGs. This might lead to many issues that have the following symptoms.
Symptoms:
If the DAG Processor encounters problems when parsing your DAGs, then it might lead to a combination of the issues listed below. If DAGs are generated dynamically, these issues might be more impactful compared to static DAGs.
DAGs are not visible in Airflow UI and DAG UI.
DAGs are not scheduled for execution.
There are errors in the DAG processor logs, for example:
dag-processor-manager [2023-04-21 21:10:44,510] {manager.py:1144} ERROR -
Processor for /home/airflow/gcs/dags/dag-example.py with PID 68311 started
at 2023-04-21T21:09:53.772793+00:00 has timed out, killing it.
or
dag-processor-manager [2023-04-26 06:18:34,860] {manager.py:948} ERROR -
Processor for /home/airflow/gcs/dags/dag-example.py exited with return
code 1.
Airflow schedulers experience issues which lead to scheduler restarts.
Airflow tasks that are scheduled for execution are cancelled and DAG runs for DAGs that failed to be parsed might be marked as
failed. For example:airflow-scheduler Failed to get task '<TaskInstance: dag-example.task1--1 manual__2023-04-17T10:02:03.137439+00:00 [removed]>' for dag 'dag-example'. Marking it as removed.
Solution:
Increase parameters related to DAG parsing:
Increase dagbag-import-timeout to at least 120 seconds (or more, if required).
Increase dag-file-processor-timeout to at least 180 seconds (or more, if required). This value must be higher than
dagbag-import-timeout.
Correct or remove DAGs that cause problems to the DAG processor.
Inspecting DAG parse times
To verify if the issue happens at DAG parse time, follow these steps.
Console
In Google Cloud console you can use the Monitoring page and the Logs tab to inspect DAG parse times.
Inspect DAG parse times with the Cloud Composer Monitoring page:
In Google Cloud console, go to the Environments page.
In the list of environments, click the name of your environment. The Monitoring page opens.
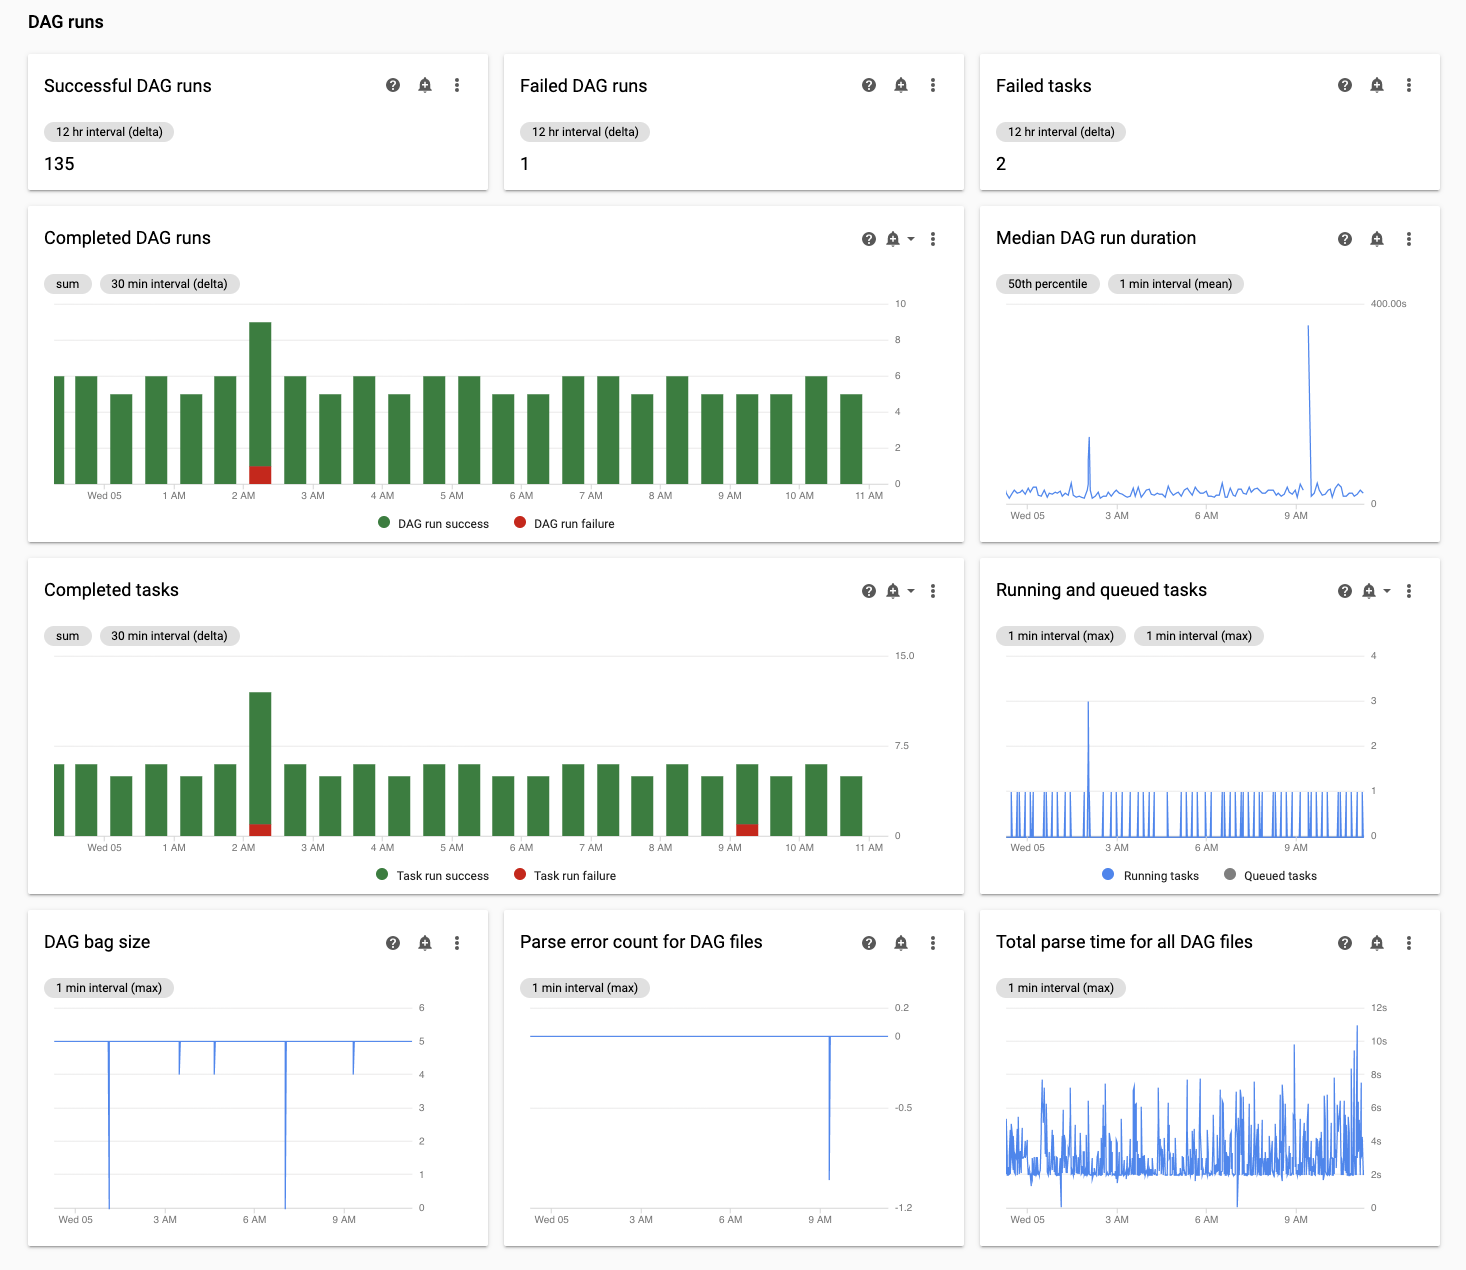
In the Monitoring tab, review the Total parse time for all DAG files chart in the DAG runs section and identify possible issues.
Inspect DAG parse times with the Cloud Composer Logs tab:
In Google Cloud console, go to the Environments page.
In the list of environments, click the name of your environment. The Monitoring page opens.
Go to the Logs tab, and from the All logs navigation tree select the DAG processor manager section.
Review
dag-processor-managerlogs and identify possible issues.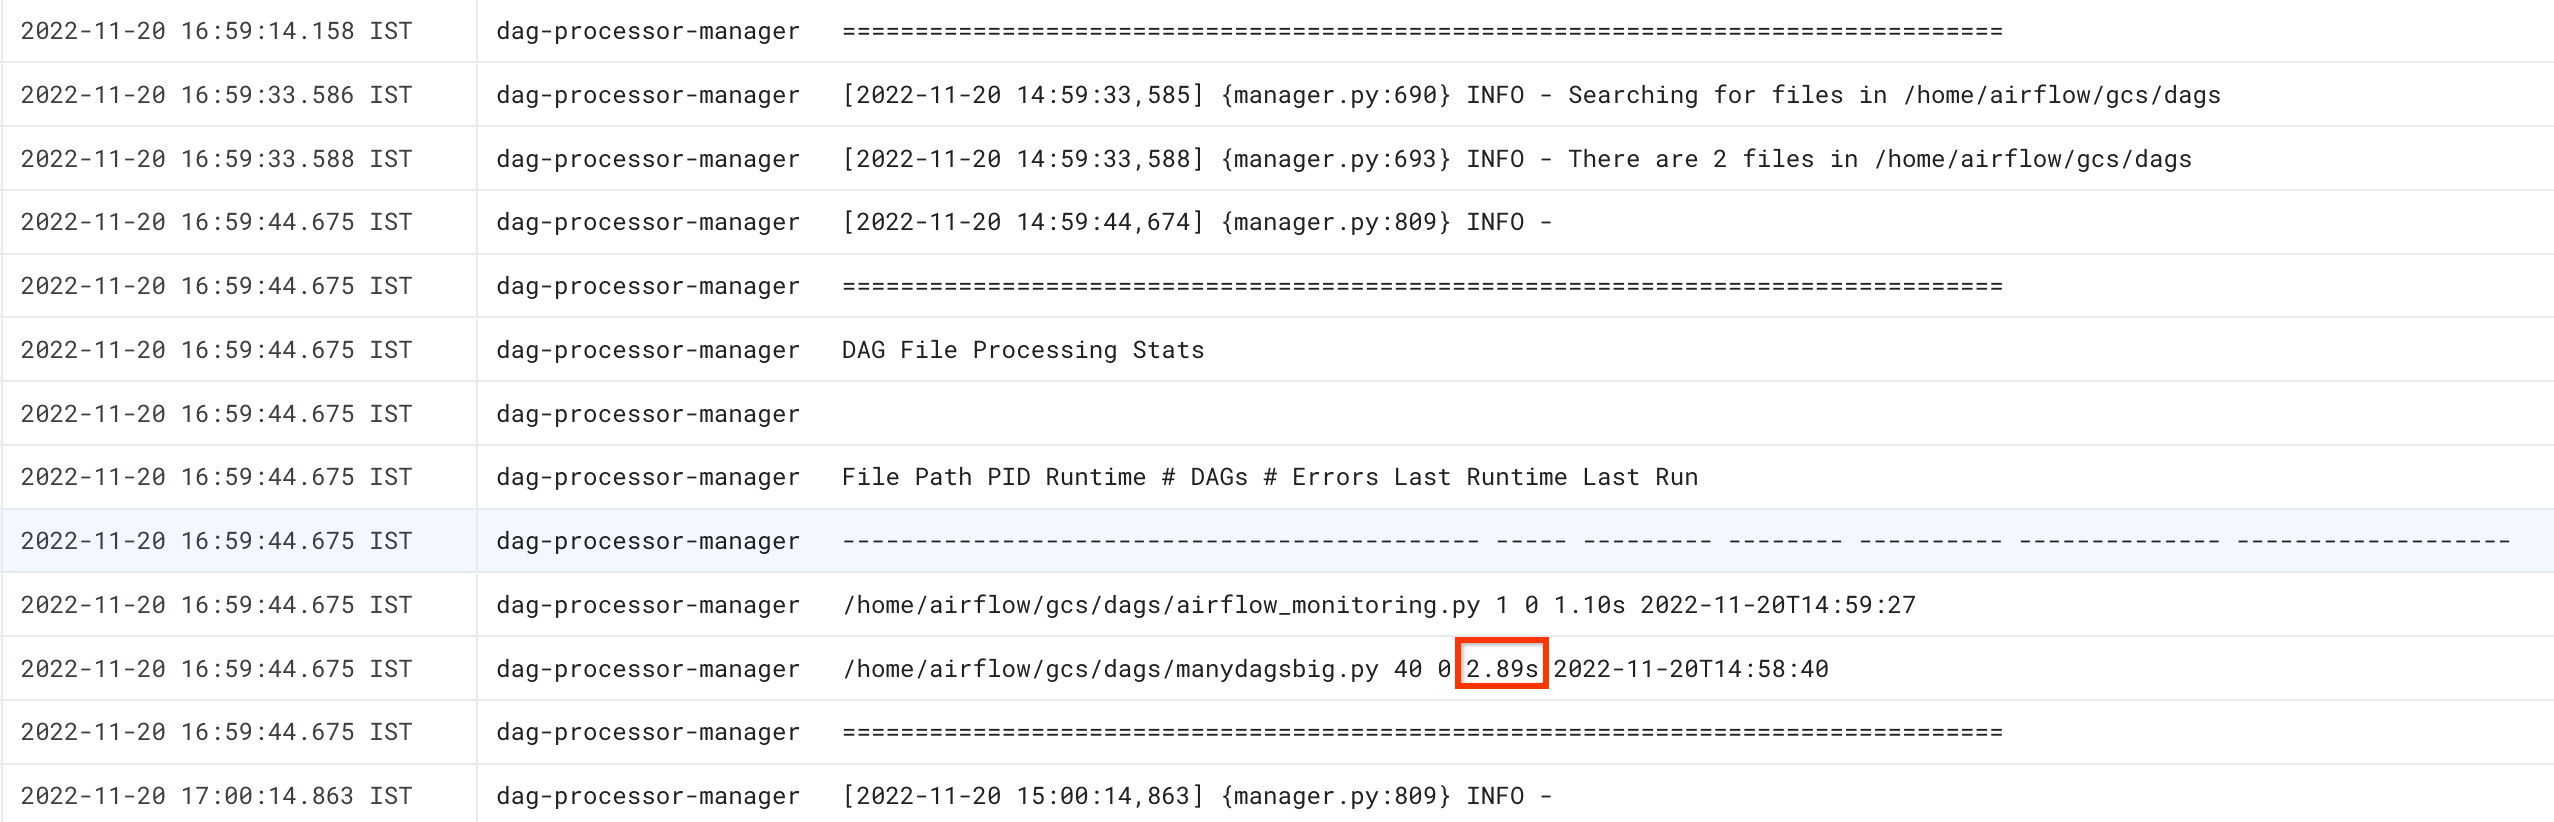
gcloud - Airflow 1
Use the list_dags command with the -r flag to see the parse time
for all your DAGs.
gcloud composer environments run ENVIRONMENT_NAME \
    --location LOCATION \
    list_dags -- -r
Replace:
ENVIRONMENT_NAMEwith the name of the environment.LOCATIONwith the region where the environment is located.
The output of the command looks similar to the following:
-------------------------------------------------------------------
DagBag loading stats for /home/airflow/gcs/dags
-------------------------------------------------------------------
Number of DAGs: 5
Total task number: 13
DagBag parsing time: 0.6765180000000001
-----------+----------+---------+----------+-----------------------
file       | duration | dag_num | task_num | dags
-----------+----------+---------+----------+-----------------------
/dag_1.py  | 0.6477   |       1 |        2 | ['dag_1']
/dag_2.py  | 0.018652 |       1 |        2 | ['dag_2']
/dag_3.py  | 0.004024 |       1 |        6 | ['dag_3']
/dag_4.py  | 0.003476 |       1 |        2 | ['dag_4']
/dag_5.py  | 0.002666 |       1 |        1 | ['dag_5']
-----------+----------+---------+----------+-----------------------
Look for the DagBag parsing time value. A large value might indicate that one of your DAGs is not implemented in an optimal way. From the output table, you can identify which DAGs have a long parsing time.
gcloud - Airflow 2
Use the dags report command to see the parse time for all your DAGs.
gcloud composer environments run ENVIRONMENT_NAME \
    --location LOCATION \
    dags report
Replace:
ENVIRONMENT_NAMEwith the name of the environment.LOCATIONwith the region where the environment is located.
The output of the command looks similar to the following:
Executing within the following Kubernetes cluster namespace: composer-2-0-31-airflow-2-3-3
file                  | duration       | dag_num | task_num | dags
======================+================+=========+==========+===================
/manydagsbig.py       | 0:00:00.038334 | 2       | 10       | serial-0,serial-0
/airflow_monitoring.py| 0:00:00.001620 | 1       | 1        | airflow_monitoring
Look for the duration value for each of the dags listed in the table. A large value might indicate that one of your DAGs is not implemented in an optimal way. From the output table, you can identify which DAGs have a long parsing time.
Monitoring running and queued tasks
To check if you have tasks stuck in a queue, follow these steps.
In Google Cloud console, go to the Environments page.
In the list of environments, click the name of your environment. The Environment details page opens.
Go to the Monitoring tab.
In the Monitoring tab, review the Airflow tasks chart in the DAG runs section and identify possible issues. Airflow tasks are tasks that are in a queued state in Airflow, they can go either to Celery or Kubernetes Executor broker queue. Celery queued tasks are task instances that are put into the Celery broker queue.
Troubleshooting issues at DAG parse time
The following sections describe symptoms and potential fixes for some common issues at DAG parse time.
DAG parsing and scheduling in Cloud Composer 1 and Airflow 1
DAG parsing efficiency was significantly improved in Airflow 2. If you experience performance issues related to DAG parsing and scheduling, consider migrating to Airflow 2.
In Cloud Composer 1, the scheduler runs on cluster nodes together with other Cloud Composer components. Because of this, the load of individual cluster nodes might be higher or lower compared to other nodes. The scheduler's performance (DAG parsing and scheduling) might vary depending on the node where the scheduler runs. In addition to that, an individual node where the scheduler runs can change as a result of upgrade or maintenance operations. This limitation was resolved in Cloud Composer 2 where you can allocate CPU and memory resources to the scheduler and the scheduler's performance does not depend on the load of cluster nodes.
Limited number of threads
Allowing the DAG processor manager (the part of the scheduler that processes DAG files) to use only a limited number of threads might impact your DAG parse time.
To solve the issue, override the following Airflow configuration options:
For Airflow 1.10.12 and earlier versions, override the
max_threadsparameter:Section Key Value Notes schedulermax_threadsNUMBER_OF_CORES_IN_MACHINE - 1Replace NUMBER_OF_CORES_IN_MACHINEwith the number of cores
in the worker nodes machines.For Airflow 1.10.14 and later versions, override the
parsing_processesparameter:Section Key Value Notes schedulerparsing_processesNUMBER_OF_CORES_IN_MACHINE - 1Replace NUMBER_OF_CORES_IN_MACHINEwith the number of cores
in the worker nodes machines.
Number and time distribution of tasks
Airflow is known for having problems with scheduling a large number of small tasks. In such situations, you should opt for a smaller number of more consolidated tasks.
Scheduling a large number of DAGs or tasks at the same time might also be a possible source of issues. To avoid this problem, distribute your tasks more evenly over time.
Troubleshooting issues with running and queued tasks
The following sections describe symptoms and potential fixes for some common issues with running and queued tasks.
Task queues are too long
In some cases, a task queue might be too long for the scheduler. For information about how to optimize worker and celery parameters, read about scaling your Cloud Composer environment together with your business.
Using TimeTable feature of Airflow scheduler
Starting with Airflow 2.2, you can define a time table for a DAG using a new feature called TimeTable.
You can define a time table using one of the following methods:
Limited cluster resources
This section applies only to Cloud Composer 1.
You might experience performance issues if the GKE cluster of your environment is too small to handle all your DAGs and tasks. In this case, try one of the following solutions:
- Create a new environment with a machine type that provides more performance and migrate your DAGs to it.
- Create more Cloud Composer environments and split the DAGs between them.
- Change the machine type for GKE nodes, as described in Upgrading the machine type for GKE nodes. Since this procedure is error-prone, it is the least recommended option.
- Upgrade the machine type of the Cloud SQL instance that runs the Airflow
database in your environment, for example using the
gcloud composer environments updatecommands. Low performance of the Airflow database might be the reason why the scheduler is slow.
Avoid task scheduling during maintenance windows
You can define specific maintenance windows for your environment. During these time periods, maintenance events for Cloud SQL and GKE take place.
Make the Airflow scheduler ignore unnecessary files
You can improve performance of the Airflow scheduler by skipping unnecessary
files in the DAGs folder. Airflow scheduler ignores files and folders
specified in the .airflowignore file.
To make the Airflow scheduler ignore unnecessary files:
- Create an
.airflowignorefile. - In this file, list files and folders that should be ignored.
- Upload this file to the
/dagsfolder in your environment's bucket.
For more information about the .airflowignore file format, see
Airflow documentation.
Airflow scheduler processes paused DAGs
Airflow users pause DAGs to avoid their execution. This saves Airflow workers processing cycles.
Airflow scheduler will continue parsing paused DAGs. If you really want to
improve Airflow scheduler performance, use .airflowignore or delete paused
DAGs from DAGs folder.
Usage of 'wait_for_downstream' in your DAGs
If you set the wait_for_downstream parameter to True in your DAGs, then
for a task to succeed, all tasks that are immediately downstream of this
task must also succeed. It means that execution of tasks belonging to a
certain DAG run might be slowed down by execution of tasks from the previous
DAG run. Read more about it in
the Airflow documentation.
Tasks queued for too long will be cancelled and rescheduled
If an Airflow task is kept in the queue for too long then the scheduler will reschedule it again for execution (in Airflow versions earlier than 2.3.1, the task is also marked as failed and retried if eligible for a retry).
One way to observe the symptoms of this situation is to look at the chart with number of queued tasks ("Monitoring" tab in Cloud Composer UI) and if the spikes in this chart don't drop within about two hours then the tasks will most-likely be rescheduled (with no logs) followed by "Adopted tasks were still pending ..." log entries in the scheduler logs. In such cases, you might see "Log file is not found..." message in Airflow tasks logs because the task was not executed.
In general, this behavior is expected and the next instance of the scheduled task is meant to be executed according to the schedule. If you observe a lot of such cases in your Cloud Composer environments then it might mean that there is not enough Airflow workers in your environment to process all of the scheduled tasks.
Resolution: To solve this issue, you need to make sure there is always capacity in Airflow workers to run queued tasks. For example, you may increase number of workers or worker_concurrency. You may also tune parallelism or pools to prevent queuing tasks more than capacity you have.
Sporadically, stale tasks might block the execution of a specific DAG
In regular cases, Airflow scheduler should be able to deal with situations in which there are stale tasks in the queue and for some reason it's not possible to execute them correctly (e.g. a DAG to which the stale tasks belong was deleted).
If these stale tasks are not purged by the scheduler, then you might need to delete them manually. You can do that, for example, in Airflow UI - you can navigate to (Menu > Browser > Task Instances), find queued tasks belonging to a stale DAG and delete them.
To solve this issue, upgrade your environment to Cloud Composer version 2.1.12 or later.
Cloud Composer approach to [scheduler]min_file_process_interval parameter
Cloud Composer changes the way [scheduler]min_file_process_interval is used by Airflow scheduler.
Airflow 1
In case of Cloud Composer using Airflow 1, users can set the value
of [scheduler]min_file_process_interval between 0 and 600 seconds. Values higher than
600 seconds bring the same results as if [scheduler]min_file_process_interval is set to 600 seconds.
Airflow 2
In Airflow 2, [scheduler]min_file_process_interval can only be used with
versions 1.19.9 and 2.0.26 or more recent
Cloud Composer versions earlier than 1.19.9 and 2.0.26
In these versions,
[scheduler]min_file_process_intervalis ignored.Cloud Composer versions 1.19.9 or 2.0.26, or more recent versions
Airflow scheduler is restarted after a certain number of times all DAGs are scheduled and
[scheduler]num_runsparameter controls how many times its done by scheduler. When scheduler reaches[scheduler]num_runsscheduling loops, it is restarted - Scheduler is a stateless component and such an restart is an auto-healing mechanism for any problems that Scheduler might experience. When not specified, the default value of[scheduler]num_runsis applied which is 5000.[scheduler]min_file_process_intervalcan be used to configure how frequently DAG parsing happens but this parameter cannot be longer than time required for a scheduler to perform[scheduler]num_runsloops when scheduling your DAGs.
Scaling Airflow configuration
Airflow provides Airflow configuration options that control how many tasks and DAGs Airflow can execute at the same time. To set these configuration options, override their values for your environment.
-
The
[celery]worker_concurrencyparameter controls the maximum number of tasks that an Airflow worker can execute at the same time. If you multiply the value of this parameter by the number of Airflow workers in your Cloud Composer environment, then you get the maximum number of tasks that can be executed in a given moment in your environment. This number is limited by the[core]parallelismAirflow configuration option, which is described further.In Cloud Composer 2 environments, the default value of
[celery]worker_concurrencyis calculated automaticallyFor Airflow versions: 2.3.3 and later,
[celery]worker_concurrencyis set to a minimum value out of 32, 12 * worker_CPU, and 8 * worker_memory.For Airflow versions: 2.2.5 or earlier,
[celery]worker_concurrencyis set to 12 * number of workers' CPUs.
-
The
[core]max_active_runs_per_dagAirflow configuration option controls the maximum number of active DAG runs per DAG. The scheduler does not create more DAG runs if it reaches this limit.If this parameter is set incorrectly, you might encounter a problem where the scheduler throttles DAG execution because it cannot create more DAG run instances in a given moment.
-
The
[core]max_active_tasks_per_dagAirflow configuration option controls the maximum number of task instances that can run concurrently in each DAG. It is a DAG-level parameter.If this parameter is set incorrectly then you might encounter a problem where the execution of a single DAG instance is slow because there is only a limited number of DAG tasks that can be executed at a given moment.
Solution: increase
[core]max_active_tasks_per_dag. Parallelism and pool size
The
[core]parallelismAirflow configuration option controls how many tasks the Airflow scheduler can queue in the Executor's queue after all dependencies for these tasks are met.This is a global parameter for the whole Airflow setup.
Tasks are queued and executed within a pool. Cloud Composer environments use only one pool. The size of this pool controls how many tasks can be queued by the scheduler for execution in a given moment. If the pool size is too small, then the scheduler cannot queue tasks for execution even though thresholds, which are defined by the
[core]parallelismconfiguration option and by the[celery]worker_concurrencyconfiguration option multiplied by the number of Airflow workers, are not met yet.You can configure the pool size in the Airflow UI (Menu > Admin > Pools). Adjust the pool size to the level of parallelism you expect in your environment.
Usually,
[core]parallelismis set a product of maximum number of workers and [celery]worker_concurrency.
DAGs are not scheduled by the scheduler due to DAG processor timeouts
For more information about this issue, see Troubleshooting DAGs.
Marking tasks as failed after reaching dagrun_timeout
The scheduler marks tasks that are not finished (running, scheduled and queued)
as failed if a DAG run doesn't finish within
dagrun_timeout (a DAG parameter).
Solution:
Extend
dagrun_timeoutto meet the timeout.(Cloud Composer 2) Increase the number of workers or increase worker performance parameters, so that the DAG is executed faster.
Symptoms of Airflow Database being under load pressure
Sometimes in the Airflow scheduler logs you might see the following warning log entry:
Scheduler heartbeat got an exception: (_mysql_exceptions.OperationalError) (2006, "Lost connection to MySQL server at 'reading initial communication packet', system error: 0")"
Similar symptoms might also be observed in Airflow worker logs:
For MySQL:
(_mysql_exceptions.OperationalError) (2006, "Lost connection to MySQL server at
'reading initial communication packet', system error: 0")"
For PostgreSQL:
psycopg2.OperationalError: connection to server at ... failed
Such errors or warnings might be a symptom of the Airflow database being overwhelmed with the number of open connections or the number of queries executed in the same time, either by schedulers or other Airflow components like workers, triggerers, and web servers.
Possible solutions:
Scale up the Airflow database:
- (Cloud Composer 1) Change the machine type of the Cloud SQL instance that stores the Airflow database of your environment.
- (Cloud Composer 2) Adjust the size of your environment.
Lower the number of Schedulers. In most cases, either one or two schedulers are enough to parse and schedule Airflow tasks; it's not recommended to configure more than two schedulers, unless there is a justified case.
Avoid using global variables in Airflow DAGs: Cloud Composer environment variables and Airflow variables.
Set [scheduler]scheduler-heartbeat-sec to a higher value, for example, to 15 seconds or more.
Set [scheduler]job-heartbeat-sec to a higher value, for example 30 seconds or more.
Set [scheduler]scheduler_health_check_threshold to a value equal to
[scheduler]job-heartbeat-secmultiplied by4.
Web server shows 'The scheduler does not appear to be running' warning
The scheduler reports its heartbeat on a regular basis to the Airflow database. Based on this information, the Airflow web server determines if the scheduler is active.
Sometimes, if the scheduler is under heavy load then it might not be able to report its heartbeat every [scheduler]scheduler-heartbeat-sec.
In such a situation, the Airflow web server might show the following warning:
The scheduler does not appear to be running. Last heartbeat was received <X>
seconds ago.
Possible solutions:
Increase CPU and memory the resources for the scheduler.
Optimize your DAGs so that their parsing and scheduling if faster and doesn't consume too much of the scheduler resources.
Avoid using global variables in Airflow DAGs: Cloud Composer environment variables and Airflow variables.
Increase the value of the [scheduler]scheduler-health-check-threshold so that the web server waits longer before reporting the unavailability of the scheduler.
Workarounds for issues encountered during backfilling DAGs
Sometimes, you might want to re-run DAGs that were already executed. You can do it with the Airflow command line tool in the following way:
Airflow 1
gcloud composer environments run \
  ENVIRONMENT_NAME \
  --location LOCATION \
  backfill -- -B \
  -s START_DATE \
  -e END_DATE \
  DAG_NAME
To re-run only failed tasks for a specific DAG, also use the
--rerun_failed_tasks argument.
Airflow 2
gcloud composer environments run \
  ENVIRONMENT_NAME \
  --location LOCATION \
   dags backfill -- -B \
   -s START_DATE \
   -e END_DATE \
   DAG_NAME
To re-run only failed tasks for a specific DAG, also use the
--rerun-failed-tasks argument.
Replace:
ENVIRONMENT_NAMEwith the name of the environment.LOCATIONwith the region where the environment is located.START_DATEwith a value for thestart_dateDAG parameter, in theYYYY-MM-DDformat.END_DATEwith a value for theend_dateDAG parameter, in theYYYY-MM-DDformat.DAG_NAMEwith the name of the DAG.
Backfill operation might sometimes generate a deadlock situation where a backfill is not possible because there is a lock on a task. For example:
2022-11-08 21:24:18.198 CET DAG ID Task ID Run ID Try number
2022-11-08 21:24:18.201 CET -------- --------- -------- ------------
2022-11-08 21:24:18.202 CET 2022-11-08 21:24:18.203 CET These tasks are deadlocked:
2022-11-08 21:24:18.203 CET DAG ID Task ID Run ID Try number
2022-11-08 21:24:18.204 CET ----------------------- ----------- ----------------------------------- ------------
2022-11-08 21:24:18.204 CET <DAG name> <Task name> backfill__2022-10-27T00:00:00+00:00 1
2022-11-08 21:24:19.249 CET Command exited with return code 1
...
2022-11-08 21:24:19.348 CET Failed to execute job 627927 for task backfill
In some cases, you cn use the following workarounds to overcome deadlocks:
Disable mini-Scheduler by overriding the
[core]schedule-after-task-executiontoFalse.Run backfills for narrower date ranges. For example, set
START_DATEandEND_DATEto specify a period of only 1 day.