| title | description | author | tags | date_published |
|---|---|---|---|---|
Use Prometheus and JMX to monitor Java applications on Google Kubernetes Engine |
Learn how to monitor Java applications running on GKE with Prometheus and Cloud Monitoring. |
xiangshen-dk |
monitoring, stackdriver, prometheus, jmx, java |
2021-06-04 |
Xiang Shen | Solutions Architect | Google
Contributed by Google employees.
This tutorial describes how to use Prometheus and Java Management Extensions(JMX) to monitor a Java application running on a Google Kubernetes Engine cluster. This tutorial shows you how to deploy Prometheus, enable JMX monitoring, and view metrics data in Cloud Monitoring. This tutorial is for developers and operators who want to have better observability of the Java metrics exposed by JMX.
- Deploy Prometheus on a Google Kubernetes Engine cluster.
- Deploy a Java application with JMX enabled.
- Configure the Cloud Monitoring Prometheus sidecar.
- Visualize JVM metrics in Cloud Monitoring.
This tutorial uses billable components of Google Cloud, including the following:
To generate a cost estimate based on your projected usage, use the pricing calculator.
For this tutorial, you need a Google Cloud project. You can create a new project or select a project that you have already created. When you finish this tutorial, you can avoid continued billing by deleting the resources that you created. To make cleanup easiest, you may want to create a new project for this tutorial, so that you can delete the project when you're done. For details, see the "Cleaning up" section at the end of the tutorial.
- Select or create a Google Cloud project.
- Enable billing for your project.
- Enable the Kubernetes Engine, Container Registry, Cloud Monitoring, and Cloud Build APIs.
- Make sure that you have either a project owner or editor role, or sufficient permissions to use the services listed above.
This tutorial uses the gcloud command-line tool. We recommend that you run the commands in this tutorial in Cloud Shell.
You need to define several variables that control where elements of the infrastructure are deployed.
-
In Cloud Shell, set the region, zone, and project ID:
region=us-east1
zone=${region}-b
project_id=[YOUR_PROJECT_ID]
Replace
[YOUR_PROJECT_ID]with your project ID. This tutorial uses the regionus-east1. If you want to change the region, check that the zone values are appropriate for the region that you specify. -
Set the default zone and project ID so that you don't need to specify these values in subsequent commands:
gcloud config set project ${project_id}
gcloud config set compute/zone ${zone}
-
In Cloud Shell, create the GKE cluster:
gcloud container clusters create jmx-demo-cluster \ --zone ${zone} \ --tags=gke-cluster-with-jmx-monitoring -
Wait a few minutes until the cluster is successfully created, and ensure that the cluster's status is RUNNING.
You can run the following command to view the status:
gcloud container clusters list
-
Clone the sample repository:
git clone https://github.com/xiangshen-dk/gke-prometheus-jmx.gitThe sample repository includes the Kubernetes manifests for Prometheus and the demonstration app that you deploy.
-
Go to the directory that contains the tutorial files:
cd gke-prometheus-jmx -
Create a dedicated namespace in the cluster for Prometheus:
kubectl create namespace prometheus -
Create a Prometheus Kubernetes service account, a
ClusterRolerole, and a cluster role binding:kubectl apply -f clusterRole.yaml -
Create the Prometheus configuration to scrape metrics from apps running in the
GKEcluster:kubectl apply -f config-map.yaml -
Define environment variables used in the Prometheus deployment manifest:
export KUBE_NAMESPACE=prometheus export KUBE_CLUSTER=jmx-demo-cluster export GCP_LOCATION=$zone export GCP_PROJECT=$(gcloud info --format='value(config.project)') export DATA_DIR=/prometheus export DATA_VOLUME=prometheus-storage-volume export SIDECAR_IMAGE_TAG=0.8.2 export PROMETHEUS_VER_TAG=v2.19.3 -
Apply the Prometheus deployment manifest by using the environment variables you defined:
envsubst < prometheus-deployment.yaml | kubectl apply -f -The manifest creates the Prometheus deployment with a single pod. The pod is composed of two containers: the Prometheus server container and Google's Monitoring sidecar. The Prometheus server container collects metrics from pods in the GKE cluster that are exporting Prometheus metrics. The server uses the Monitoring sidecar container to push metrics to Monitoring.
-
Confirm that the status of the Prometheus pod is Running:
kubectl get pods -n prometheusDeployment can take a few minutes.
When deployment is complete, the output looks similar to the following:
NAME                                     READY   STATUS    RESTARTS   AGE
prometheus-deployment-6d76c4f447-cbdlr   2/2     Running   0          38s
Using the Prometheus Kubernetes service account, Prometheus discovers resources that are running in a GKE cluster. Some of these resources are already configured to export Prometheus metrics.
-
Set up port forwarding to the Prometheus server UI that's running in the GKE cluster:
export PROMETHEUS_POD_GKE=$(kubectl get pods --namespace prometheus -l "app=prometheus-server" \ -o jsonpath="{.items[0].metadata.name}") kubectl port-forward --namespace prometheus $PROMETHEUS_POD_GKE 8080:9090 >> /dev/null & -
In Cloud Shell, click Web preview in the upper-right corner of the panel, and choose Preview on port 8080 from the menu that appears.
If the port is not 8080, click Change port, change the port to 8080, and then click Change and preview.
The Prometheus server UI is displayed.
-
In the Prometheus UI, select Status > Service discovery.
-
Click Status > Targets.

Targets are the HTTP(S) endpoints defined in resources that are exporting Prometheus metrics at regular intervals. You see various Kubernetes resources that are
exporting metrics, such as the Kubernetes API server exporting metrics from the /metrics HTTPS endpoint.
In this tutorial, you create a Spring Boot application to test the configuration. To learn more about the application, see the quickstart for Java.
-
In Cloud Shell, create a new empty web project:
curl https://start.spring.io/starter.zip \ -d dependencies=web \ -d javaVersion=11 \ -d bootVersion=2.4.4.RELEASE \ -d name=helloworld \ -d artifactId=helloworld \ -d baseDir=helloworld-gke \ -o helloworld-gke.zip unzip helloworld-gke.zip -
Go to the
helloworld-gkedirectory:cd helloworld-gke -
Update the
HelloworldApplicationclass by adding a@RestControllerto handle the/mapping and return the response that you need:cp ../HelloworldApplication.java src/main/java/com/example/helloworld/HelloworldApplication.java -
Copy the example Dockerfile from the cloned repository:
cp ../Dockerfile .If you open the Dockerfile, you can see that it downloads the Prometheus JMX exporter and runs it as a Java agent on port 9404:
# Run the web service on container startup. CMD ["java", "-javaagent:./jmx_prometheus_javaagent-0.15.0.jar=9404:config.yaml", \ "-Djava.security.egd=file:/dev/./urandom", \ "-Dcom.sun.management.jmxremote.ssl=false", \ "-Dcom.sun.management.jmxremote.authenticate=false", \ "-Dcom.sun.management.jmxremote.port=5555", \ "-Dserver.port=${PORT}","-jar", \ "/helloworld.jar"] -
Copy the configuration file for the JMX exporter:
cp ../config.yaml .In the
jmx_exporterrepository, there are more configuration examples for common applications such as Tomcat, Spark, and Kafka.JMX is configured to use port 5555 and disable authentication and SSL. If you need to change the setup, refer to the JMX documentation.
-
Build the container image using Cloud Build:
gcloud builds submit --tag gcr.io/${project_id}/helloworld-gke . -
Deploy the
hellworld-gkeapplication to the GKE cluster:envsubst < ../helloworld-deployment.yaml | kubectl apply -f -If you open the
helloworld-deployment.yamlfile, you can see that it uses the annotations in the Deployment to let Prometheus know to scrape the metrics and on which port:# This file configures the hello-world app which serves public web traffic. apiVersion: apps/v1 kind: Deployment metadata: name: helloworld-gke spec: replicas: 1 selector: matchLabels: app: hello template: metadata: labels: app: hello annotations: prometheus.io/scrape: 'true' prometheus.io/port: '9404' spec: containers: - name: hello-app # Replace $GCLOUD_PROJECT with your project ID image: gcr.io/${GCP_PROJECT}/helloworld-gke:latest # This app listens on port 8080 for web traffic by default. ports: - containerPort: 8080 env: - name: PORT value: "8080" --- apiVersion: v1 kind: Service metadata: name: hello spec: type: LoadBalancer selector: app: hello ports: - port: 80 targetPort: 8080 -
View the status of the
helloworld-gkepods:kubectl get podsRepeat this command until the output looks like the following, with the
helloworld-gkepod running:NAME READY STATUS RESTARTS AGE helloworld-gke-54c5b678c6-csdlw 1/1 Running 0 28s -
Check to see that the service is deployed:
kubectl get servicesThe output should be similar to the following:
NAME TYPE CLUSTER-IP EXTERNAL-IP PORT(S) AGE hello LoadBalancer 10.47.242.246 34.73.69.237 80:31374/TCP 62s kubernetes ClusterIP 10.47.240.1 <none> 443/TCP 37m -
When the external IP address is provisioned, open a browser window using the external IP address as the URL.
For example, using the value from above:
http://34.73.69.237.When the service is running, you see the response
Hello World!
-
In Prometheus, in the Expression field, type
jvm_memory_bytes_usedin the search field and click the Graph tab.You see a graph similar to the following:

Prometheus is configured to export metrics to Google Cloud's operations suite as external metrics.
-
In the Cloud Console to the Cloud Monitoring Metrics explorer page.
-
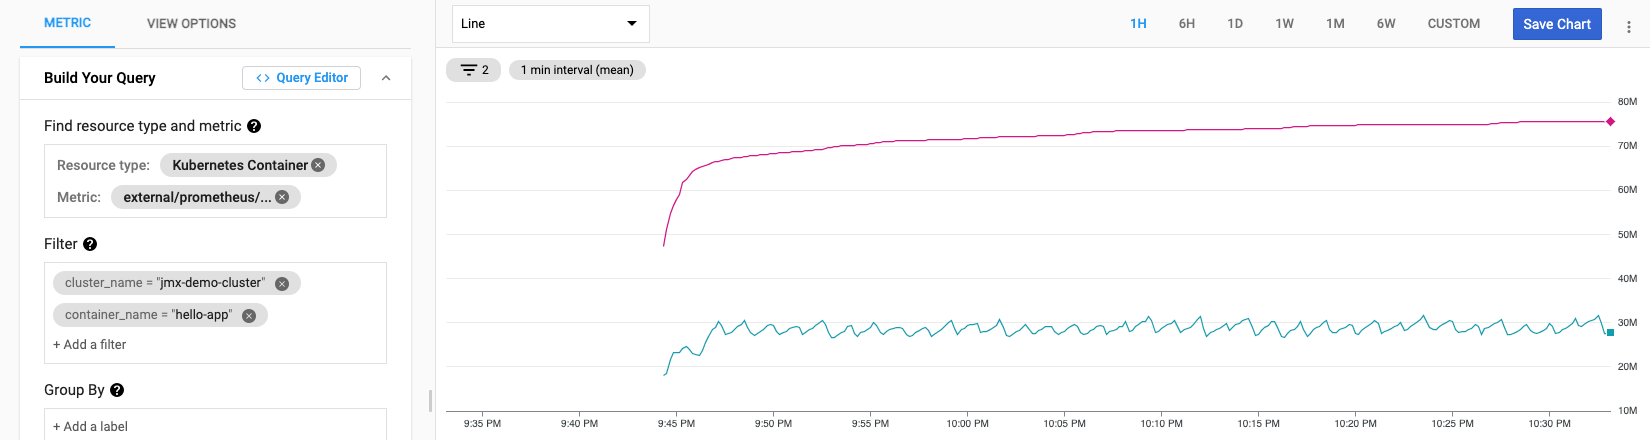
In the Find resource type and metric menu, select Kubernetes Container (
k8s_container) for the Resource type. -
For the Metric field, select one with the prefix
external/prometheus/. For example, you might selectexternal.googleapis.com/prometheus/jvm_memory_bytes_used.In the following example, a filter was added to display the metrics for a specific cluster and a container. Filtering is useful when you have multiple clusters and many containers:
The easiest way to eliminate billing is to delete the project you created for the tutorial.
- In the Cloud Console, go to the Manage resources page.
- In the project list, select the project that you want to delete and then click Delete.
- In the dialog, type the project ID and then click Shut down to delete the project.
If you don't want to delete the whole project, run the following command to delete the clusters:
gcloud container clusters delete jmx-demo-cluster --zone us-east1-b
You can delete the container images using the following steps:
- Go to the Container Registry page.
- Click the
helloworld-gkeimage, and select all versions by marking the checkbox next to Name. - Click Delete at the top of the page.
- Learn about white-box app monitoring for GKE with Prometheus.
- Learn about the Cloud Monitoring integration with Prometheus.
- Learn about Monitoring apps running on multiple GKE clusters using Prometheus and Cloud Monitoring.
- Try out other Google Cloud features for yourself. Have a look at our tutorials.