Cloud Code for VS Code lets you easily debug an application deployed to
Cloud Run by leveraging
skaffold debug. For
detailed information about Skaffold debugging, see
Debugging with Skaffold.
You don't need to complete manual setup like setting up port forwarding or
injecting language-specific debug arguments. Debugging requires a
Cloud Code-ready Cloud Run application
that includes a skaffold.yaml configuration file and a launch.json file of
type cloudcode.cloudrun.
Debugging your Cloud Run service
To debug your service, follow these steps:
To run your service and attach a debugger session to it, open the command palette (press
Ctrl/Cmd+Shift+Por click View > Command Palette) and then run the Debug on Cloud Run Emulator command.In the Run/Debug on Cloud Run Emulator dialog, set the specifications for your configuration:
- Choose Docker or Buildpacks as your builder and then specify your Dockerfile or Buildpack.
- (Optional) To specify a Dockerfile target or build arguments, click Show Advanced Build Settings and then specify the target or arguments.
- (Optional) To specify a custom service name, container image URL, container port, identity for the service to use, number of dedicated CPUs, or amount of memory to allocate to each container instance, click Show Advanced Service Settings and then specify the values.
- (Optional) To specify any environment variables, click Show Advanced Service Settings, click Environment Variables, and then specify the values.
- (Optional) To specify Cloud SQL connections, click Connections and then specify one connection per line.
- (Optional) To have VS Code reestablish a debugging session after you save a change to your code, check the Automatically re-build and re-run on changes checkbox.
If you want to further customize how your service is run, you can edit your
launch.jsonfile directly.To begin debugging your service, click Debug.
If prompted, authenticate your credentials to run and debug an application locally.
For each debuggable container in your service, confirm or enter the directory in the remote container where the program you'd like to debug is found.
Alternatively, you can press
ESCto skip debugging a container.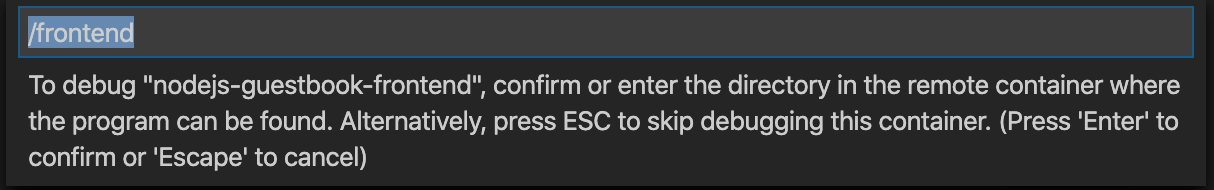
Cloud Code attaches a debug session for each debuggable container in the service.
By default, when you save a change to your application, Cloud Code redeploys your application and sets up a new debug session. You can toggle this feature with the
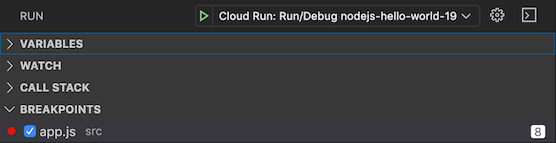
watchflag in your project's launch configuration.To add a breakpoint, click in the editor margin of the file you're debugging.
Red filled circles signify active breakpoints and gray hollow circles signify disabled breakpoints.
For finer breakpoint control, you can use the Breakpoints section in VS Code's Debug view.
When you send a new request to your service, it pauses at the line you specified.
After your session completes, right-click to use the following commands:
- View Logs: Open the application logs of a specific deployment with the Cloud Code Logs Explorer
- Open URL: Open the application service URL of a specific service in a web browser
If you've turned off watch mode in your launch configuration and you want to make changes to your application and rebuild and redeploy the application, click the Cloud Code status bar and then click Turn on watch mode.
If you want to inspect variables and stack info, use the Debug Sidebar. To interact with the debugging session, use the Debug Console in the bottom pane debugger.
To stop your deployment, click the Stop button in the action bar for your current deployment.

Configuration details
Cloud Code handles the following language-specific configuration details:
Node.js
Rewriting the entrypoint to invoke:
node --inspect=localhost:9229
Python
Installing the ptvsd module using an Init Container and rewriting the
entrypoint to invoke:
python -m ptvsd --host localhost --port 5678
Go
Installing the
dlv debugger
using an Init Container and rewriting the entrypoint such that the launched
debug session runs with a debug server only (in headless mode), continues the
debugged process on start, accepts multiple client connections, and listens at
localhost:56268:
dlv exec --headless --continue --accept-multiclient --listen=localhost:56268 --api-version=2, <app> --
Java
Adding an environment JAVA_TOOLS_OPTIONS with the appropriate Java Debug
Wire Protocol (JDWP) configuration such that the JDWP debugging agent listens
for a socket connection on port 5005 and allows the VM to begin executing
before the debugger is attached:
jdwp=transport=dt_socket,server=y,suspend=n,address=5005,quiet=y
.NET
.NET Core applications are configured to be deployed along with vsdbg for VS
Code.
If you encounter problems with the automatic configuration, see Detailed debugger configuration and setup for help troubleshooting.