With Cloud Code, you can debug your Cloud Run services locally in a Cloud Run-like environment. You can set breakpoints, step through your code, and debug remote services running in containers.
Cloud Code also enables you to debug an application while making changes to, and iterating on, source code.
Defining your debug configuration
Before you debug your service, you must create your debug configuration:
- Navigate to Run/Debug configuration selector in the Navigation bar and click Edit Configurations.
- Choose Cloud Run: Run Locally under Cloud Code: Cloud Run.
- Click OK.
Debugging your service
To debug your service, follow these steps:
Click
 Debug for Cloud Run: Run Locally to start the development cycle in
debug mode.
Debug for Cloud Run: Run Locally to start the development cycle in
debug mode.
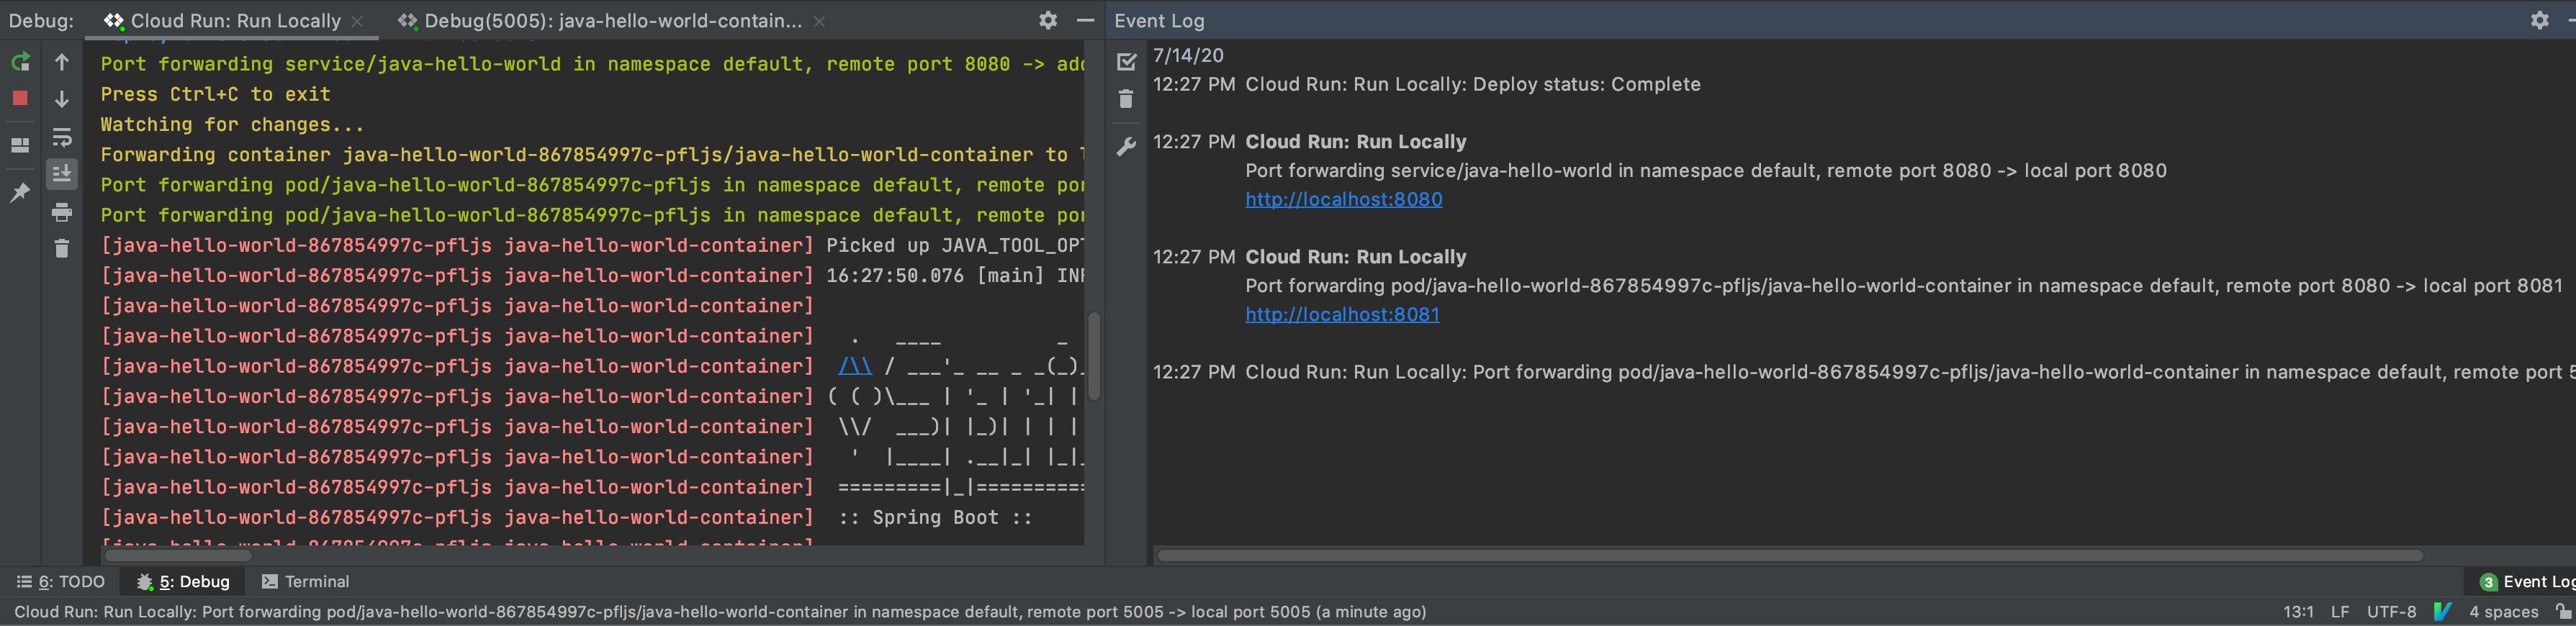
Cloud Code will attach a debug session. Once successful, the Debug Tool window opens, confirming connection (within the Console tab).
Click the gutter at the executable line of the code where you want to add a breakpoint.
Red filled circles denote active breakpoints, while red-outlined hollow circles signify disabled breakpoints.
To access your running service, click the URL displayed in your Event Log panel.
When you do, a new request is sent to your service and it pauses at the breakpoint-marked line.
To end the debugging session, click the stop icon on the Cloud Run: Run Locally run configuration.
Supported IDEs
The following table lists the languages and IDEs that Cloud Code supports for debugging. The table also lists the required plugins, where applicable:
| Language | Supported IDEs and editions | Required plugin |
|---|---|---|
| Java | IntelliJ IDEA Ultimate | N/A |
| IntelliJ IDEA Community | N/A | |
| Go | IntelliJ IDEA Ultimate | Go plugin |
| GoLand | N/A | |
| Node.js | IntelliJ IDEA Ultimate | Node.js plugin |
| WebStorm | N/A | |
| Python | IntelliJ IDEA Ultimate | Python plugin |
| PyCharm Professional | N/A |
For more information about IDE support, see Supported JetBrains IDEs.
With Cloud Code, you can set breakpoints and debug remote applications running in containers for the following languages:
Java
Cloud Code automatically adds an environment variable,
JAVA_TOOL_OPTIONS, with the appropriate JDWP configuration to
enable debugging. If JAVA_TOOL_OPTIONS is already present,
Cloud Code uses existing settings specified in
JAVA_TOOL_OPTIONS.
Node.js
Depending on the structure of your application and its image build configuration, you might have to help the debugger map your local sources to the remote sources in the container. This enables the Node debugger to correctly process your breakpoints.
You can configure this in one of the following ways:
Manual configuration
Select the Cloud Run: Run Locally Run Configuration from the dropdown and then click Edit Configurations. On the Debug tab, configure the source mapping from your local application source to the source location in the remote container.

Configuration options:
- File/directory - the local file or directory of your application running on Cloud Run.
- Remote path - the path to the file or directory running in the container on Cloud Run.
Automatic configuration
You can choose to defer this mapping to Cloud Code. When you start your debug session, Cloud Code attempts to infer this mapping automatically. The inferred mapping is presented to you in a dialog; one dialog for each artifact you are debugging.

Configuration options:
- Local path - the local path to the root of the artifact you are debugging.
- Remote path - the path to the file or directory running in the container on Cloud Run. You can choose to override this with your own value. If you click Cancel, no mapping is applied.
Go
To configure your application for debugging, your app must be a
Go Module-based application
and be identified as being Go-based by setting one of the
standard Go runtime environment variables
in the container, such as GODEBUG, GOGC, GOMAXPROCS, or
GOTRACEBACK. GOTRACEBACK=single is the default setting for Go
and GOTRACEBACK=all is a generally useful configuration.
Optionally (but recommended), your app should be built with the
-gcflags='all=-N -l' options to disable optimizations. Skaffold
Profiles are a useful
option for this purpose and can be set with the Deployment Profile
field in your Run configuration on the Build/Deploy tab.
Python
To configure your application for debugging, ensure you meet the following prerequisites:
IDE, edition, and plugin are compatible
For compatible IDEs, editions, and plugins, see Supported IDEs.
Skaffold version is 1.25.0 or greater
You can allow Cloud Code to manage your dependencies, or point to a local Skaffold installation. See Preferences > Tools > Cloud Code > Dependencies.
Python interpreter is configured
Without a Python interpreter configured in your project, debugging won't work, as there is no way to run
pydevd, the underlying Python debugger.IDE How to configure IntelliJ IDEA Python debugging with Cloud Code requires a Python SDK to be configured for your project.
Go to File > Project Structure and add a Python SDK in the Project tab. If none exists, add one under the SDK tab.PyCharm Go to File > Settings > Project > Python Interpreter or for Mac OS X, PyCharm > Preferences > Project > Python Interpreter, and add a Python interpreter.
For more information, see the Skaffold debug documentation.