Cloud Debugger può acquisire e ispezionare lo stack di chiamate e le variabili locali di un'applicazione in esecuzione nel cloud senza arrestare o rallentare l'app. Debugger supporta i prodotti Google Cloud, tra cui App Engine, Compute Engine, GKE e Cloud Run.
Debugger funziona in modo molto simile al debugger standard di IDE e fornisce la stessa interfaccia utente, con le seguenti differenze chiave:
- Debugger non mette in pausa l'esecuzione dell'applicazione in esecuzione.
- Non puoi scorrere un'applicazione in Debugger.
Per ulteriori informazioni sulle piattaforme supportate da Debugger, consulta la configurazione del debugger.
Requisiti
Per eseguire Debugger, hai bisogno di:
- Codice Cloud
- Java 7 o 8
- Git
- Un Account Google che può eseguire il deployment delle app di App Engine
Utilizzo di Debugger
Per utilizzare Debugger:
- Apri il tuo progetto all'interno di IntelliJ.
- Fai clic su Esegui > Modifica configurazioni.
- Fai clic su + Aggiungi nuova configurazione nell'angolo in alto a sinistra e seleziona Google Cloud Debugger dall'elenco a discesa.
- Inserisci un nome per la configurazione nel campo Nome.
- Assicurati che il progetto sia selezionato nel campo Project.
- Fai clic su OK.
- Per avviare il debugger, fai clic su
 Debug nella barra degli strumenti.
- Nella finestra di dialogo Allega a un'applicazione, seleziona il modulo di backend di cui vuoi eseguire il debug, quindi fai clic su Allega.
Impostazione di una posizione snapshot
Uno snapshot acquisisce le variabili locali e lo stack di chiamate nella posizione specificata nel codice sorgente. La posizione dello snapshot si applica a tutte le istanze in esecuzione dell'applicazione.
Per impostare una posizione dello snapshot:
- Dopo aver allegato Debugger a un'applicazione in esecuzione, vai al file contenente il codice sorgente che vuoi guardare.
- Fai clic sulla riga eseguibile di cui vuoi creare uno snapshot nell'area di grondaia sinistra, proprio come faresti quando imposti un punto di interruzione della riga per un'applicazione locale utilizzando il regolare debugger IDEA.
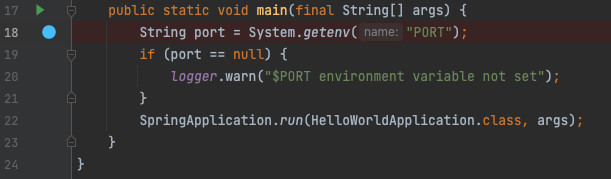
- Nella finestra di dialogo Imposta punto di interruzione che viene visualizzato, seleziona Posizione snapshot Cloud. Un cerchio blu viene visualizzato nel margine per indicare la posizione dello snapshot, mentre nel riquadro Snapshot snapshot vengono visualizzati gli snapshot in attesa.
- Per disabilitare la posizione dello snapshot, fai clic con il pulsante destro del mouse sul cerchio blu e deseleziona la casella di controllo Abilitata.
- Per rimuovere la posizione dello snapshot, fai clic sul cerchio blu.
Recupero dello snapshot
La prima volta che un'istanza esegue il codice nella posizione dello snapshot che hai impostato, il debugger acquisisce uno snapshot e lo rende disponibile per la visualizzazione. Puoi quindi esaminare lo snapshot e utilizzare i dati per eseguire il debug dell'applicazione.
L'etichetta nello snapshot del riquadro Snapshot snapshot cambia da In attesa al momento in cui Debugger ha acquisito lo snapshot.
Concetti avanzati
Imposta una condizione snapshot
Una condizione snapshot è un'espressione booleana che indica al debugger di acquisire uno snapshot solo quando restituisce true. Ad esempio, x !=0. La condizione è un'espressione booleana completa che può includere operatori logici e numerici, ad esempio score < 0 || score > 500.
Per impostare una condizione dello snapshot:
- Fai clic con il pulsante destro del mouse sulla posizione dello snapshot della cloud (il cerchio blu) nella grondaia.
- Nel campo Condizione, inserisci la condizione.
Espressioni di controllo
A volte le informazioni necessarie per il debug di un problema non sono immediatamente visibili nelle variabili e nei campi locali dell'applicazione. In particolare, quando esegui su App Engine, Security Manager ti impedisce di approfondire troppo i membri privati delle classi di sistema come java.util.Hashmap. In questi casi, un'espressione di controllo funge da variabile locale temporanea efficace per mostrare informazioni aggiuntive. Le espressioni di controllo possono valutare espressioni complesse e attraversare le gerarchie di oggetti quando viene acquisito uno snapshot.
Puoi specificare un'espressione di controllo dopo aver impostato la posizione dello snapshot. Le espressioni di controllo supportano le stesse caratteristiche linguistiche delle condizioni dello snapshot, come descritto nella sezione Impostare una condizione dello snapshot.
Richiedere assistenza
Per inviare feedback o segnalare un problema nel tuo IDE per IntelliJ, vai a Strumenti > Cloud Code > Guida/Informazioni > Invia un feedback o segnala un problema per segnalare un problema su GitHub o fai una domanda su Stack Overflow.Puoi anche iscriverti al canale #cloud-code, che fa parte della community Google Cloud Slack.