UDM Search
The UDM search function lets you find Unified Data Model (UDM) events and alerts within your Chronicle instance. UDM search includes a variety of search options that help you to navigate through your UDM data. You can search for individual UDM events and groups of UDM events tied to shared search terms.
For Chronicle Security Operations customers, alerts can also be ingested from connectors and webhooks. You can use UDM search to find these alerts as well.
For more information about UDM, see Format log data as UDM and Unified Data Model field list.
Access UDM search
To access Chronicle UDM Search, click Search in the navigation bar. You can also access UDM search by entering a valid UDM field from any search field in Chronicle and pressing CTRL+Enter.
For a list of all valid UDM fields, see Unified Data Model field list.

Figure 1. UDM Search
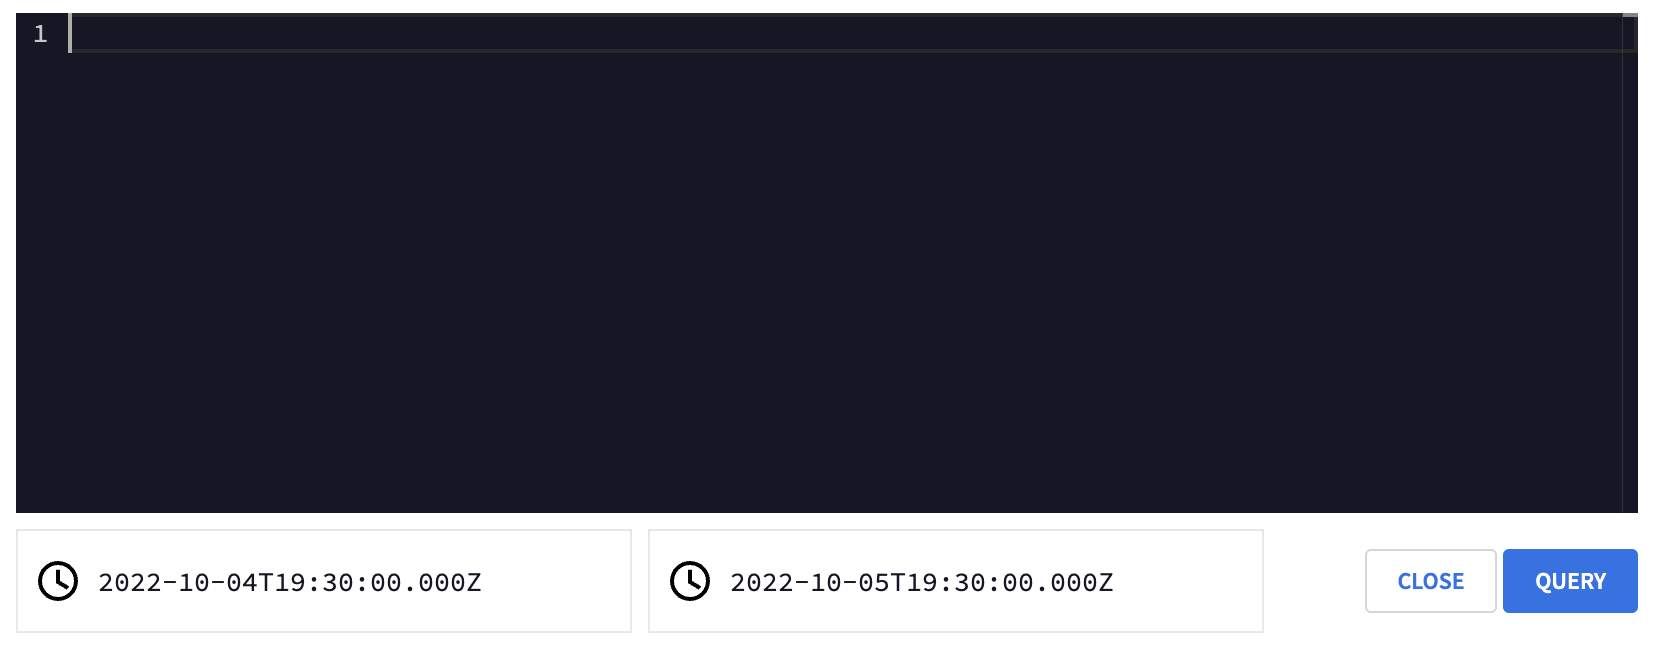
Figure 2. UDM Search window which opens with CTRL+Enter
Enter a UDM search
Complete the following steps to enter a UDM search in the UDM Search field. When you finish entering a UDM search, click Run Search. The Chronicle user interface only lets you enter a valid UDM search expression. You can also adjust the range of data to search by opening the date range window.
If your search is too broad, Chronicle returns a warning message indicating that it cannot display all of the search results. Reduce the scope of the search and run it again. When a search is too broad, Chronicle returns the most recent results up to the search limit (one million events and one thousand alerts). There might be significantly more events and alerts that match, but are not being displayed at the moment. Be aware of this when analyzing the results. Google recommends applying additional filters and running the original search until you are below the limit. Instead, apply additional filters and re-run the original search until you are below the limit.
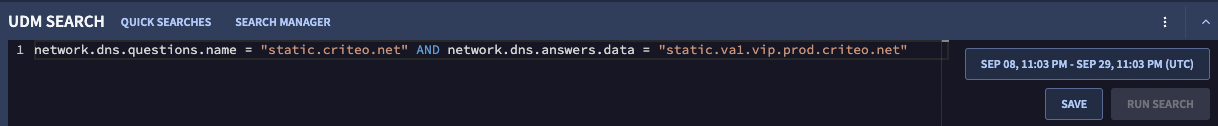
Figure 3. Run Search
UDM queries are based on UDM fields, which are all listed in the Unified Data Model field list. You can also view UDM fields within the context of searches by using Filters or Raw Log Search.
To search for events, enter a UDM field name in the search field. The user interface includes automatic completion and displays valid UDM fields based on what you have entered.
Once you have entered a valid UDM field, select a valid operator. The user interface displays the available valid operators based on the UDM field you entered. The following operators are supported:
<, ><=, >==, !=nocase-- supported for strings
Once you have entered a valid UDM field and operator, enter the corresponding log data you are searching for. The following data types are supported:
Enumerated values: the user interface displays a list of valid enumerated values for a given UDM field.
For example (use double quotes and all caps):
metadata.event_type = "NETWORK_CONNECTION"Additional values: you can use 'field[key] = value' to search additional and labels fields for events.
For example:
additional.fields["key"]="value"Bools: you can use
trueorfalse(all characters are case-insensitive, and the keyword is not enclosed in quotes).For example:
network.dns.response = trueIntegers
For example:
target.port = 443Floats: For UDM fields of the
floattype, enter a floating point value, such as3.1. You can also enter an integer, such as3, which is the equivalent of entering3.0.For example:
security_result.about.asset.vulnerabilities.cvss_base_score = 3.1orsecurity_result.about.asset.vulnerabilities.cvss_base_score = 3Regular expressions: (regular expression must be within slash (/) characters)
For example:
principal.ip = /10.*/For more information on regular expressions, see the regular expressions page.
Strings
For example (must use double quotes):
metadata.product_name = "Google Cloud VPC Flow Logs"
You can use the
nocaseoperator to search for any combination of upper and lowercase versions of a given string:principal.hostname != "http-server" nocaseprincipal.hostname = "JDoe" nocaseprincipal.hostname = /dns-server-[0-9]+/ nocase
Backslashes and double-quotes in strings need to be escaped using a backslash character. For example:
principal.process.file.full_path = "C:\\Program Files (x86)\\Google\\Application\\chrome.exe"target.process.command_line = "cmd.exe /c \"c:\\program files\\a.exe\""
You can use boolean expressions to further narrow possible range of data displayed. The following examples illustrate some types of supported boolean expressions (
AND,OR, andNOTboolean operators can be used):A AND BA OR B(A OR B) AND (B OR C) AND (C OR NOT D)
The following examples illustrate how the actual syntax might appear:
Login events to the finance server:
metadata.event_type = "USER_LOGIN" and target.hostname = "finance-svr"
Example of using a regular expression to search for the execution of the psexec.exe tool on Windows.
target.process.command_line = /\bpsexec(.exe)?\b/ nocase
Example of using the more than operator (>) to search for connections where more than 10 MB of data was sent.
metadata.event_type = "NETWORK_CONNECTION" and network.sent_bytes > 10000000
Example using multiple conditions to search for Winword launching cmd.exe or powershell.exe.
    metadata.event_type = "PROCESS_LAUNCH" and
    principal.process.file.full_path = /winword/ and
    (target.process.file.full_path = /cmd.exe/ or
    target.process.file.full_path = /powershell.exe/)
You can also use UDM Search to search for specific key-value pairs in the Additional and Label fields.
The Additional and Label fields are used as a customizable 'catch all' for event data that does not fit into a standard UDM field. Additional fields may contain multiple key-value pairs. Label fields may only contain a single key-value pair. However, each instance of the field contains only a single key and single value. The key needs to go inside the brackets and the value must be on the right hand side.
The following examples show how to search for events containing specified key-value pairs:
    additional.fields["pod_name"] = "kube-scheduler"
    metadata.ingestion_labels["MetadataKeyDeletion"] = "startup-script"
The following example shows how to use the AND operator with key-value pair searches:additional.fields["pod_name"] = "kube-scheduler" AND additional.fields["pod_name1"] = "kube-scheduler1"You can use the following syntax to search for all events that contain the specified key (regardless of what the value is)
additional.fields["pod_name"] != ""You can also use regular expressions and thenocaseoperator:additional.fields["pod_name"] = /br/ additional.fields["pod_name"] = bar nocaseYou can also use block and single-line comments.
The following example shows how to use a block comment:
    additional.fields["pod_name"] = "kube-scheduler"
    /*
    Block comments can span
    multiple lines.
    */
    AND additional.fields["pod_name1"] = "kube-scheduler1"
The following example shows how to use a single-line comment:
additional.fields["pod_name"] != "" // my single-line commentClick Run Search to run your UDM search and display the results.
Events are displayed on the UDM Search page in the Events timeline table. You can narrow the results further by adding additional UDM fields manually or by using the interface.
Search grouped fields
Grouped fields are aliases for groups of related UDM fields. You can use them to query multiple UDM fields at the same time without typing each field individually.
The following example shows how to enter a query to match the common UDM fields that might contain the specified IP address:
ip = "1.2.3.4"
You can match a grouped field using a regular expression and using the nocase operator. Reference lists are also supported. Grouped fields can also be used in combination with regular UDM fields as shown in the following example:
ip = "5.6.7.8" AND metadata.event_type = "NETWORK_CONNECTION"
Grouped fields have a separate section in Quick Filters.
Types of grouped UDM fields
You can search across all of the following grouped UDM fields:
| Grouped field name | Associated UDM fields |
| domain | about.administrative_domain about.asset.network_domain network.dns.questions.name network.dns_domain principal.administrative_domain principal.asset.network_domain target.administrative_domain target.asset.hostname target.asset.network_domain target.hostname |
| intermediary.user.email_addresses
network.email.from network.email.to principal.user.email_addresses security_result.about.user.email_addresses target.user.email_addresses |
|
| file_path | principal.file.full_path
principal.process.file.full_path principal.process.parent_process.file.full_path target.file.full_path target.process.file.full_path target.process.parent_process.file.full_path |
| hash | about.file.md5
about.file.sha1 about.file.sha256 principal.process.file.md5 principal.process.file.sha1 principal.process.file.sha256 security_result.about.file.sha256 target.file.md5 target.file.sha1 target.file.sha256 target.process.file.md5 target.process.file.sha1 target.process.file.sha256 |
| hostname | intermediary.hostname
observer.hostname principal.asset.hostname principal.hostname src.asset.hostname src.hostname target.asset.hostname target.hostname |
| ip | intermediary.ip
observer.ip principal.artifact.ip principal.asset.ip principal.ip src.artifact.ip src.asset.ip src.ip target.artifact.ip target.asset.ip target.ip |
| namespace | principal.namespace
src.namespace target.namespace |
| process_id | principal.process.parent_process.pid
principal.process.parent_process.product_specific_process_id principal.process.pid principal.process.product_specific_process_id target.process.parent_process.pid target.process.parent_process.product_specific_process_id target.process.pid target.process.product_specific_process_id |
| user | about.user.userid
observer.user.userid principal.user.user_display_name principal.user.userid principal.user.windows_sid src.user.userid target.user.user_display_name target.user.userid target.user.windows_sid |
Find a UDM field for search query
While writing a UDM Search query, you may not know which UDM field to include. UDM Lookup lets you quickly find a UDM field name that contains a text string in the name or that stores a specific string value. It is not intended to be used to search other data types, such as bytes, boolean, or numeric. You select one or more results returned by UDM Lookup as a starting point for a UDM Search query.
To use UDM Lookup, perform the following:
From the UDM Search page, enter a text string in the Look up UDM fields by value field, then click UDM Lookup.
In the UDM Lookup dialog, select one or more of the following options to specify the scope of data to search:
- UDM Fields: search for text in UDM field names, for example
network.dns.questions.nameorprincipal.ip. - Values: search for text in the values assigned to UDM fields, for example
dnsorgoogle.com.
- UDM Fields: search for text in UDM field names, for example
Enter or modify the string in the search field. As you type, search results appear in the dialog.
The results are slightly different when searching in UDM Fields versus Values. When searching for text in Values, the results appear as follows:
- If the string is found at the beginning or end of the value, it is highlighted in the result, along with the UDM field name and the time the log was ingested.
- If the text string is found elsewhere in the value, the result displays the UDM field name and the text Possible value match.

Search within values in UDM Lookup
- When searching for a text string in UDM field names, UDM Lookup returns an exact match found at any location in the name.

Search within UDM fields in UDM Lookup
In the results list, you can perform the following:
Click the name of a UDM field to see a description of that field.
Select one or more results by clicking the checkbox on the left of each UDM field name.
Click the Reset button to deselect all selected fields in the results list.
To append the selected results to the UDM Search field, click the Append to search button.
You can also copy the selected result using the Copy UDM button, and then close the UDM Lookup dialog and paste the search query string to the UDM Search field.
Chronicle converts the selected result to a UDM Search query string as the UDM field name or a name-value pair. If you append multiple results, each result is added to the end of an existing query in the UDM Search field using the
ORoperator.The appended query string is different depending on the type of match returned by UDM Lookup.
If the result matches a text string in a UDM field name, the full UDM field name is appended to the query. The following is an example:
principal.artifact.network.dhcp.client_hostnameIf the result matches a text string at the beginning or end of a value, the name-value pair contains the UDM field name and the complete value in the result. The following are examples:
metadata.log_type = "PCAP_DNS"network.dns.answers.name = "dns-A901F3j.hat.example.com"If the result includes the text Possible value match, the name-value pair contains the UDM field name and a regular expression containing the search term. The following is an example:
principal.process.file.full_path = /google/ NOCASE
Edit the UDM Search query to meet your use case. The query string that UDM Lookup generated is a starting point for writing a complete UDM Search query.
UDM Lookup behavior summary
This section provides more details about UDM Lookup capabilities.
- UDM Lookup searches data ingested after August 10, 2023. Data ingested before this is not searched. It returns results found in unenriched UDM fields. It does not return matches to enriched fields. For information about enriched versus unenriched fields, see View events in the Event Viewer.
- Searches using UDM Lookup are case-insensitive. The term
hostnamereturns the same result asHostName. - Hyphens (
-) and underscores (_) in a query text string are ignored when searching Values. The text stringdns-landdnslboth return the valuedns-l. When searching Values, UDM Lookup does not return matches in the following cases:
Matches in the following UDM fields: metadata.product_log_idnetwork.session_idsecurity_result.rule_idnetwork.parent_session_id
Matches in UDM fields with a full path that ends in one of the following values: .pid
For exampletarget.process.pid..asset_id
For exampleprincipal.asset_id..product_specific_process_id
For exampleprincipal.process.product_specific_process_id..resource.id
For exampleprincipal.resource.id.
When searching Values, UDM Lookup displays the message Possible value match in the result when a match is found in the following cases:
Matches in the following UDM fields: metadata.descriptionsecurity_result.descriptionsecurity_result.detection_fields.valuesecurity_result.summarynetwork.http.user_agent
Matches in fields with a full path that ends in one of the following values: .command_line
For exampleprincipal.process.command_line..file.full_path
For exampleprincipal.process.file.full_path..labels.value
For examplesrc.labels.value..registry.registry_key
For exampleprincipal.registry.registry_key..url
For exampleprincipal.url.
Matches in fields with a full path that begins with the following values: additional.fields.value.
For exampleadditional.fields.value.null_value.
View alerts in UDM Search
To view alerts, click the Alerts tab to the right of the Events tab in the upper right hand corner of the UDM Search page.
How alerts are surfaced
Chronicle evaluates the events returned in UDM search against events that exist for alerts in the customer environment. When a search query event matches an event present in an alert, it is displayed in the alert timeline and the resulting alert table.
Definition of events and alerts
An event is generated from a raw log source that is ingested into Chronicle and processed by Chronicle's ingestion and normalization process. Multiple events can be generated from a single raw log source record. An event represents a set of security-relevant data points that are generated from that raw log.
In a UDM search, an alert is defined as a YARA-L rule detection with alerting enabled. See running a rule against live data to learn more.
Other sources of data can be ingested into Chronicle as alerts, such as Crowdstrike Falcon Alerts. These alerts don't surface within UDM search unless they are processed by the Chronicle Detection Engine as a YARA-L rule.
Events that are associated with one or more alerts are marked with an Alert chip in the Event Timeline. If there are multiple alerts associated with the timeline, the chip displays the numbers of associated alerts.
The timeline displays the most recent 1,000 alerts retrieved from search results. When the 1,000 limit is reached, no more alerts are retrieved. To make sure you see all the results relevant to your search, refine your search with filters.
How to investigate an alert
To learn how to use Alert graph and Alert details to investigate an alert, follow the steps outlined in Investigate an alert.
Use reference lists in UDM searches
The process for applying reference lists in Rules can also be used in search. Up to seven lists may be included in a single search query. All types of reference lists (string, regular expression, CIDR) are supported.
You can create lists of any variable you want to track. For example, you could create a list of suspicious IP addresses:
// Field value exists in reference list
principal.ip IN %suspicious_ips
And you can use multiple lists by using AND or OR:
// multiple lists can be used with AND or OR
principal.ip IN %suspicious_ips AND
principal.hostname IN %suspicious_hostnames
Refine the search results
You can use the UDM search user interface to filter and refine results as an alternative to modifying the UDM search and re-running the search.
Timelines chart
The timelines chart provides a graphical representation of the number of events and alerts occurring each day that are being surfaced by the current UDM search. Events and alerts are displayed on the same timeline chart, which is available in both the Events and Alerts tab.
The width of each bar depends on the time interval searched. For example, each bar represents 10 minutes when the search spans 24 hours of data. This chart is updated dynamically as you modify the existing UDM search.
Time range adjustment
You can adjust the time range for the chart by moving the white slider controls left and right to adjust the time range and focus on the period of interest. As you adjust the time range, the UDM Fields and Values and Events tables are updated to reflect the current selection. You can also click a single bar on the graph to list just those events in that time period.
Once you have adjusted the time range, the Filtered Events and Query Events checkboxes will appear, enabling you to further limit the types of events displayed.

Figure 4. Events timelines chart with time range controls
Modify the UDM Search with Quick Filters
Using Quick Filters, you can further narrow your UDM search. You can either scroll through the list of UDM fields or search for specific UDM fields or values using the Search field. The UDM fields listed here are associated with the existing lists of events generated by your UDM search. Each UDM field includes the number of events within your current UDM search that also include this piece of data. The list of UDM fields display the total unique number of values within a field. This feature lets you hunt for particular types of log data that might be of further interest.
The UDM fields are listed in the following order:
- Fields with the highest event counts to the lowest event counts.
- Fields with only 1 value are always last.
- Fields with the exact same event count total are ordered alphabetically from A through Z.

Figure 5. Quick Filters
Modify a Quick Filter
If you select a UDM field value in the Quick Filters list and click the menu icon, you are given the option to either Show only events which also include that UDM field value or to Filter out that UDM field value. If the UDM field stores integer values (example: target.port) you will also see options to filter by <,>,<=,>=. Filter options shorten the list of displayed events.
You can also pin fields (using the push pin icon) in Quick Filter to save them as a favorite. They appear at the top of the Quick Filters list.

Figure 6. Example: Select Show Only
These additional UDM filters are also added to the filter events field. The filter events field helps you to keep track of the additional UDM fields you have added to the UDM search. You can also quickly remove these additional UDM fields as needed.

Figure 7. Filter events
If you click the Filter events menu icon or Add Filter to the left, a window opens enabling you to select additional UDM fields.

Figure 8. Filter events window
When you click APPLY to Search and Run, the UDM fields are added to the Filter events field and the displayed events are filtered based on those additional filters. You can also click Apply to Search and Run to add these to the main UDM Search field at the top of the page. The search is automatically run again using the same date and time parameters. Google recommends narrowing your search down as much as possible before clicking APPLY to Search and Run. This helps to improve accuracy and reduces search times.
View events in the Events table
All of these filters and controls will update the list of events displayed in the Events table. Click any of the listed events to open the Log Viewer where you can examine the raw log and the UDM record for that event. If you click the timestamp for an event, you can also navigate to the associated Asset, IP address, Domain, Hash, or User view. You can also use the Search field at the top of the table to find a specific event.
View alerts in the Alerts table
You can view alerts by clicking the Alerts tab on the right-hand side of the Events tab. You can use Quick Filters to sort alerts by:
- Case
- Name
- Priority
- Severity
- Status
- Verdict
This helps you to focus in on the alerts that are most important to you.
Alerts are displayed on the same timeframe as the events are in the Events tab. This helps you to see the connection between events and alerts.
If you want to learn more about a specific alert, click the alert, and an individual alert detail page opens up that contains more in-depth information about that alert.
View events in the Event Viewer
If you hold the pointer over an event in the Events table, the open event viewer icon appears on the right side of the highlighted event. Click it to open the Event Viewer.
The Raw Log window displays the original raw sign in any of the following formats:
- Raw
- JSON
- XML
- CSV
- Hex/ASCII
The UDM window displays the structured UDM record. You can hold the pointer over any of the UDM fields to view the UDM definition. By selecting the checkbox for the UDM fields, you get additional options:
You can copy the UDM record. Select one or more UDM fields and then select the Copy UDM option from the View Actions drop down menu. The UDM fields and UDM values are copied to the system clipboard.
You can add the UDM fields as columns in the Events table by selecting the Add Columns option from the View Actions drop down menu.
Each UDM field is labeled with an icon indicating whether the field contains enriched or unenriched data. The icon labels are the following:
- U: Unenriched fields contain values populated during the normalization process using data from the original raw log.
E: Enriched fields contain values that Chronicle populates to provide additional context about artifacts in a customer environment. For more information, see How Chronicle enriches event and entity data.

Figure 9. UDM fields in Event Viewer
Use the Columns option for UDM Search
Use the Columns option to adjust which columns of information are displayed in the Events table. The Columns menu is displayed. The options available vary depending on the types of events returned by the UDM Search.
You can optionally save the set of columns you have selected here by clicking Save. Give the set of selected columns a name and click Save again. You can load a set of saved columns by clicking Load and selecting the set of saved columns from the list.
You can also download the displayed events by clicking the three dot menu and selecting Download as CSV. This will download all of the search results up to one million events. The user interface will indicate the number of events it will download.

Figure 10. UDM Search columns
Use the Pivot Table to analyze events
The Pivot Table lets you analyze events using expressions and functions against the results from the UDM Search.
Complete the following steps to open and configure the Pivot Table:
Run a UDM search.
Click the Pivot tab to open the Pivot Table.
Specify a Group By value to group the events by a specific UDM field. You can display the results using the default capitalization or using lowercase only by selecting lowercase from the menu. This option is only available for string fields. You can specify up to 5 Group By values by clicking Add Field.
If your Group By value is one of the hostname fields, you will have additional Transform options:
- Top N-Level Domain—Pick which level of the domain to display.
For example, using a value of 1 displays just the top level domain
(such as
com,gov, oredu). Using a value of 3 displays the next two levels of the domain names (such asgoogle.co.uk). - Get Registered Domain—Displays just the registered domain
name (such as
google.com,nytimes.com, andyoutube.com).
If your Group By value is one of the IP fields, you have additional Transform options:
- (IP) CIDR Prefix length in bits—You can specify 1 through 32 for IPv4 addresses. For IPv6 addresses, you can specify values up to 128.
If your Group By value includes a timestamp, you will have additional Transform options:
- (Time) Resolution in milliseconds
- (Time) Resolution in seconds
- (Time) Resolution in minutes
- (Time) Resolution in hours
- (Time) Resolution in days
- Top N-Level Domain—Pick which level of the domain to display.
For example, using a value of 1 displays just the top level domain
(such as
Specify a Value for your Pivot from the list of Fields in your results. You can specify up to 5 values. After you specify a Field, you must select a Summarize option. You can summarize by the following options:
- sum
- count
- count distinct
- average
- stddev
- min
- max
Specify a value of Event Count to simply return the number of events identified for this particular UDM search and Pivot Table.
The Summarize options are not universally compatible with the Group By fields. For example, the sum, average, stddev, min, and max options can only be applied to numeric fields. If you attempt to associate an incompatible Summarize option with a Group By field, you will receive an error message.
Specify one or more UDM fields and select one or more sorts by using the Order By option.
Click Apply when you are ready. The results are displayed in the Pivot Table.
(Optional) To download the pivot table, click and select Download as CSV. If you did not select a pivot, this option is disabled.
Run a search in Quick Searches
Click Quick Searches to open the Quick Searches window. This window displays your saved searches and search history.
Click any of the searches listed to load it into the UDM search field.
Click Run Search when you are ready.
The searches listed are saved to your Chronicle account. If you need to modify any of your saved searches (for example, rename an existing search), delete saved searches, or delete searches from your search history, open the Search Manager by clicking See All Searches.
Saved searches and search history overview
Use the Search Manager to retrieve saved searches and view your search history by clicking Search Manager. Saved searches and search history are both stored with your Chronicle account. Saved searches and search history are only viewable and accessible by the individual user unless you use the Share a search feature to share your search with your organization. Select a saved search to view additional information, including the title and description.
Save a search
To save a search:
From the UDM Search page, click Save to save your UDM search for later. This opens the Search Manager. Google recommends giving your saved search a meaningful name and a plain text description of what you are searching for. You can also create a new UDM search from within the Search Manager by clicking . The standard UDM editing and completion tools are also available here.
(Optional) Specify placeholder variables in the format
$<variable name>using the same format as is used for variables in YARA-L. If you add a variable to a UDM search, you must also include a prompt to help the user to understand what information they need to enter before they run the search. All variables must be populated with values prior to a search being run.For example, you could add
metadata.vendor_name = $vendor_nameto your UDM search. For$vendor_name, you need to add a prompt for future users, such as "Enter the name of the vendor for your search". Each time a user loads this search in the future, they will be prompted to enter the vendor name prior to being able to run the search.Click Save Edits when you have finished.
To view saved searches, click Search Manager and then click the Saved tab.
Retrieve a saved search
To retrieve and run a saved search:
In the Search Manager, click the Saved tab.
Select a saved search from the list. These saved searches are saved to your Chronicle account. You can delete a search by clicking and selecting Delete Search.
You can change the name of the search and the description. Click Save Edits when you have finished.
Click Load Search. The search is loaded into the main UDM search field.
Click Run Search to see the events associated with this search.
Retrieve a search from your search history
To retrieve and run a search from your search history:
In the Search Manager, click History.
Select a search from your search history. Your search history is saved to your Chronicle account. You can delete a search by clicking
Click Load Search. The search is loaded into the main UDM search field.
Click Run Search to see the events associated with this search.
Clear, disable, or enable search history
To clear, disable, or enable search history:
In Search Manager, click the History tab.
Click
Select Clear History to clear the search history.
Click Disable History to disable search history. You have the option to either:
Opt-Out Only—Disable search history.
Opt-Out and Clear—Disable search history and delete the saved search history.
If you have previously disabled search history, you can enable it again by clicking Enable Search History.
Click Close to exit Search Manager.
Share a search
Shared searches allow you to share searches with the rest of your team. In the Saved tab, you can share or delete searches. You can also filter your searches by clicking the filter icon next to the search bar and sort searches by Show all, Chronicle defined, Authored by Me, or Shared.
You cannot edit a shared search that is not your own.
- Click Saved.
- Click the search you want to share.
- Click on the right hand side of the search. A dialog with the option to share your search appears.
- Click Share With Your Organization.
- A dialog appears that says Sharing your search will be visible to people in your organization. Are you sure you want to share? Click Share.
If you want the search to only be visible to you, click and click Stop Sharing. If you stop sharing, only you can use this search.
What's next
For information about how to use context-enriched data in UDM Search, see Use context-enriched data in UDM Search.