Picture this: How the U.S. Forest Service uses Google Cloud tools to analyze a changing planet
Lesta Brady
Director, Federal Civilian Sales
For 117 years, the U.S. Department of Agriculture’s Forest Service has been a steward of America's forests, grasslands, and waterways. It directly manages 193 million acres and supports sustainable management on a total of 500 million acres of private, state, and tribal lands. Its impact reaches far beyond even that, offering its research and learning freely to the world.
At Google, we’re big admirers of the Forest Service’s mission. So we were thrilled to learn in 2011 that its scientists were using Google Earth Engine, our planetary-scale platform for Earth Science data and analysis, to aid its research, understanding, and effectiveness. In the years since, Google has worked with the Forest Service to meet its unique requirements for visual information about the planet. Using both historical and current data, the Forest Service built new products, workflows, and tools that help more effectively and sustainably manage our natural resources. The Forest Service also uses Earth Engine and Google Cloud to study the effects of climate change, forest fires, insects and disease, helping them create new insights and strategies.
Besides gaining newfound depths of insight, the Forest Service has also sped up its research dramatically, enabling everyone to do more. Using Google Cloud and Earth Engine, the Forest Service reduced the time it took to analyze 10 years worth of land-cover changes from three months to just one hour, using just 100 lines of code. The agency built new models for coping with change, then mapped these changes over time, in its Landscape Change Monitoring System (LCMS) project.
Emergency responders can now work better on new threats that arise after wildfires, hurricanes, and other natural disasters. Forest health specialists can detect and monitor the impacts of invasive insects, diseases, and drought. More Forest Service personnel can use new tools and products within Earth Engine, thanks to numerous training and outreach sessions within the Forest Service.
Researchers elsewhere also benefited when the Forest Service created new toolkits, and posted them to GitHub for public use. For example, there’s geeViz, a repository of Google Earth Engine Python code modules useful for general data processing, analysis, and visualization.
This is only the start. Recently, the Forest Service started using Google Cloud’s processing and analysis tools for projects like California’s Wildfire and Forest Resilience Action Plan. Forest Service researchers also use Google Cloud to better understand ecological conditions across landscapes in projects like Fuelcast, which provides actionable intelligence for rangeland managers, fire specialists, and growers, and the Scenario Investment Planning Platform for modeling local and national land management scenarios.
The Forest Service is a pioneer in building technology to help us better understand and care for our planet. With more frequent imaging, rich satellite data sets, and sophisticated database and computation systems, we can view and model the Earth as a large-scale dynamic system.
We are honored and excited to respond to the unique set of requirements of the scientists, engineers, rangers, and firefighters of the USFS, and look forward to years of learning about — and better caring for — our most precious resources.
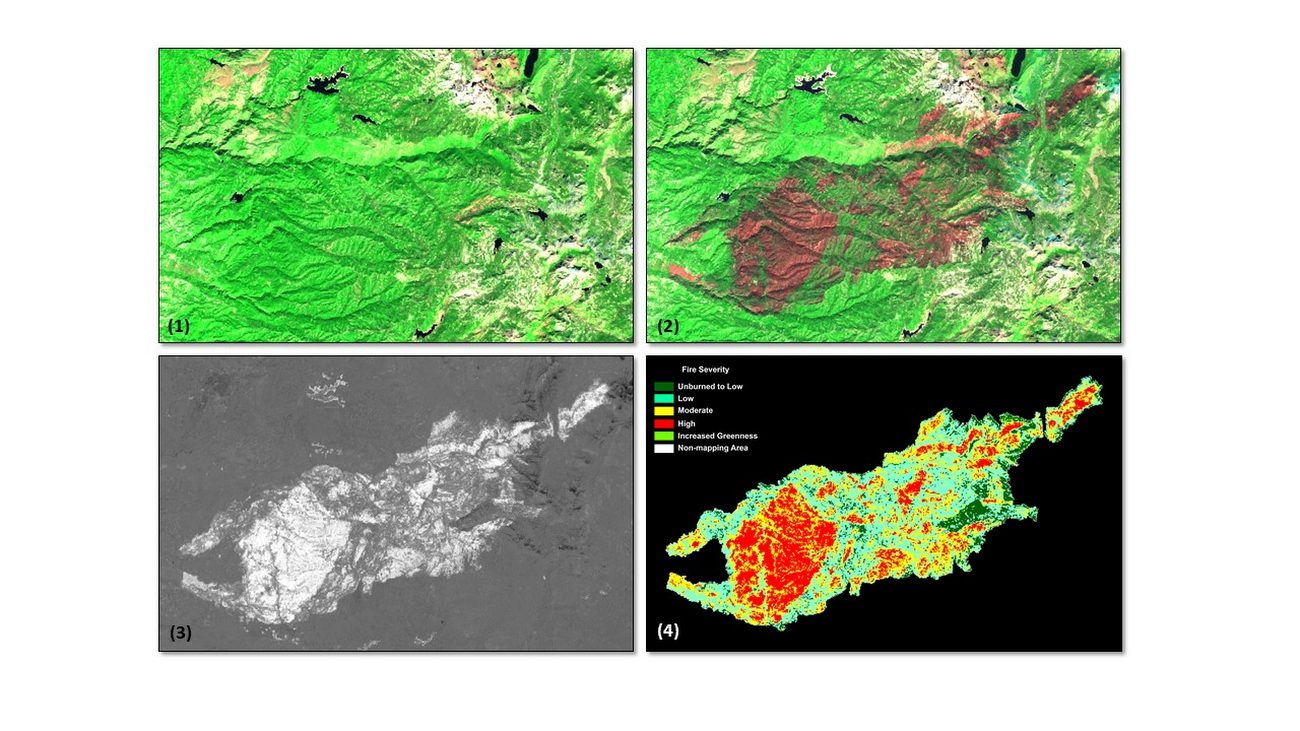
*Image 1: The USDA Forest Service (USFS) Geospatial Technology and Applications Center (GTAC) uses science-based remote sensing methods to characterize vegetation and soil condition after wildland fire events. The results are used to facilitate emergency assessments to support hazard mitigation, to inform post-fire restoration planning, and to support the monitoring of national fire policy effectiveness. GTAC currently conducts these mapping efforts using long-established geospatial workflows. However, GTAC has adapted its post-fire mapping and assessment workflows to work within Google Earth Engine (GEE) to accommodate the needs of other users in the USFS. The spatially and temporally comprehensive coverage of moderate resolution multispectral data sources (e.g., Landsat, Sentinel 2) and analytical power provided by GEE allows users to create geospatial burn severity products quickly and easily. Box 1 shows a pre-fire Sentinel-2 false color composite image. Box 2 shows a post-fire Sentinel-2 false color composite image with the fire scar apparent in reddish brown. Box 3 shows a differenced Normalized Burn Ratio (dNBR) image showing the change between the pre- and post-fire images in Boxes 1 and 2. Box 4 shows a thresholded dNBR image of the burned area with four classes of burn severity (unburned to high severity), which is the final output delivered to forest managers.
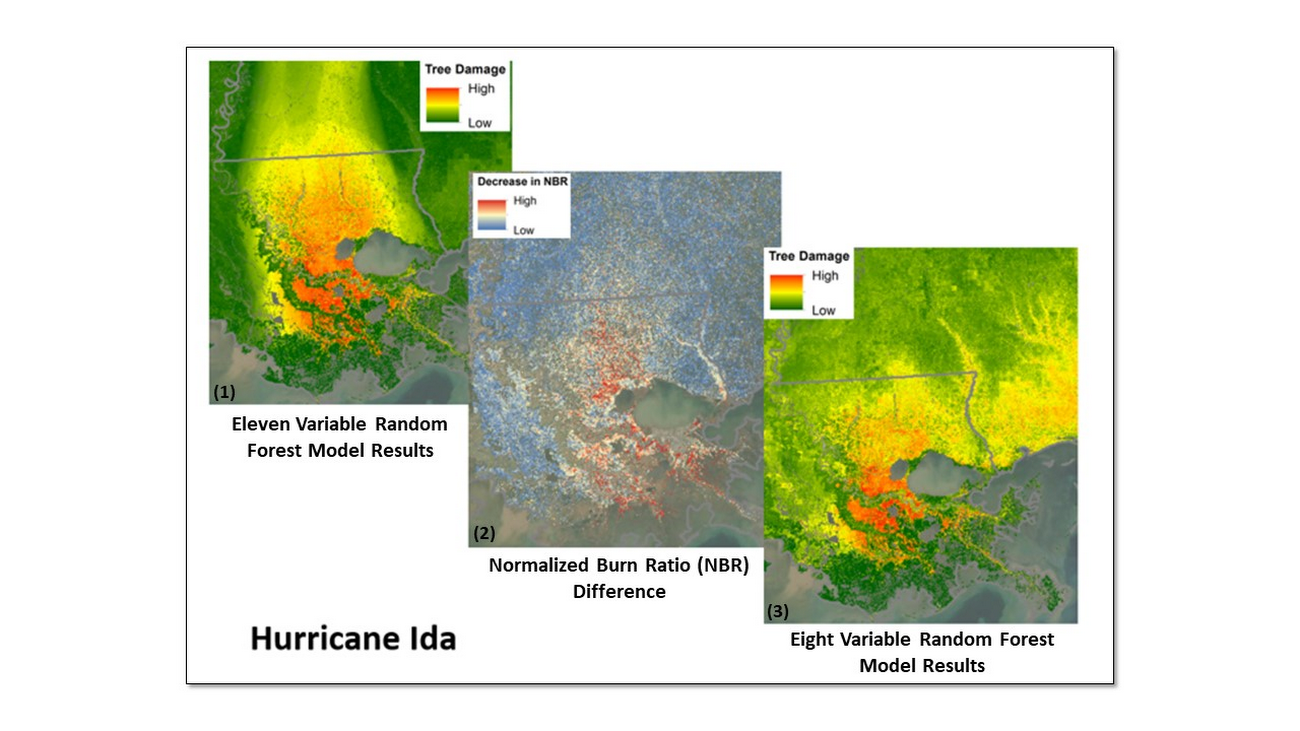
*Image 2: Leveraging Google Earth Engine (GEE), the USDA Forest Service (USFS) Geospatial Technology and Applications Center (GTAC) and USFS Region 8, developed the Tree Structure Damage Impact Predictive (TreeS-DIP) modeling approach to predict wind damage to trees resulting from large hurricane events and produce spatial products across the landscape. TreeS-DIP results become available within 48 hours following landfall of a large storm event to allow allocation of ground resources to the field for strategic planning and management. Boxes 1 and 3 above show TreeS-DIP modeled outputs with varying data inputs and parameters. Box 2 shows changes in greenness (Normalized Burn Ratio; NBR) that was measured with GEE during the recovery from Hurricane Ida and is shown as a visual comparison to the rapidly available products from TreeS-DIP.
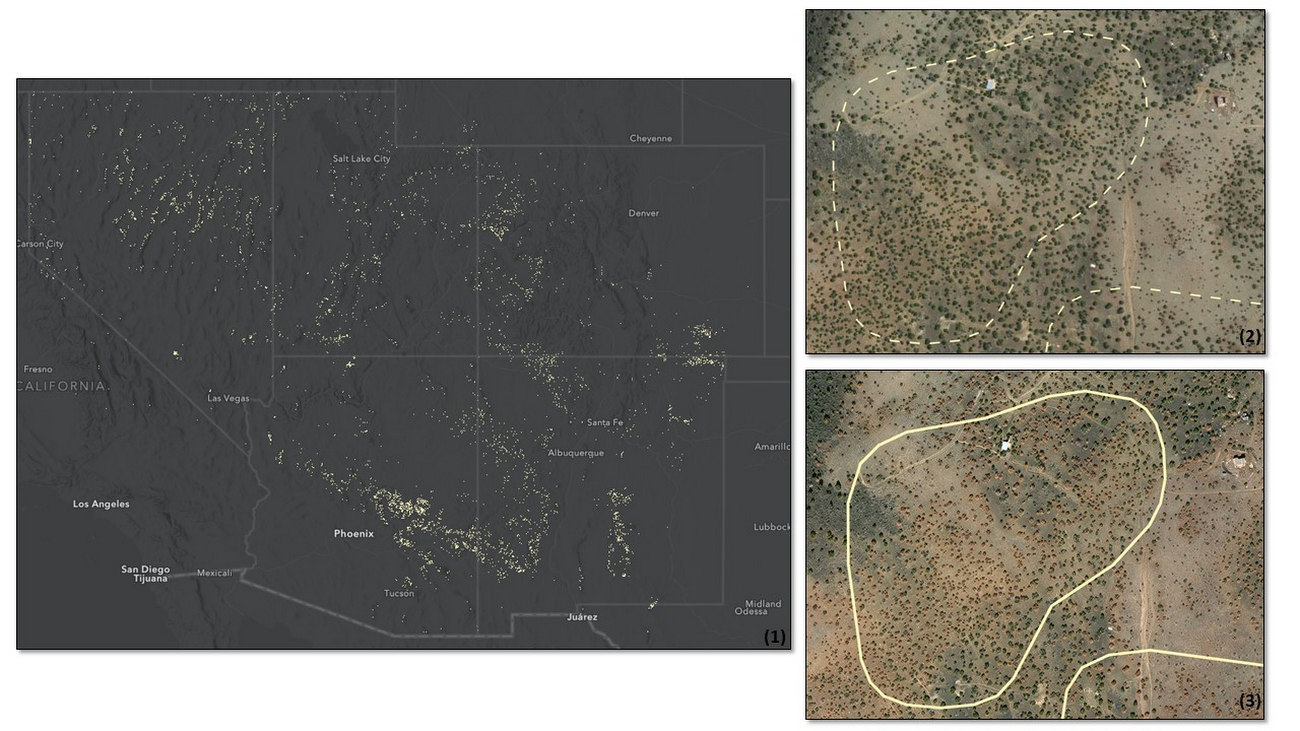
*Image 3: Severe drought conditions across the American West prompted concern about the health and status of pinyon-juniper woodlands, a vast and unique ecosystem. In a cooperative project between the USDA Forest Service (USFS) Geospatial Technology and Applications Center (GTAC) and Forest Health Protection (FHP), Google Earth Engine (GEE) was used to map pinyon pine and juniper mortality across 10 Western US States. The outputs are now being used to plan for future work including on-the-ground efforts, high-resolution imagery acquisitions, aerial surveys, in-depth mortality modeling, and planning for 2022 field season work.
Box 1 contains remote sensing change detection outputs (in white) generated with GEE, showing pinyon-juniper decline across the Southwestern US. Box 2 shows NAIP imagery from 2017 with, with box 3 showing NAIP imagery from 2021. NAIP imagery from these years shows trees changing from healthy and green in 2017 to brown and dying in 2021. In addition, box 2 and box 3 show change detection outputs from Box 1 for a location outside of Flagstaff, AZ converted to polygons (in white). The polygon in box 2 is displayed as a dashed line to serve as a reference, while the solid line in box 3 shows the measured change in 2021. Converting rasters to polygons allows the data to be easily used on tablet computers, as well as the ability to add information and photographs from field visits.