Shining a light on your costs: New billing features from Google Cloud
Stephen Elliott
Product Manager, Google
One of our primary goals at Google Cloud Platform (GCP) is to help you focus on building value for your business while we take care of the infrastructure. But as you focus on those value-adding activities, it’s still important to understand the costs of what you’re building so you can optimize them. One of the biggest steps you can take is to shine a light on those costs through good cost hygiene and awareness. Over the last few months, we’ve added a number of features to help you adopt cost management best practices.
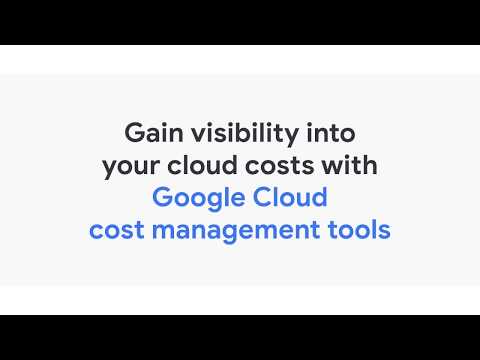
You can see some of the new features we’ve added to Billing reports in this video:
You can also get a more comprehensive look into what we’ve released below along with recommendations for how to apply good cost hygiene and awareness within your organization.
Create cost accountability through visibility
The biggest step you can take is to simply make your costs visible. We offer several features in GCP that make this easy to do: our new Billing account overview page, which gives you an at-a-glance summary of your charges to date, estimated end-of-month charges, and any credit balances; Billing reports, which are dynamic, built-in cost reports available in the Google Cloud console; and Billing export, which exports detailed cost data to a BigQuery dataset of your choice for further analysis. You can set permissions on both Billing reports and export to make sure people in your organization have access to the right cost views, and you can use exported data to run custom queries and dashboards (such as via Data Studio) to dive deeper into your cloud usage and costs.
These tools do more than create a culture of cost ownership. In the cloud, where performance bugs can often manifest as cost anomalies, improving cost visibility and accountability can go a long way to improving general operations. Customers tell us that using these tools helps them make better technology decisions and improves their cost efficiency:
“Giving developers access to view the costs for their GCP projects helps them be more aligned with the business and its objectives,” says Dale Birtch, site reliability engineer at Vendasta. “Not only do we get better engineering practices, we get a more stable environment long-term, and it costs us less to run.”
Organize costs the way you manage work
The next big step is to organize costs the way you manage work. There are three main ways to organize your GCP costs: by product hierarchy, by project hierarchy, and by label. The default way to organize costs is by product hierarchy. Anytime you use a GCP resource, whether it is a Compute Engine VM or a Cloud Pub/Sub message, its costs are reported by stock-keeping unit (SKU). We organize these SKUs under GCP products, helping you get a higher-level view of your usage. For example, N1 standard instance SKUs roll up to the Compute Engine product. As part of GCE’s resource-based pricing launch, we added more metadata to your Billing export BigQuery datasets, so you can see the usage location (if applicable) and, for Compute Engine VMs, the machine specification, core and memory footprint of your instances via system labels. We have also added usage location to Billing reports. This helps you quickly see which geography, region or multi-region is driving your costs.
The next way to organize costs is by the project hierarchy. Almost every resource is contained by a project, meaning that most resource access and costs can be managed by project. Organizations and folders give structure to your GCP environments and help you organize your projects and standardize permissions and policies across groups of projects. For example, a folder might represent the “production” environment with strict access requirements set at the folder level. You can also now see a project’s folder path in Billing export to BigQuery to make it easy to query and create custom dashboards for folder costs.
The final way to organize costs is by label. In particular, resource labels can be applied to resources to help you distinguish between usage within or across projects. For example, if a project contains all of the resources for an application, one set of labels could represent resources for components of that application (i.e., front end, back end), and another set of labels could represent common costs across applications (i.e., security, testing, development). With these new features, labels are available in Billing export to BigQuery, and we plan to add the ability to filter and group costs by labels in Billing reports soon.
If you are a Google Kubernetes Engine (GKE) user, we also recently launched GKE usage metering. GKE usage metering exports usage breakdowns by Kubernetes namespace and Kubernetes labels to BigQuery in a way that can be joined with Billing export data to estimate cost breakdowns for teams and workloads that are sharing a cluster.
Understand your net costs
Another big step you can take toward cost visibility is to understand your fully loaded or net costs. We’ve made two improvements to make your net costs easier to understand.
First, Billing reports now let you see costs by invoice month, including taxes and other invoice-level charges. We also added the ability to filter usage-based credits by type so that you can understand what your costs would be without free trial, promotional, or other usage-based credits, such as sustained use discounts and committed use discounts
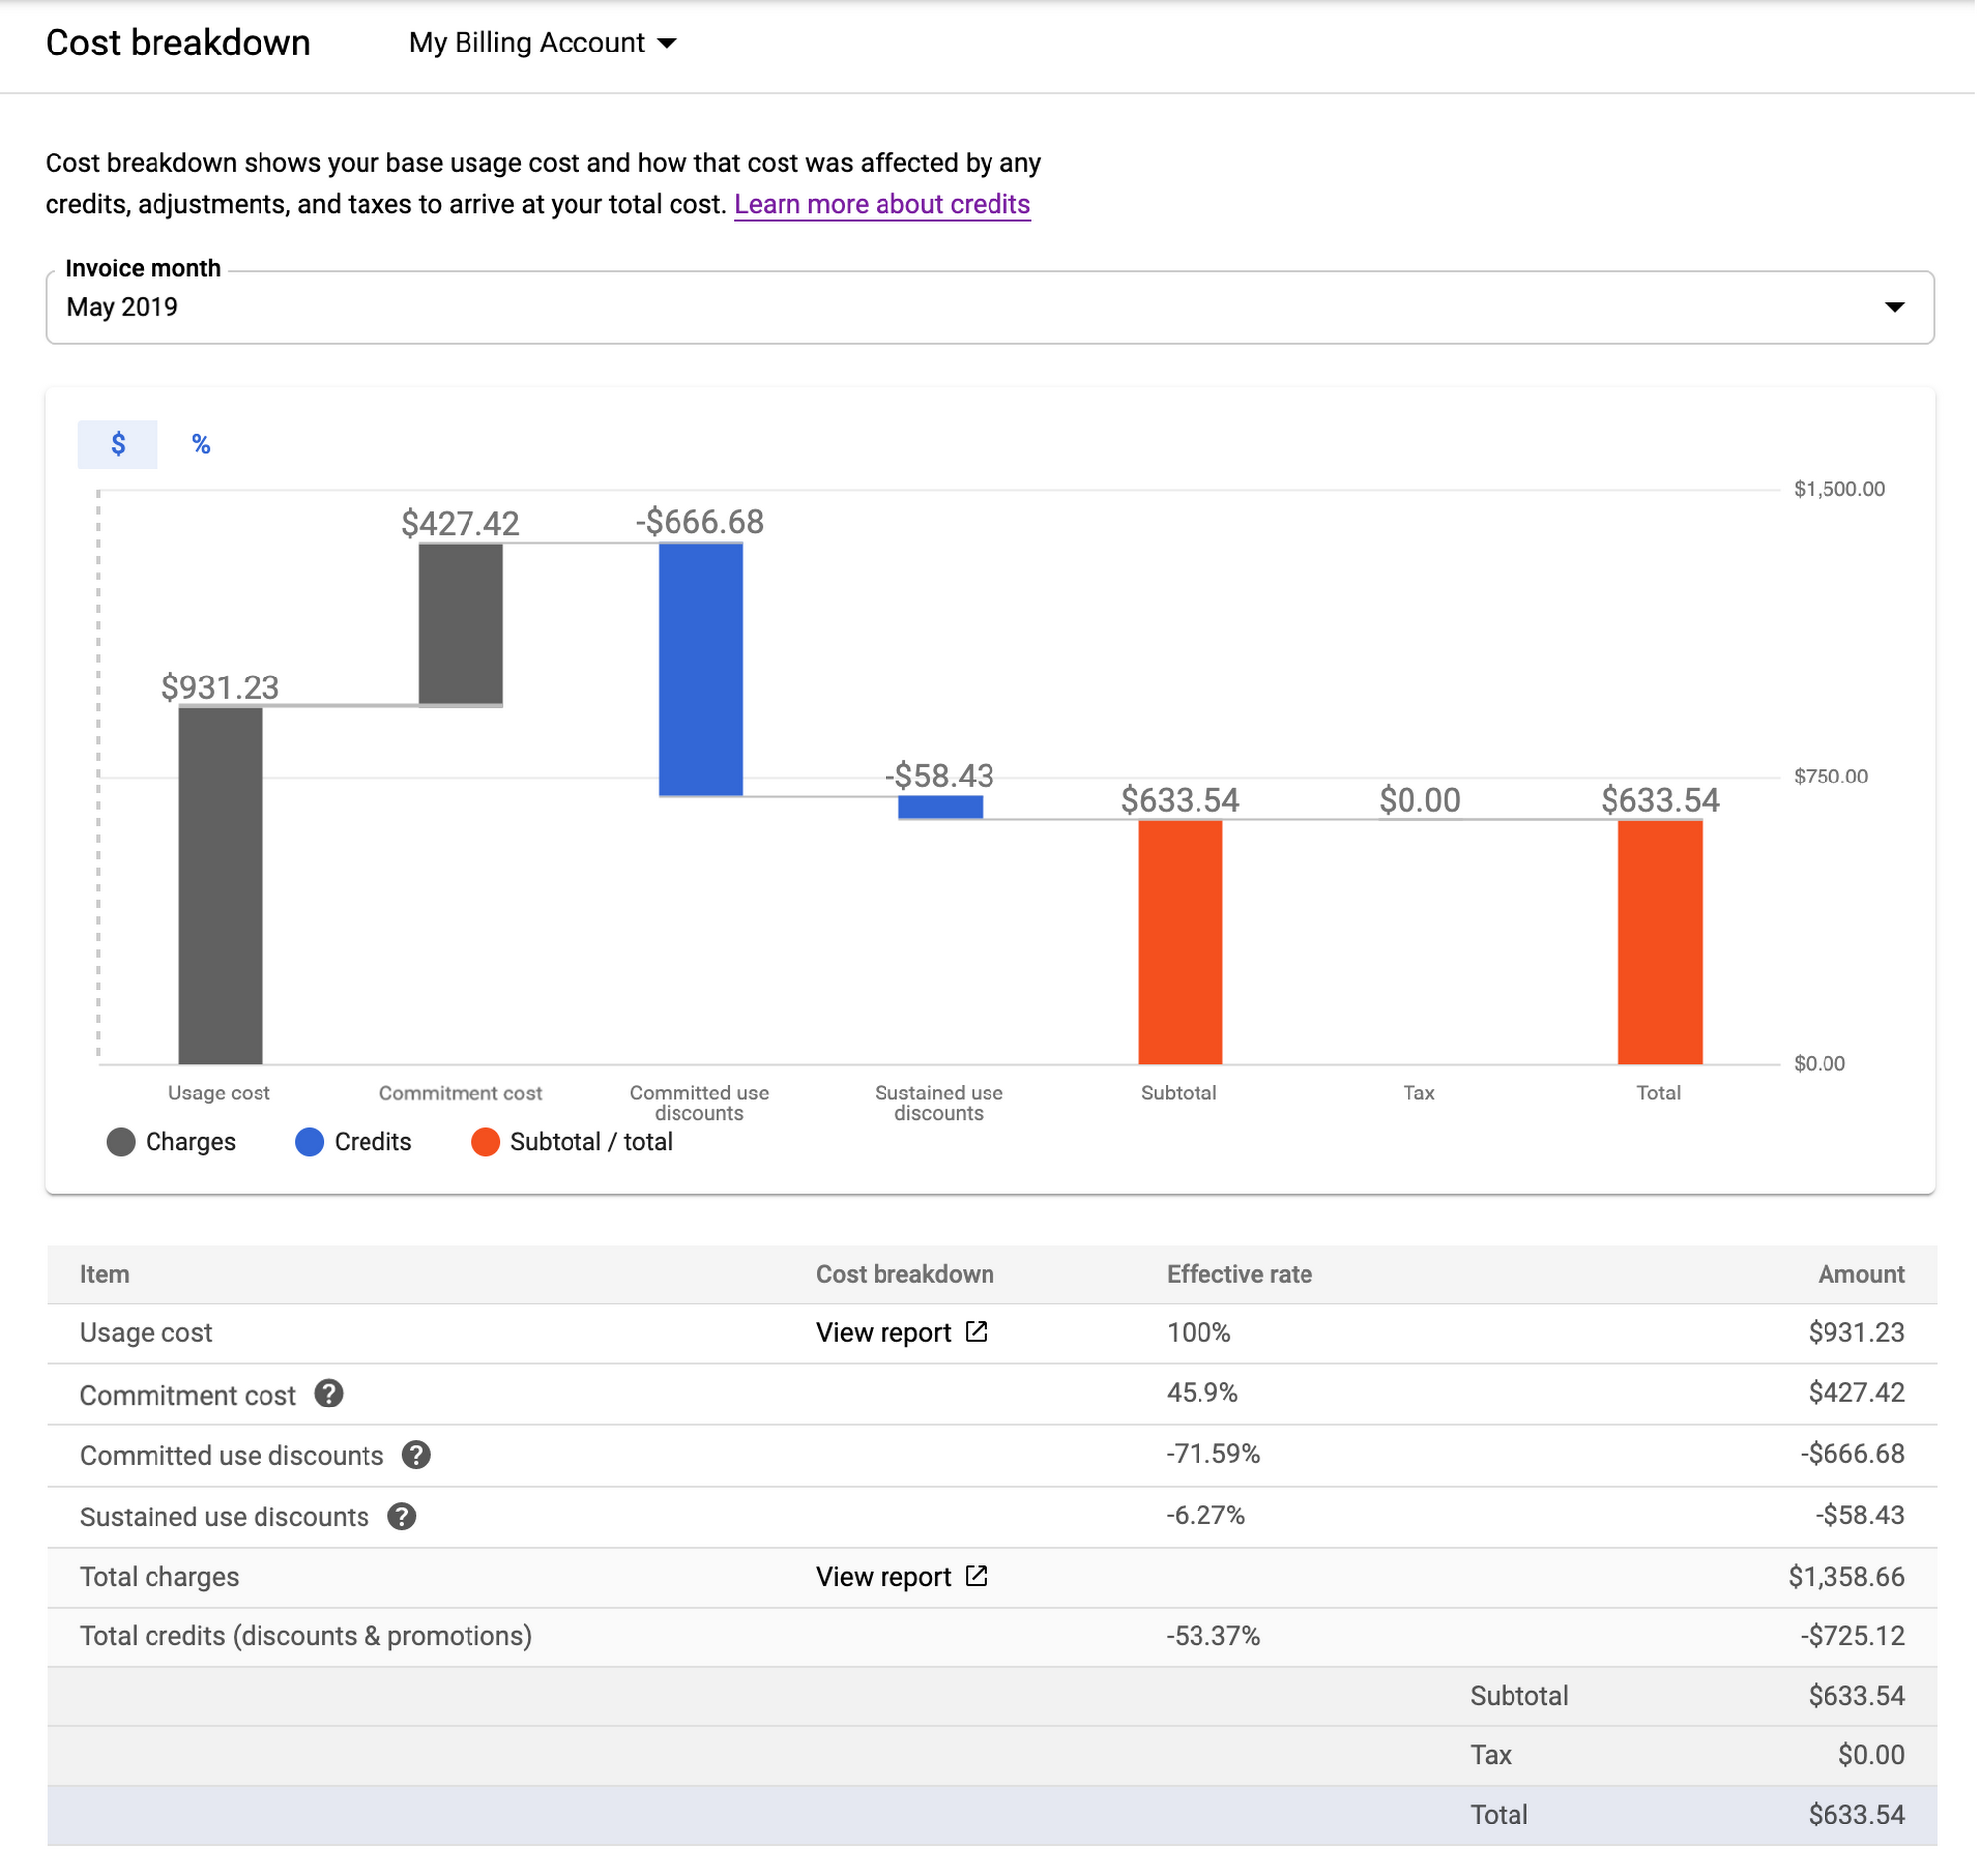
Second, we’ve added a new cost breakdown report that lets you see how we arrive at your final invoice amount from your original usage costs. For example, if you use Compute Engine, the cost breakdown chart will show you how much your VM costs would have been before any committed use discounts, sustained use discounts, promotional credits and/or free trial credits, and visualize the net effect of those discounts. This gives you a simple at-a-glance overview of your GCP costs and savings, as shown here:
Plans might change, but planning is essential
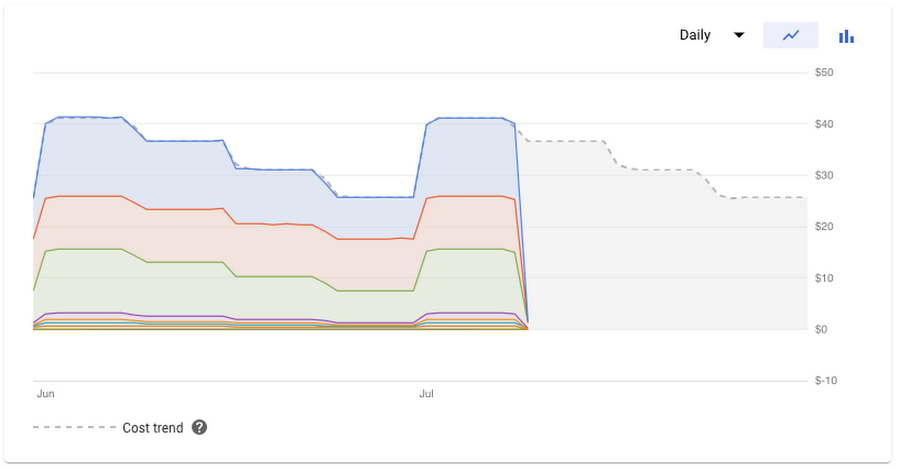
Finally, an important part of cost management is to understand what your costs should be (your plan) and when costs have deviated from your plan. Last year, we added a cost forecast feature to Billing reports to show you a smart forecast based on your cost history and selected filters. We’ve improved our forecasting algorithm so that it captures monthly cyclicality. Now, instead of a simple linear projection, you can see a forecast that matches how cycles within a month affect your costs, like this:
In addition, with the higher accuracy forecast, we have also launched the ability to set alerts based on forecasted cost. So rather than relying simply on alerts when you exceed a budget threshold (e.g., $1,000 per month for a specific project), you can now also set an alert—via email or Cloud Pub/Sub—so that you’re notified when you are forecasted to exceed that budget for the month.
Turn on the electric light
Cloud customers often tell us that they feel left in the dark about the cost of what their developers are building. Developer velocity has never been faster, but administrators and managers are simultaneously struggling to govern their costs. A quote by Justice Louis Brandeis comes to mind: “Sunlight is said to be the best of disinfectants; electric light the most efficient policeman." Every corner of your cloud should be well-lit so you can easily understand your cloud costs. We’re committed to delivering cost management tools that help you illuminate your business and grow confidently in the cloud.
To learn more about what’s next for Google Cloud cost management, check out the following:
Videos: Recent Next ‘19 session recordings and best practices webinars
Hands-on lab: Understanding and analyzing your costs with Billing reports