Scalable electronic trading on Google Cloud: A business case with BidFX
Stathis Onasoglou
CFA - Fintech Principal, Google Cloud
Aaron Walters
Exchange and Ecosystem Strategy, Google Cloud
Imagine you just got the restaurant bill and you can see only one number: the total cost, tip included. You have a sense you overpaid. Also what about this significant delay with service? Is it reflected in the tip? It’s difficult to answer these questions if you don't have visibility into a breakdown of the costs.
This is very similar to the situation many market participants find themselves in the electronic trading industry. Transaction Cost Analysis (“TCA”) has been focusing for many years in the total “bill” of a trade or some components of it (e.g. bid-ask spreads), but hasn’t been providing visibility into other aspects such as market impact (e.g. did our trading volume impact the prices?), delay costs (also called “slippage”, remember this service delay at the restaurant?) and opportunity costs (maybe I should go for my second favorite dish if I know I have to wait too long for my first choice).
BidFX, a global FX multi-dealer platform collaborating with Google Cloud is trying to change this. “For a long time, everyone involved in the execution of financial assets has wanted to know how badly/well they’re trading. This has been done often in a non-differentiating way and is called TCA, whether to meet regulatory requirements or to add value by improving decision making. What we’re doing with our latest analytics is breaking that down even further to get to the real source of the costs being incurred. These tools work in facilitating a good marketplace for all participants.” says Daniel Chambers, Head of Data & Analytics at BidFX.
Working with Google Cloud, BidFX has been able to develop and deploy a new product called Liquidity Provision Analytics (“LPA”), launching to production within roughly six months, to solve exactly this industry challenge in an innovative way. LPA will be offering features such as skew detection for liquidity providers, execution time optimization, pricing comparison, top of book analysis and feedback to counterparties.
“For BidFX this is an important product as it places BidFX ahead of the curve in its industry. It is a type of analytics that many users within the industry will not currently be doing, but will add a lot of value to our clients.” mentions Chambers.
Leveraging Google Cloud’s data and analytics capabilities to tackle a complex business problem
The challenge: storing and serving FX time-series data in real time
BidFX’s LPA needed to store FX tick data and derived analytics at various resolutions (e.g. 1m, 1h, 1d). Each price data feed is defined by several fields:
a client ID,
a timestamp,
the resolution (e.g. 1 min),
the deal type (e.g. forward, swap etc.),
the currency pair (e.g. GBPUSD),
the liquidity provider (i.e. the origin of the quote),
a tenor (i.e. the settlement date) and,
the quantity to be traded.
Any results of slicing and dicing, aggregating or probing the analytics derived from these data feeds are served to BidFX’s clients globally through a front-end application. The main latency requirement of the platform was to be able to serve end-clients under 500 ms.
How did BidFX solve the challenge?
Building on Cloud Bigtable, Google Cloud’s fully managed, enterprise-grade NoSQL database service, BidFX’s LPA product can auto-scale seamlessly with no administrative or maintenance effort. The solution was able to achieve a back-end to front-end latency of ~35ms @50th and ~340ms @99th in the same geographic region, with availability of 99.999%.
““Leveraging the elasticity and operational efficiencies of Google Cloud allows us to reduce our time to market, delivering innovative, web-scale products in a lean manner while being confident we don't encounter bottlenecks that require re-architecting at critical moments.”, says Maksim Korneichik, Engineering Manager at BidFX.
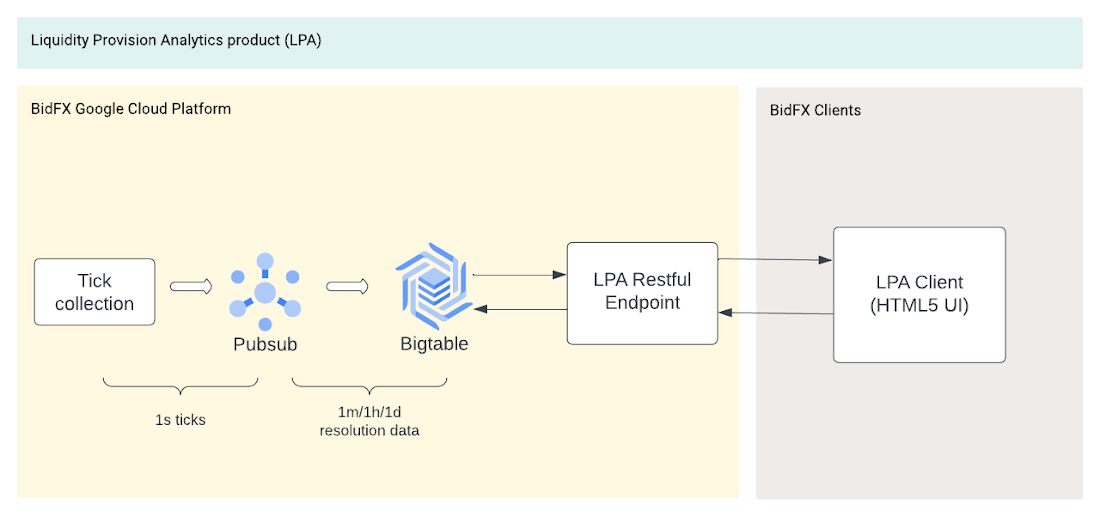
Figure 1: The LPA high-level architecture
Bigtable in a nutshell
Bigtable is essentially a sparsely populated table that can scale to billions of rows and thousands of columns, enabling the storage of terabytes or even petabytes of data. Bigtable separates architecturally compute (i.e. nodes) and storage (i.e. “SSTable” files in Colossus, Google Cloud’s distributed file system), to achieve up to single-digit millisecond latency (within a region), essentially limitless scale, and 99.999% availability, while scaling directly proportional to the number of machines added to the cluster. To achieve this performance, the schema needs to be designed and optimized to the patterns of usage.
LPA schema and benchmarking considerations for BidFX
Bigtable is a key/value store and each table has only one index, the row key, with rows sorted lexicographically by row key. Choosing and structuring the key is critical in attaining the best read and write performance and to avoid hotspots. For time-series data two design patterns are useful: a) short and wide tables, where rows are time buckets and new events are added as new cells or new columns, or b) tall and slim tables where rows represent single timestamps and events are added as new rows.
For the LPA product most of the queries start with a particular client in a particular time window and for particular deal types. There are six main dimensions in the queries: the client ID, the liquidity provider ID, the currency pair, the deal type, the quantity and a timestamp for the time bucket. In any single query, five out of these six components are kept constant while the search space spans across the remaining dimension. For instance, client A might be looking to retrieve all bid/ask quotes (aggregated e.g. at per second resolution), for all currency pairs, from liquidity provider B, for spot and for quantity X, at time bucket T. In this example, the varying component is the currency pair. Similarly, an LPA client might be trying to retrieve all quotes from all liquidity providers for a particular quintuple of client ID, currency pair, deal type, quantity and time bucket, in which case the varying component is the liquidity provider ID.
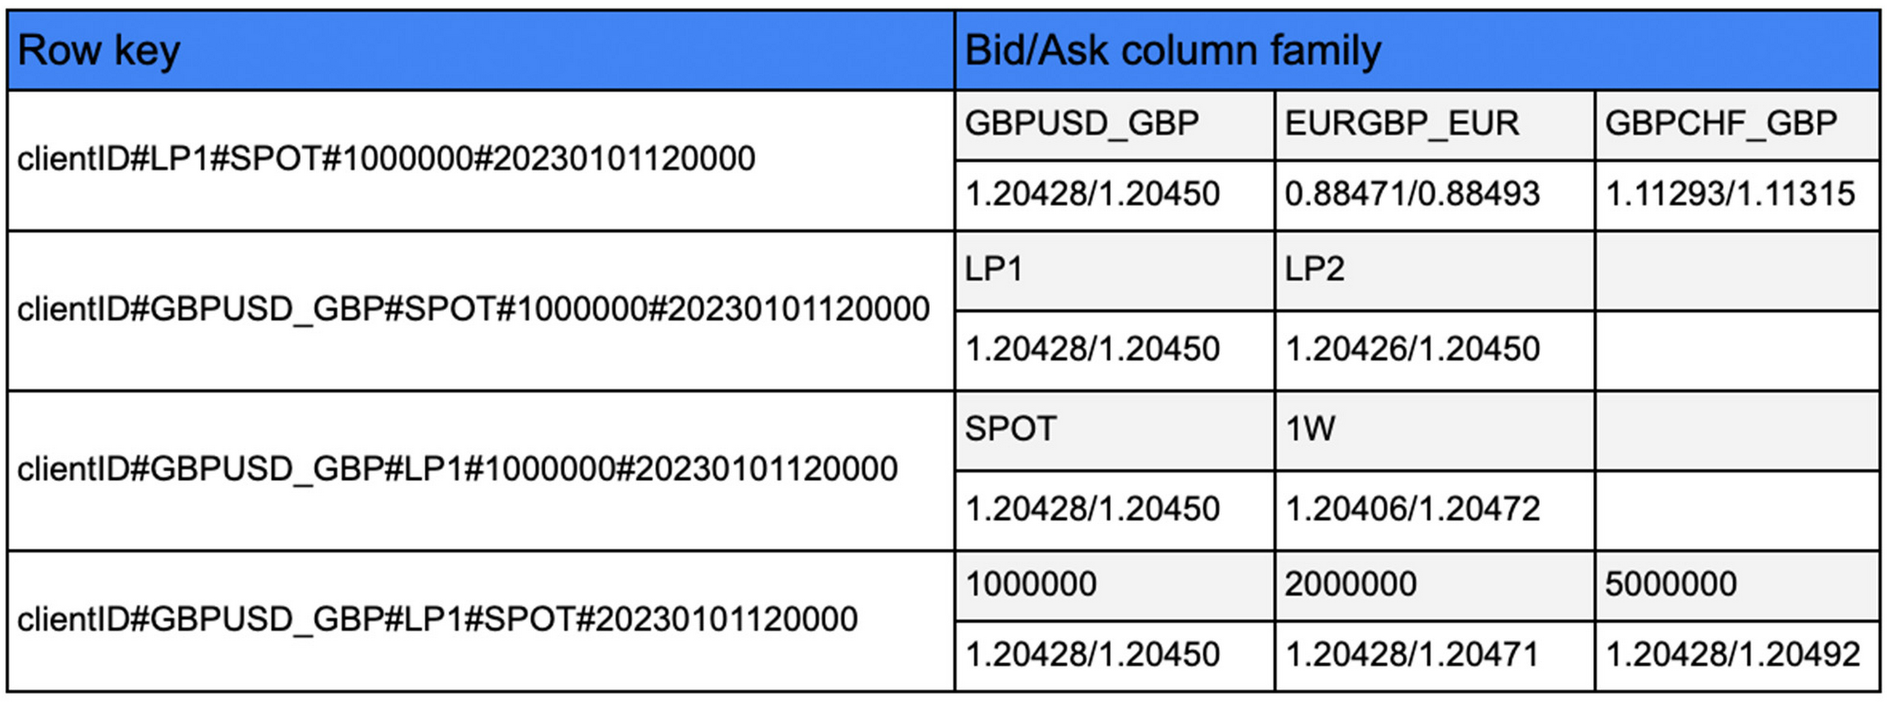
To reduce the read latency, one “bid/ask” column family was created to contain the quotes as data in each cell and all the data are replicated four times in a space-time tradeoff. Each replica of the data is structured to have a different format for the row key, thus enabling the different types of queries at the required low latency. The four different types of keys are:
clientID_liquidityProvider_dealType_quantity_timestamp,
clientID_currencyPair_dealType_quantity_timestamp,
clientID_currencyPair_liquidityProvider_quantity_timestamp,
clientID_currencyPair_liquidityProvider_dealType_timestamp
The query component that is left out of the key in each case is incorporated as a column qualifier to index the required information and separate tables are created for aggregated data at different resolutions (e.g. aggregated data per second, minute, hour etc). One example of this approach is illustrated on Table 1.
To benchmark the performance of the application 1,000 queries with a collection of various Client IDs were used, each one of which hit at maximum 28,800 rows*. This is expected to be a worst case scenario limit as typically clients hit fewer rows per query. The Key Visualizer was used to monitor hotspots and bottlenecks in querying performance, while the Java BigTable client with channel refreshing was used to implement the benchmark tests.
Looking into the future of electronic trading infrastructure: how can Google Cloud help?
A typical electronic trading platform today
Looking beyond client and trade analytics, on a typical electronic trading platform (e.g. Figure 2), a common user journey for a trader is as follows: the trader interacts with a web application where they can see an aggregated book of liquidity and/or they can request quotes (RFQs) for specific instruments. The trader then can place various types of orders (fill-or-kill, limit, good-till-canceled etc.) or use execution algorithms (TWAP, VWAP etc.) to express their market convictions. The order is usually being managed by an order management system, abstracting the interactions with the underlying protocol communications (e.g. FIX), and is executed by an execution engine which interacts with the markets (e.g. other banks, non-banks, broker-dealers etc.). Finally, the trader receives one or more “fills” for the parts of the order that were fulfilled in the market, if the order was at least partially filled.
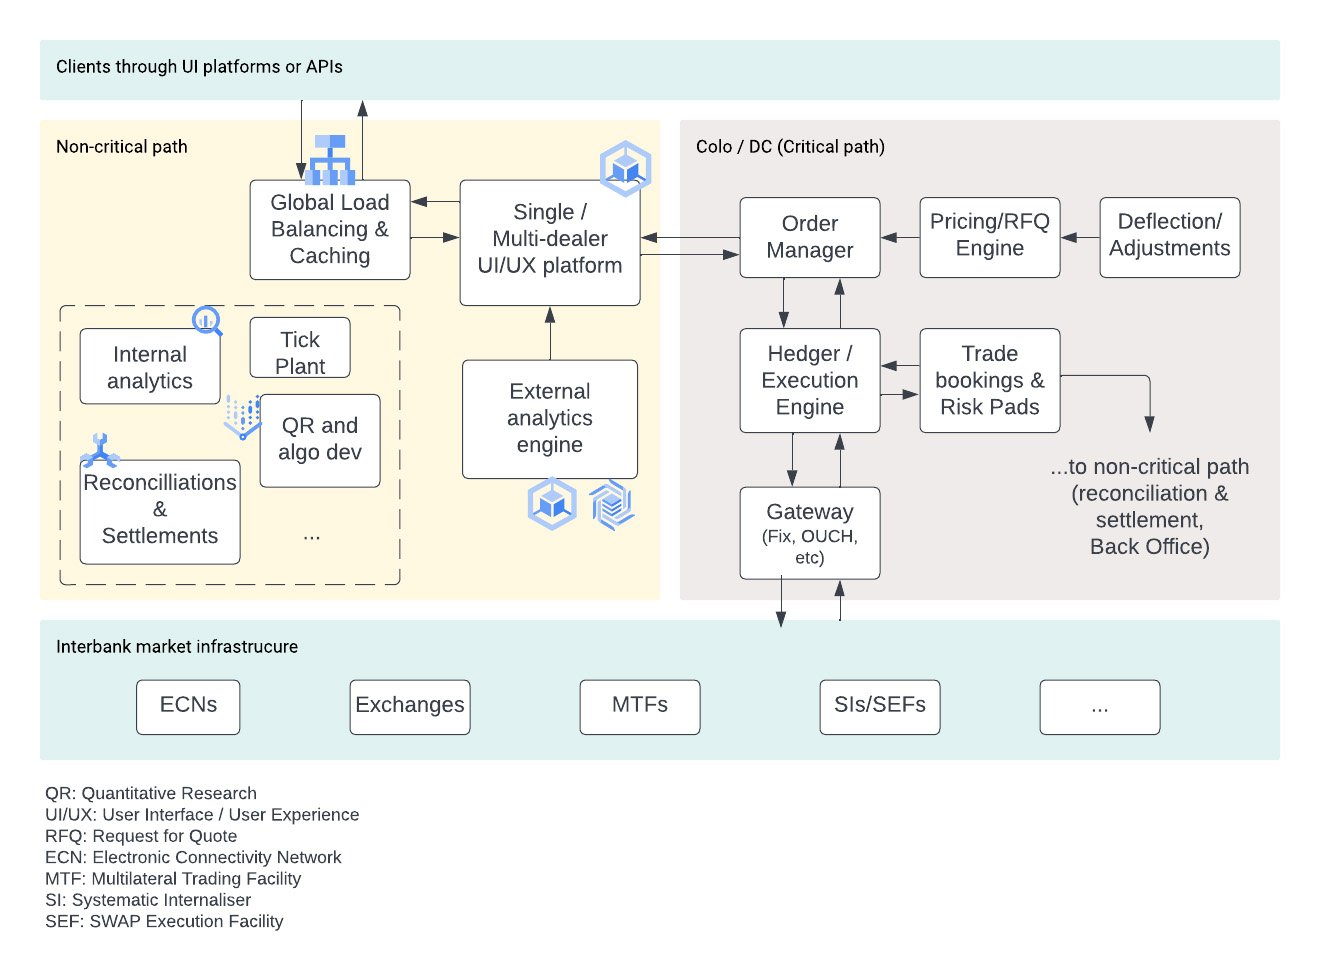
Behind the scenes there are a lot of other systems. A pricing engine that generates the RFQs in a smart way that is profitable for the liquidity provider and appealing to the end user, a time-series database that records every market “tick”, and various trade ledgers, e.g. for risk management, settlements, and reconciliations that potentially need global synchronization capabilities.
The challenge with architecting such a platform
Now, imagine you are specifying out the requirements for such a system to be deployed on-prem. What are you provisioning for? Peak volumes at e.g. non-farm payroll days? A trading activity multiple, e.g. 3-5x of the peak volume of a historical period? In any case, you either end up with a very expensive platform that is not used at full capacity or with a cost effective but unreliable platform when customers need it most, thus losing immediate and long term business when volumes peak. Eventually without continual management, you will end up in both of these situations, an expensive platform that isn’t really ready for sudden and new peak volumes.
Distinguishing between the latency-critical and non-critical path
Engineers of trading platforms usually differentiate between the latency “critical” path where components of the platform tend to stay in a colocation facility, where market participants share data centers with common length wiring, and the “non-critical” path.
The majority of the components comprising a trading platform are not in the critical path and they make excellent candidates for cloud-native applications, leveraging the elasticity and operational efficiencies of cloud.
Five additional ways Google Cloud can help electronic trading platforms to scale and innovate faster, securely and more cost effectively
Faster time-to-value for Quantitative Research: Typically components such as the pricing engine are powered by models developed by a quantitative research (“QR”) team. Oftentimes though QR teams are bogged down by siloed data and legacy model development tooling that doesn’t scale and restricts model deployment to production only to batch mode, instead of being able to capture and monetise intraday changes of the market. Trading platforms can significantly accelerate the time to market and value by using analysis-ready market and reference data as a service through BigQuery, or by sharing data securely and privately within the organization through Analytics Hub. Ultimately QR can move to a cloud-native, fully-managed and scalable modus operandi of data acquisition & discovery, burst compute workloads for model calibration, repeatable, auditable and scalable model development and AI/ML tooling such as NLP APIs and document understanding.
Fully managed, reliable and globally consistent trade and risk ledgers: For instance, Cloud Spanner, a fully managed, mission-critical, relational database service that offers transactional consistency at global scale, is a unique solution for a globally available and synchronized ledger to store and subsequently reconcile and settle trades. Spanner evolved from internal Google applied research and is battle-tested by Google’s own products and services used by billions of users.
More reliable, faster and secure market data connectivity and delivery channels: Today, cloud is becoming pervasive in market data distribution, with 93% of exchanges, trading systems and data providers offering cloud-based data and services, according to a Google Cloud commissioned survey. Google Cloud’s global scale, low latency and highly reliable network allows for real-time market data delivery and consumption, while Global Load Balancer options enable trading platforms to direct orders to preferred liquidity venues in a scalable and fully managed manner. Additionally, Datacast, a market data transcoder, is bridging the gap between trading protocols (e.g. binary FIX, ITCH, etc) and modern formats (e.g. Avro) that are optimized for throughput and latency at the expense of readability and interactivity with modern systems.
Streamlined risk reporting and back office operations: Google Cloud’s Regulatory Reporting Platform offers a cost-efficient, reliable and fast way to facilitate near-real-time or interactive reporting and it can enable an operating model where near-real time risk management is possible and traders can run what-if scenarios in a few seconds or minutes before they place orders.
Regulatory compliance, resilience and security: Infrastructure-as-Code (IaC) and Risk-and-Compliance-as-Code (RCaC) can significantly reduce time to deploy new compliant venues (think… liquidity pools out-of-the-box), and migrating or running workloads on Google Cloud goes a long way towards strengthening operational resilience towards the path of preparing to address regulatory frameworks such as the Digital Operational Resilience Act.
Special thanks with equal contribution to this blog post to Svitlana Gavrylova, Data Practice Lead UK&I; Alison Rooney, Global FSI Partner Manager; Matthew McGibbon, FSI Customer Engineer, and Salvatore Sferazza.
*The maximum number of data points (rows) per instrument considered for benchmarking was one day’s worth of minute data, i.e. 24h*60 min = 1,440 rows and for a maximum of 20 instruments per query we have 20*1,440 = 28,800 rows per query.