Building real-time market data front-ends with websockets and Google Cloud

Fayezin Islam
Customer Engineer, Financial Services, Google Cloud
Sal Sferrazza
Financial Services Solutions Architect, Google Cloud
For those in the financial industry, the core applications for electronic trading of financial instruments have stringent tolerances around latency, throughput, and jitter. But there are also peripheral use cases that would benefit from real-time market data streams, and that are more tolerant of performance variability, such as data visualization and monitoring applications. Until recently, the high onboarding, licensing, and overall maintenance costs of real-time market data made it difficult for many firms to adopt. However, cloud-based delivery has now made real-time market data accessible to a wider array of applications.
As firms reimagine their technology strategy through a cloud-first lens, they have an opportunity to apply real-time data (and its attendant benefits) to these peripheral use cases and accelerate their time to insight.
In this blog post, we’ll share a cloud-first architectural pattern that provides developers a low-friction means of accessing real-time market data streams, with a focus on delivery to application front-ends. This pattern is based on an analytical market data app that we built at Google Cloud last year for our Next OnAir ‘20 conference.
Simplifying access to real-time market data
The traditional method of accessing real-time market data requires firms to co-locate in data centers, purchase and maintain physical hardware, and manage connectivity between the providers and their own data centers. Larger capital markets participants can have entire global teams responsible for these activities.
By streaming market data in the cloud, the barrier to entry for consumers becomes lower. Application types such as retail screen trading, mark-to-market exposure monitoring, index publishing, now-casting, fan charting, and model-driven prediction stand to benefit from this expanded access to real-time data sources—without the infrastructure and maintenance costs that, as a practical matter, have been limited to institutions with the requisite budget and organizational structure.
One relatively young asset class, however, has been cloud-first just about its entire existence. Cryptocurrency trading applications often have real-time market data streamed to trader front-ends via websockets. We applied this model of real-time dissemination to the markets for commodity and financial futures when we built the Next OnAir’20 app. Here’s more detail on that implementation.
Examining the architecture for real-time visualization
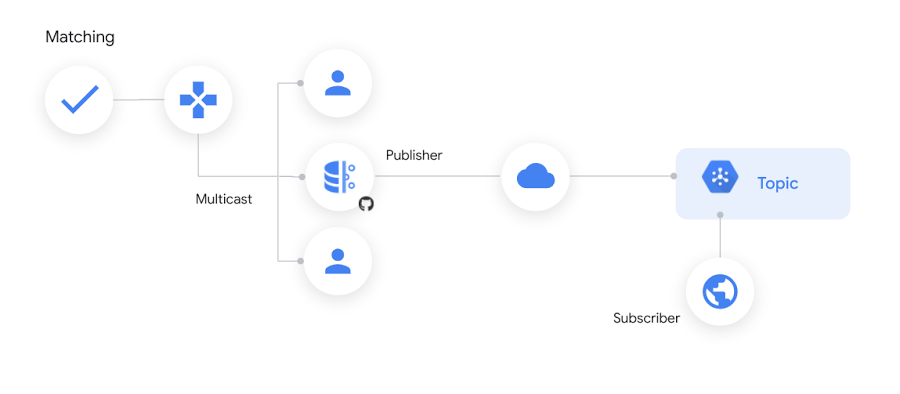
The real-time data source we used was Smart Stream, a service available on Google Cloud from CME Group. The data originates at the CME Globex trading platform as a User Datagram Protocol (UDP) stream running over multicast. Instrument pricing data is forwarded over an interconnect to different Pub/Sub topics, each corresponding to a single product, like silver or butter futures.
As soon as a message is published to its corresponding Pub/Sub topic, it is available globally to subscribers. The delivery latency of the message to the subscriber depends on the clients’ proximity to the publishing region. Typical average packet latencies on consumer broadband connections, for example, are on the order of 10s to 100s of milliseconds - making it a good fit for live web front-end visualizations, given that the threshold of human perception hovers at around 80ms.
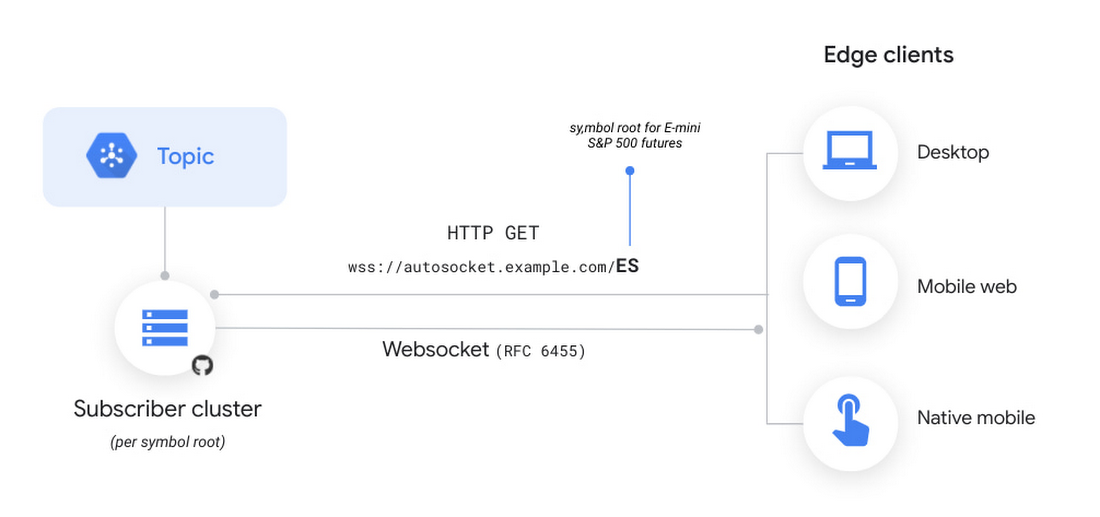
Pub/Sub is a great core distribution mechanism for applications running globally in Google Cloud. However, there are some scenarios where applications sitting outside Google Cloud may need access to a Pub/Sub topic’s messages. One example would be a public website that allows the display of topic messages to anonymous consumers. To help address this and similar needs, we’ve open-sourced a package that we’ve nicknamed Autosocket to distribute Pub/Sub messages over standard websocket connections.
Autosocket serves as an adapter that receives Pub/Sub messages published to a single topic and delivers them to front-end clients that connect to the cluster over the websockets protocol, on a load-balanced IP address. It is a containerized application that uses Cloud Run and is configured with the Pub/Sub topic name to be mirrored.
The deployed cluster is stateless, diskless and elastic, and features global load balancing. Additionally, upon connecting to the cluster, websocket clients are streamed a cache of the last 10 messages that were published to the topic, which can facilitate a better user experience during periods of low message traffic.
Getting started with implementation
There are two main steps to implementing a similar architecture in your own environment:
Deploy a Cloud Run instance that provides the bridge between a Pub/Sub topic and the websocket data that is sent to front-end web applications
Code the front-end application to manage the websocket connections and the continual refresh of visualizations based on the inbound data stream
Connection management
Autosocket is an open source package that automatically mirrors a Pub/Sub topic and handles connections between a Cloud Run instance and frontend web clients. We maintain a separate endpoint for each trading symbol that the application visualizes. When a user clicks on the relevant tab for each symbol, the current symbol’s endpoint connection is disconnected and another connection is established for the newly selected symbol. Connection management needs to be simple since build up and tear down happen frequently. The code in Figure 3 illustrates one straightforward way to manage the websocket connections.
Figure 3: Websocket connection management in Javascript
Visualization at scale
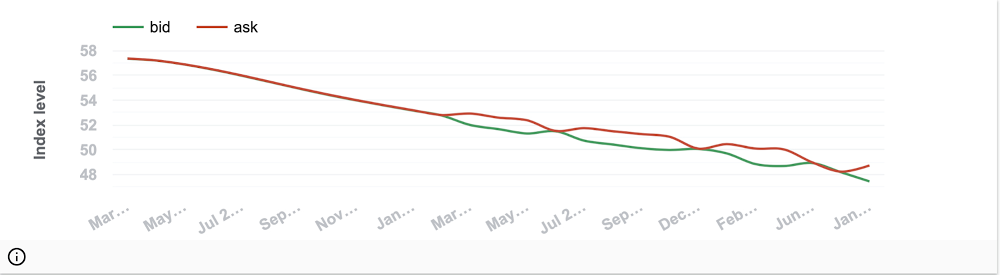
One of the visualizations in the application is a live forward curve chart, which reads the top-of-book data stream from the exchange. The prices plotted on most forward curve charts represent single settlement or last sale prices. Since we have the live prices of a two-sided market available via Smart Stream, we plotted those instead. This gives visibility into the relative bid-ask spreads across a given futures contract’s term structure. Figure 4 is a snapshot of the forward curve visualization from the application:
A summary of the coding approach to visualizing the chart is listed below, followed by a sample of the Javascript implementation in Figure 5. The visualizations were rendered using Google Charts:
Connect to a product code’s websocket endpoint using Javascript’s Websocket API
Key a Javascript map by the expiry months of the futures contracts and maintain the most recent price as the corresponding value of each entry
Update this map in the
processMessage()routine that is called bySocketManagerwith each new message. This could add a new expiration month to the map, or it may update the latest price for an existing month already in the mapSort the map using
Object.keys(), to represent the chronological range of expiration monthsUpdate the visualization with new data in your
drawChart()routine, and usedrawChart()as the callback forsetInterval(x,i)to render the chart with current values from the map on a continual basis
Figure 5: Refreshing a chart with live price data in Javascript
Live market data feeds can be combined with data from order management systems or exchange drop copies to display a trader’s real-time mark-to-market exposure. The unrealized profit-and-loss (P&L) visualization uses two websocket connections in parallel, one for the trader’s entered position and the other for the symbol’s real-time price. Each originates from a separate Pub/Sub topic. The P&L amount is derived at runtime based on the difference between the trader’s position entry price and the live market price, with an arrow preceding the expiration month indicating the direction (long or short) of the trade.
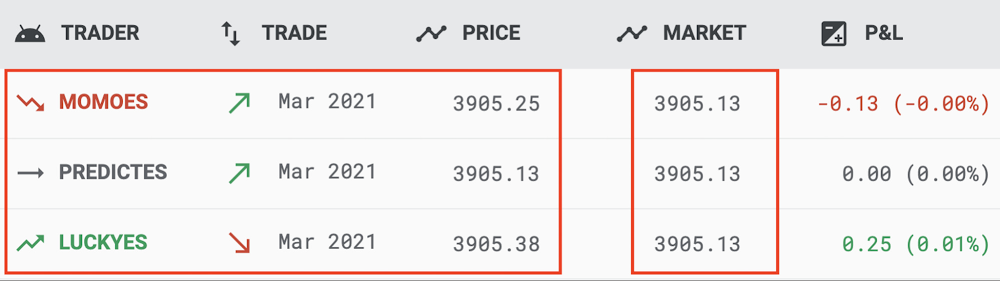
In Figure 6, the leftmost box highlights the data that arrived from the order stream, which contains the trade direction, instrument, entry price and trader name. The rightmost box highlights the live market price of the instrument that arrives via the price stream, allowing the P&L column to be reevaluated continually as the price changes.
How it looks in practice
The Market data in the cloud site implements this architectural pattern concretely using real-time data from CME Group. Behind the scenes, we can quickly spin up and interconnect independent pillars of the app using Google Cloud Build. And of course Terraform and Google Cloud team up to enable declarative, repeatable deployments that guard against configuration drift.
Learn more about Google Cloud for financial services.