People and planet AI: How to build a Time Series Model to classify fishing activities in the sea
Alexandrina Garcia-Verdin
Geo for Environment Developer Advocate
Who would have known that today technology would enable us with the ability to use machine learning to track vessel activity, and make pattern inferences to help address IUU (illegal, unreported, and unregulated) fishing activities. What’s even more noteworthy is that we now have the computing power to share this information publicly in order to enable fair and sustainable use of our ocean.
An amazing group of humans at the nonprofit Global Fishing Watch took on this massive big data challenge and succeeded. You can immediately access their dynamic map on their website globalfishingwatch.org/map that is bringing greater transparency to fishing activity and supporting the creation and management of marine protected areas throughout the world.
Time lapse of Global Fishing Watch’s global fishing map powered by ML
In our second episode of our People and Planet AI series we were inspired by their ML solution to this challenge, and we built a short video and sample with all the relevant code you need to get started with building a basic time-series classification model in Google Cloud, and visualize it in an interactive map.
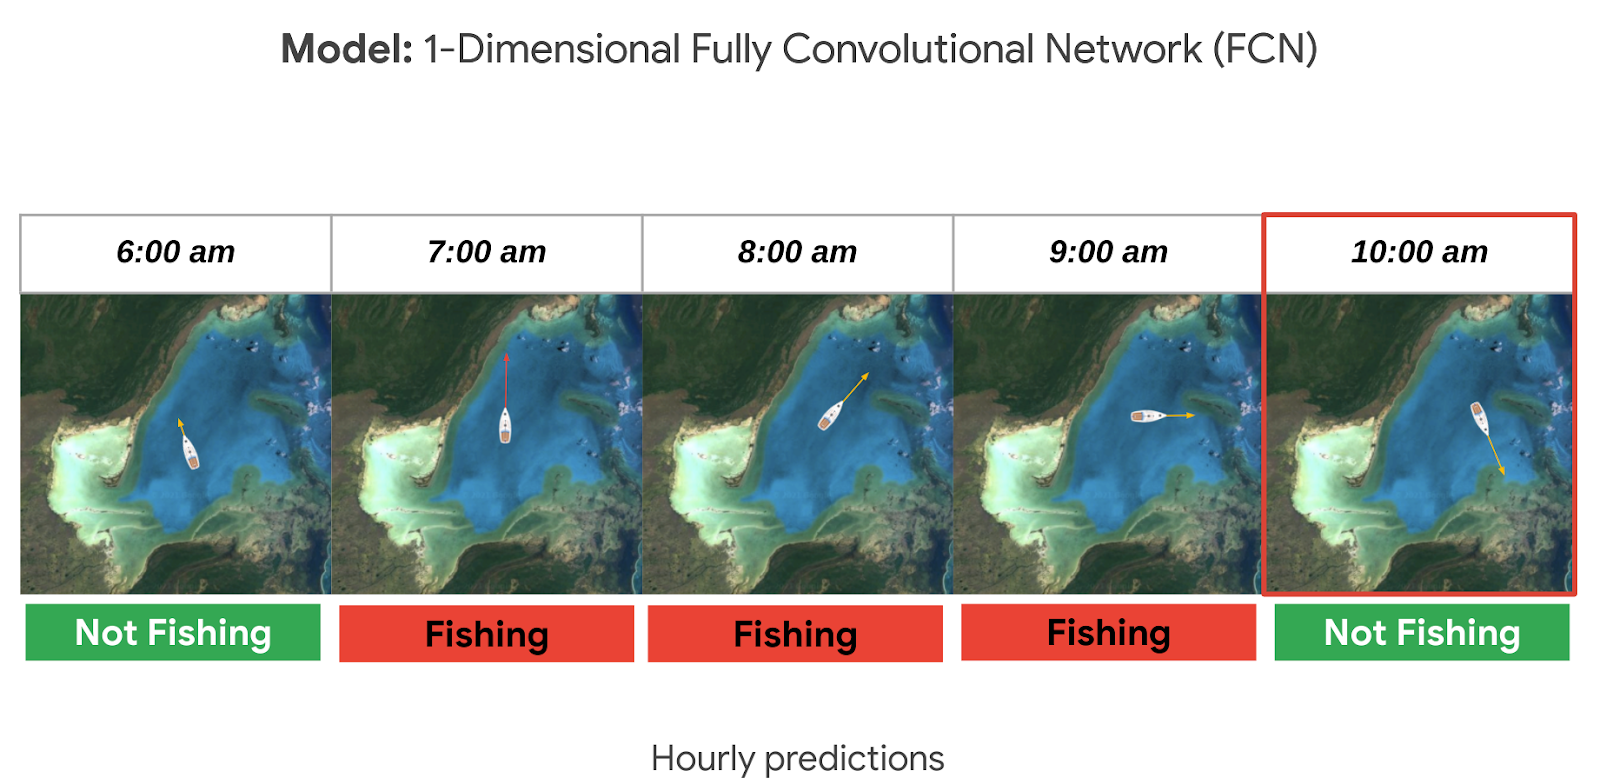
The model making predictions whether a vessel is fishing or not.
Architecture
These are the components used to build a model for this sample:
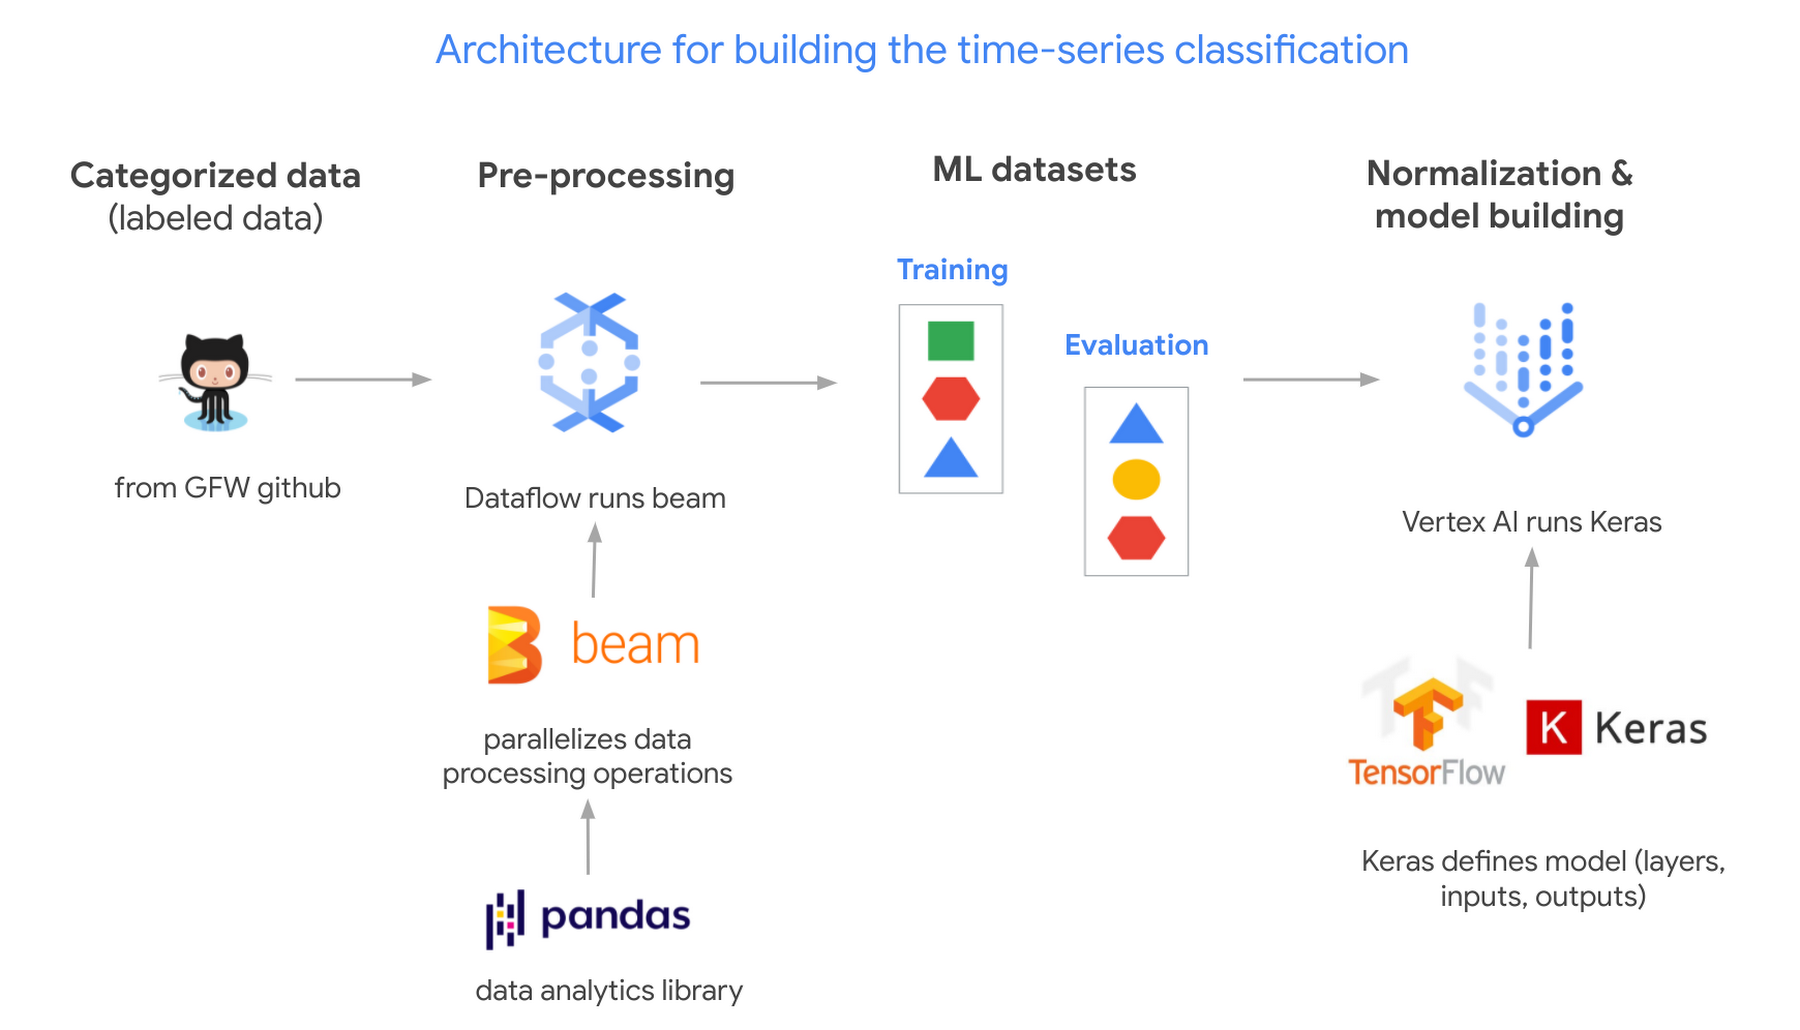
Architectural diagram for creating our time-series classification model.
- Global Fishing Watch GitHub: where we got the data
- Apache Beam: (open source library) runs on Dataflow.
- Dataflow: (Google’s data processing service) creates 2 datasets; 1 for training a model and the other to evaluate its results.
- TensorflowKeras: (high level API library) used to define a machine learning model, which we then train in Vertex AI.
- Vertex AI: (a platform to build, deploy, and scale ML models) we train and output the model.
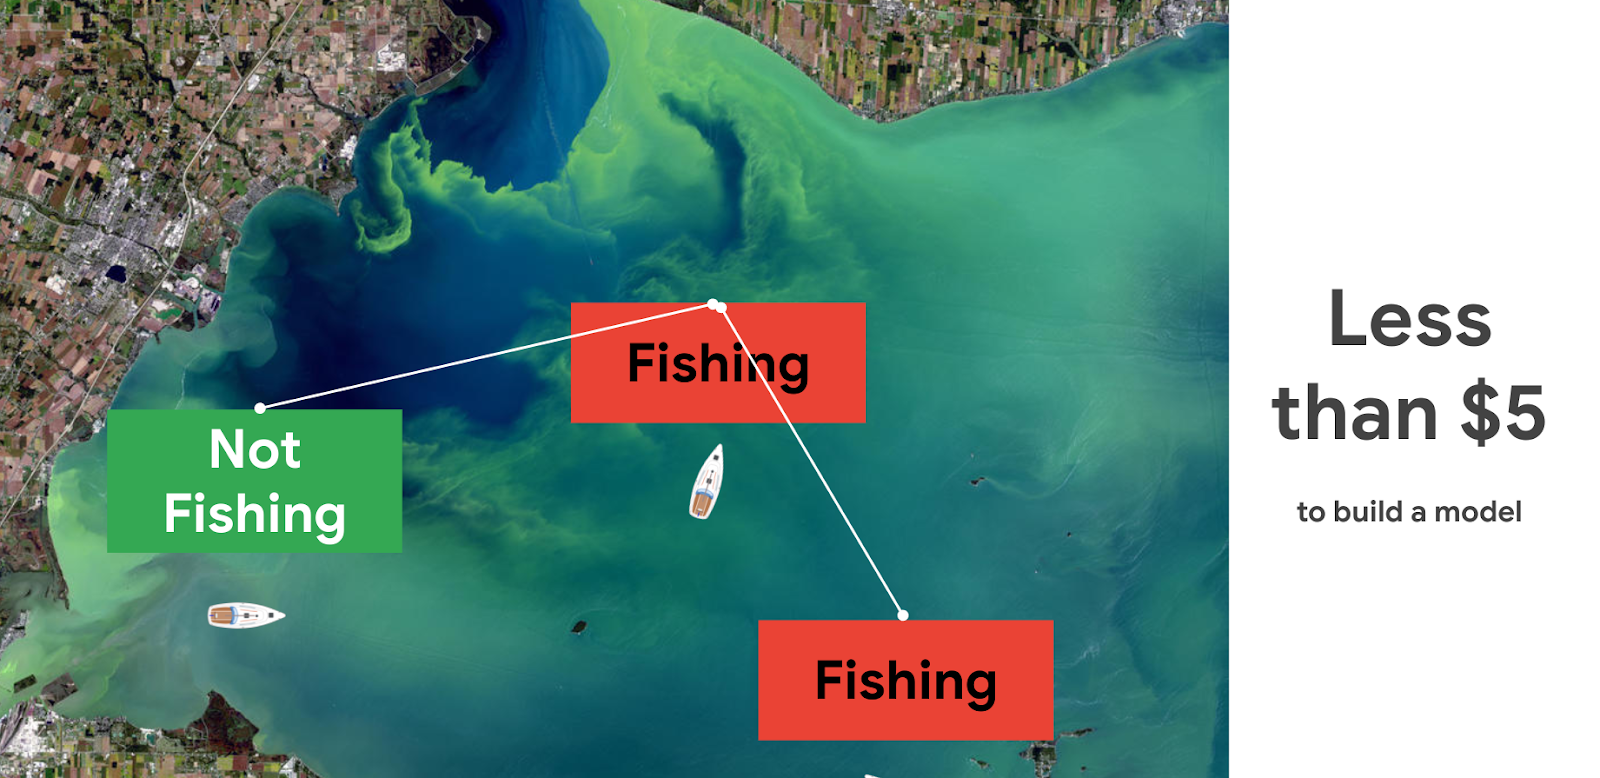
cost of building this time-series classification model is less than $5 in compute resources
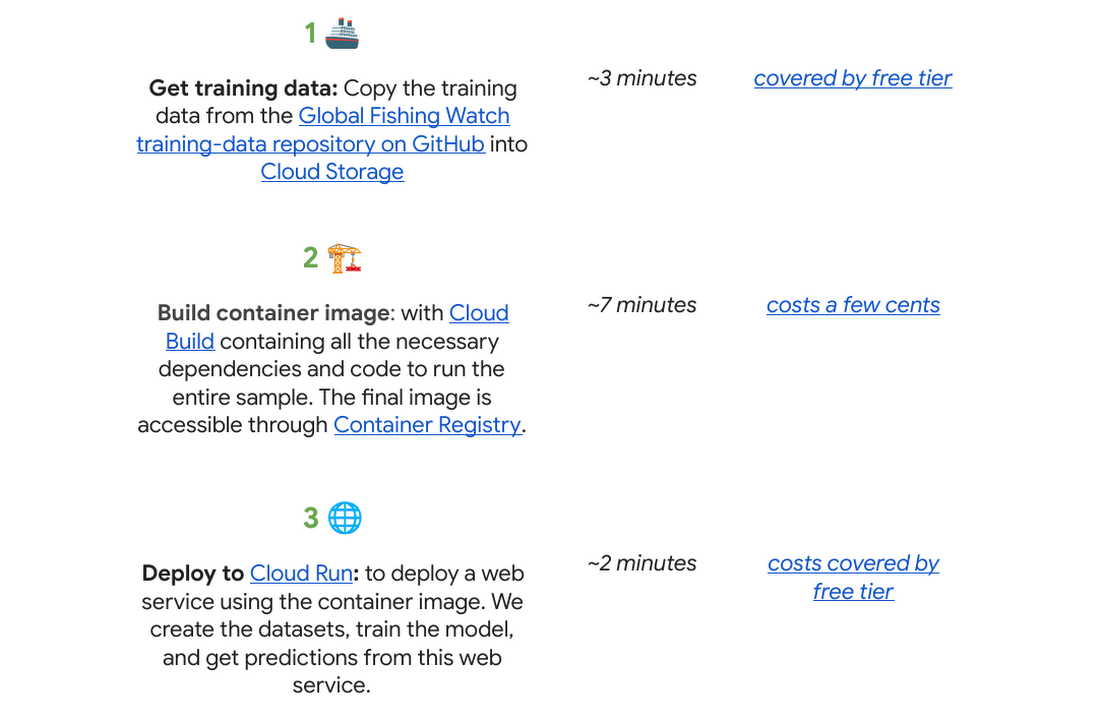
Pricing and steps
The total cost to run this solution was less than $5.
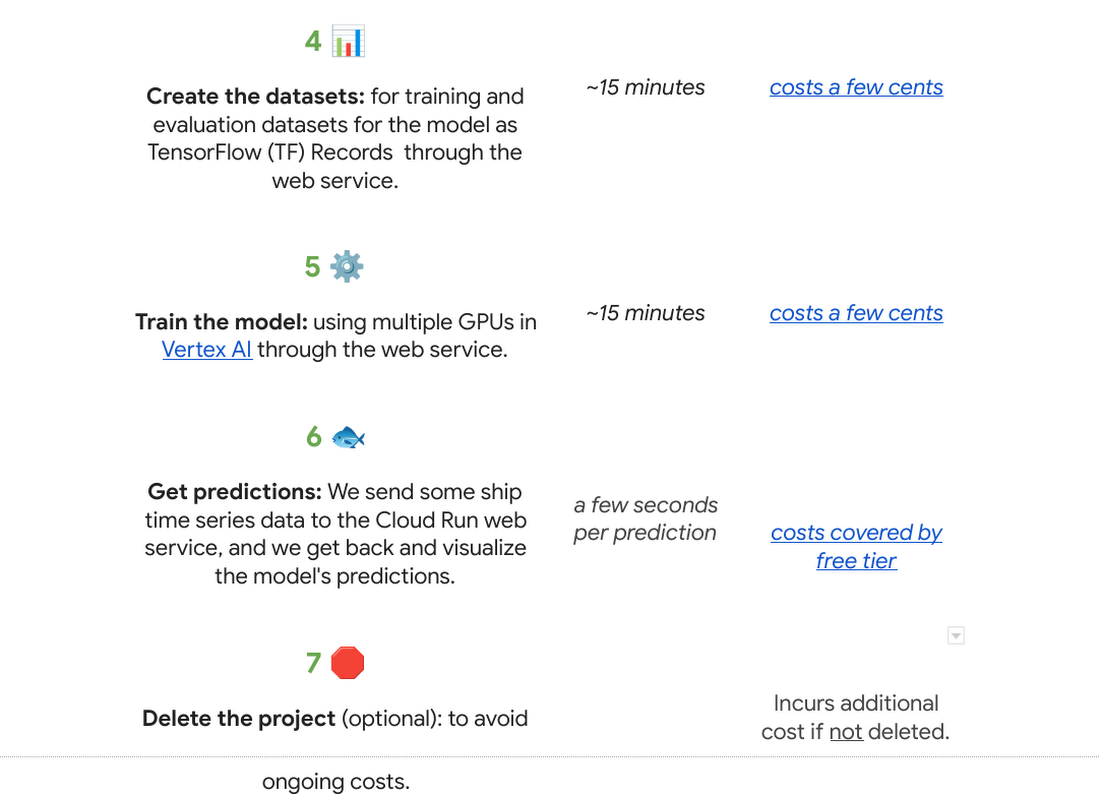
There are seven steps we went through with their approximate time and cost:
Why do we use a time series classification model?
Vessels in the ocean are constantly moving, which creates distinctive patterns from a satellite view.
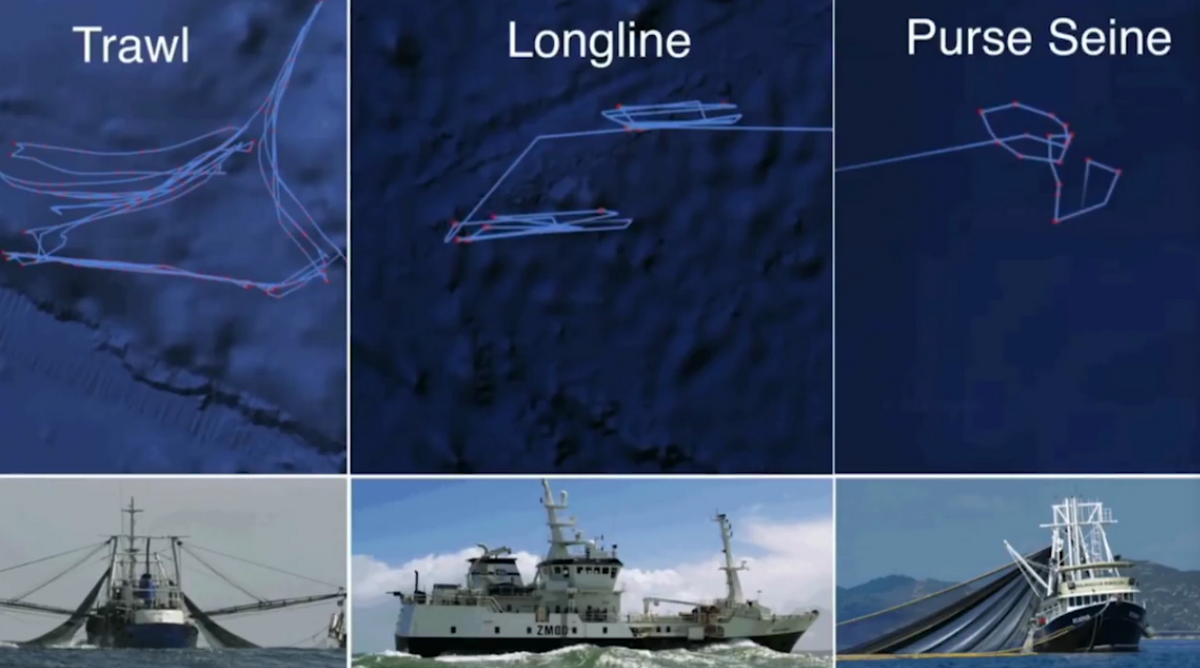
Different fishing gear in vessels move in distinct spatial patterns and have varying regulations and environmental impacts.
We can train a model to recognize the shapes of a vessel’s trajectory. Large vessels are required to use the automatic identification system, or AIS. The GPS-like transponders regularly broadcast a vessel's maritime mobile service identity, or MMSI, and other critical information to nearby ships, as well as to terrestrial and satellite receivers. While AIS is designed to prevent collisions and boost overall safety at sea, it has turned out to be an invaluable system for monitoring vessels and detecting suspicious fishing behavior globally.

One tricky part is that the MMSI data location signal (which includes a timestamp, latitude, longitude, distance from port, and more) is not emitted at regular intervals. AIS broadcast frequency changes with vessel speed (faster at higher speeds), and not all AIS messages that are broadcast are received - terrestrial receivers require line-of-sight, satellites must be overhead, and high vessel density can cause signal interference. For example, AIS messages might be received frequently as a vessel leaves the docks and operates near shore, then less frequently as they move further offshore until satellite reception improves. This is challenging for a machine learning model to interpret. There are too many gaps in the data, which makes it hard to predict.
A way to solve this is to normalize the data and generate fixed-sized hourly windows. Then the model can predict if the vessel is fishing or not fishing for each hour.

Split panel where left side shows irregular GPS signals collected. Right side shows how we must normalize the data into hourly windows.
It could be hard to know if a ship is fishing or not by just looking at its current position, speed, and direction. So we look at the data from the past as well, looking at the future could also be an option if we don't need to do real time predictions. For this sample, it seemed reasonable to look 24 hours into the past to make a prediction. This means we need at least 25 hours of data to make a prediction for a single hour (24 hours in the past + 1 current hour). But we could predict longer time sequences as well. In general, to get hourly predictions, we need (n+24) hours of data.
Options to deploy and access the model
For this sample specifically we used Cloud Run to host the model as a web app so that other apps can call it to make predictions on an ongoing basis; this is our favorite in terms of pricing if you need to access your model from the internet over an extended period of time (charged per prediction request). You can also host it directly from Vertex AI where you trained and built the model, just note there is an hourly cost for using those VMs even if they are idle. If you do not need to access the model over the internet, you can make predictions locally or download the model onto a microcontroller if you have an IoT sensor strategy.

3 options for hosting model
Want to go deeper?
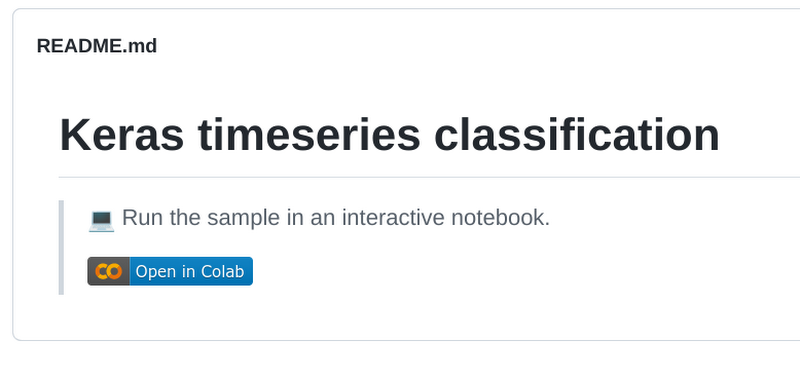
If you found this project interesting and would like to dive deeper either into the specifics of the thought process behind each step of this solution or even run through the code in your own project (or test project); we invite you to check out our interactive sample hosted on Colab, which is a free Jupyter notebook. It serves as a guide with all the steps to run the sample, including visualizing the predictions on a dynamically moving map using an open source Python library called Folium.
There’s no prior experience required! Just click “open in Colab” which is linked at the bottom of GitHub.
You will need a Google Cloud Platform project. If you do not have a Google Cloud project you can create one with the free $300 Google Cloud credit, you just need to ensure you set up billing, and later delete the project after testing the desired sample.
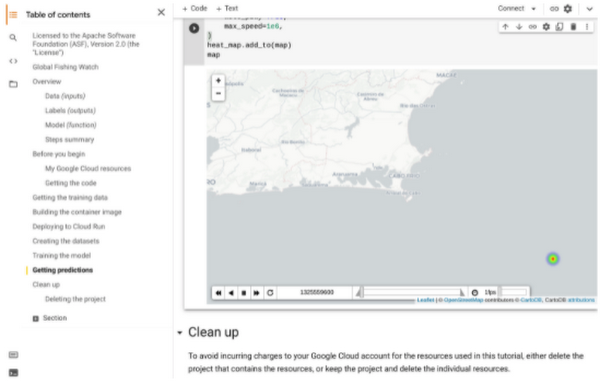
screenshot of interactive notebook in colab notebook