The Brexit vote: A case study in causal inference using machine learning
Karl Weinmeister
Head of Cloud Product DevRel
In this blog post, we'll answer the question, "How did the Brexit vote impact exchange rates between the British Pound and US Dollar?" To do so, we'll use causal inference techniques to estimate the impact of what statisticians call a "treatment," in this case a policy decision.
Please note that this is a technical blog post aimed at educating about concepts and tools with public data, not any political or economic implications. The techniques we'll discuss here can apply to all kinds of scenarios, such as the impact of a marketing campaign or product introduction on sales.
Causal inference is needed because we don't have a controlled experiment for this scenario. An ideal experiment contains carefully matched groups, except for the explanatory variable being investigated. Many real-world situations in which we are trying to find meaning don't meet those conditions.
We'll need to find another time series that closely follows the US Dollar : British Pound exchange rate, but was not impacted by the Brexit vote. From this other time series, we'll derive the counterfactual: what was expected to happen, had the Brexit vote not occurred. We'll estimate the effect as the difference between the counterfactual and actual time series.
Our scenario
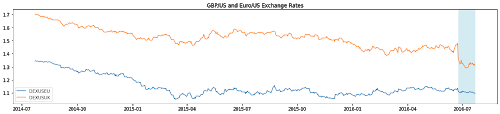
After the Brexit vote on June 23, 2016, the British Pound (GBP) dropped from 1.48 versus the US Dollar (USD) to 1.36 the following day, and continued to decline.
In contrast, the Euro:USD exchange rate did not change much, despite being highly correlated to the GBP:USD exchange rate. The daily values of the two exchange rates had a Pearson correlation coefficient around 0.75 during the 5 year period prior to the event. So, we'll use the Euro:USD exchange rate as a control.
To estimate the effect, we'll consider the following 4 weeks as the post-treatment period. We could extend this period out further to estimate the full effect. However, the longer of a window we use, other factors come into play, and it becomes more difficult to isolate the effect of the treatment alone.
Below you can see a chart of both exchange rates, along with the shaded area indicating the post-treatment period:
Effect estimation with statistical modeling
Given the stark change in USD:GBP, how can we determine if the Brexit vote was a factor, and how can we calculate the size of the effect?
First, let's use tfcausalimpact to estimate the effect. tfcausalimpact is a Python port of the R-based CausalImpact package. It is based on the TensorFlow Probability package and uses the Bayesian Structural Time Series method.
After the data has been loaded into a dataframe, an analysis can be performed as follows:
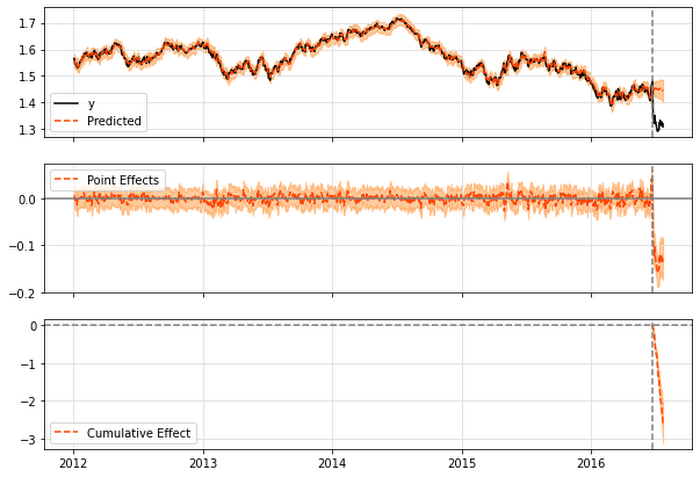
A summary report can be produced, indicating that the Average Treatment Effect during the post-treatment period (i.e. the 4 weeks following the Brexit vote) is a drop of about 9%:
Also, you can visualize the findings in a plot:
Effect estimation with machine learning
We'll now explore an alternative machine learning approach using Vertex AI. Vertex AI is the unified platform for AI on Google Cloud, enables users to create AutoML or custom models for forecasting. We will create an AutoML forecasting model that allows you to build a time-series forecasting model without code.
Over the past few years, there have been multiple studies comparing statistical vs machine learning approaches (e.g. Comparison of statistical and machine learning methods for daily SKU demand forecasting, Machine Learning vs Statistical Methods for Time Series Forecasting: Size Matters). It's outside the scope of this article to discuss this topic in depth, but it's worth noting that each approach has relative strengths, and it may be helpful to apply both in your analysis.
This model will be used to derive the counterfactual time-series. In other words, the model will produce a time-series that aims to estimate "what would the USD:GBP exchange rate be had the Brexit event not happened"? The model will use patterns from the Euro exchange rate, as well as the pre-intervention data from the UK exchange rate, to derive the counterfactual.
In this case, we're actually generating a hypothetical, historical time series rather than forecasting a future time series. With a counterfactual time series like this, policy-makers or business leaders can consider the retrospective impact of decisions they've made.
Let's now explore how to implement the AutoML training process. Here is a code snippet, demonstrating how to create and run the training job from prepared training data: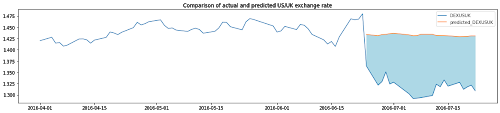
Vertex AI AutoML Forecasting estimated the counterfactual at a slightly higher level than tfcausalimpact, leading to a stronger treatment effect of -9.5% vs -9.3%.
Conclusion
In this blog post, we've explored how to use causal inference to estimate the impact of an event. We've also looked at multiple approaches that can be used to perform this estimate. First, we used tfcausalimpact, which uses a Bayesian Structural Time Series approach, to generate the counterfactual. Then, we used the forecasting service from Vertex AI to use a Deep Learning based approach.
If you'd like to try out this scenario yourself, all of the code is available in Github. From there, you can launch the notebook in GCP Notebooks or Colab. If you'd like to explore Vertex AI AutoML Forecasting in more depth, this codelab provides an end-to-end tutorial. Feel free to connect on LinkedIn or Twitter to continue the conversation!