Boost your query performance troubleshooting skills with Cloud SQL Insights
Jan Kleinert
Cloud Developer Advocate
Diagnosing and troubleshooting performance issues in an application can be difficult and time-consuming, particularly when a database is involved. Developers often have to rely on multiple, hard to use tools to identify and diagnose issues. Cloud SQL Insights, currently available for CloudSQL for PostgreSQL, is a new feature that provides developers with a single UI for self-service, application-centric monitoring and diagnosis. Let's take a look at how we can use Cloud SQL Insights to identify the cause of a performance issue with a microservices-based application.
What problem are we investigating?
The application is a ride-sharing application with multiple components. Customers can request rides, pay for rides, and view a customer order dashboard. Drivers are assigned rides, receive payments, and can view a driver dashboard. The application is built using Django, and it connects to a PostgreSQL database on Cloud SQL.
We've received reports from some of the drivers who are using the application that they were experiencing problems when charging customers for rides starting around 6pm. Let's use the Cloud SQL Insights dashboard to see if we can determine what might be causing the issues.
How do we access the Query Insights dashboard?
From the Overview section of our database instance, we can get to the Query Insights section in a couple of ways: by clicking Query Insights in the left navigation or by clicking the message about Query Insights below the graph.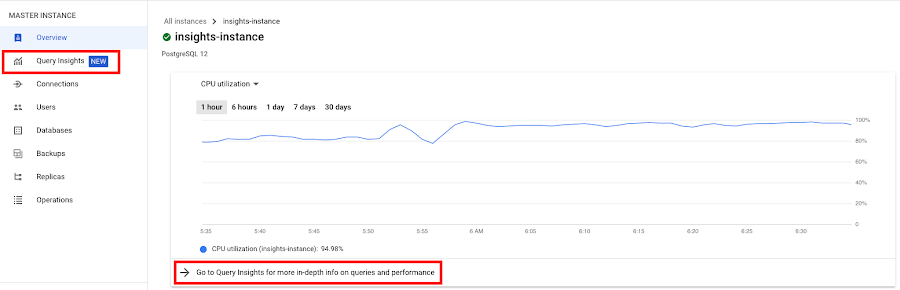
We can see right away that something started happening around 6:00pm that caused load and wait times to spike.

Which queries are responsible for the most load?
Scrolling down a bit on that page, we see the QUERIES table that contains the normalized queries for the time range we selected. The queries in the table are sorted by the total execution time. The first query in the table certainly stands out, as its total execution time is much longer than the rest of the entries.
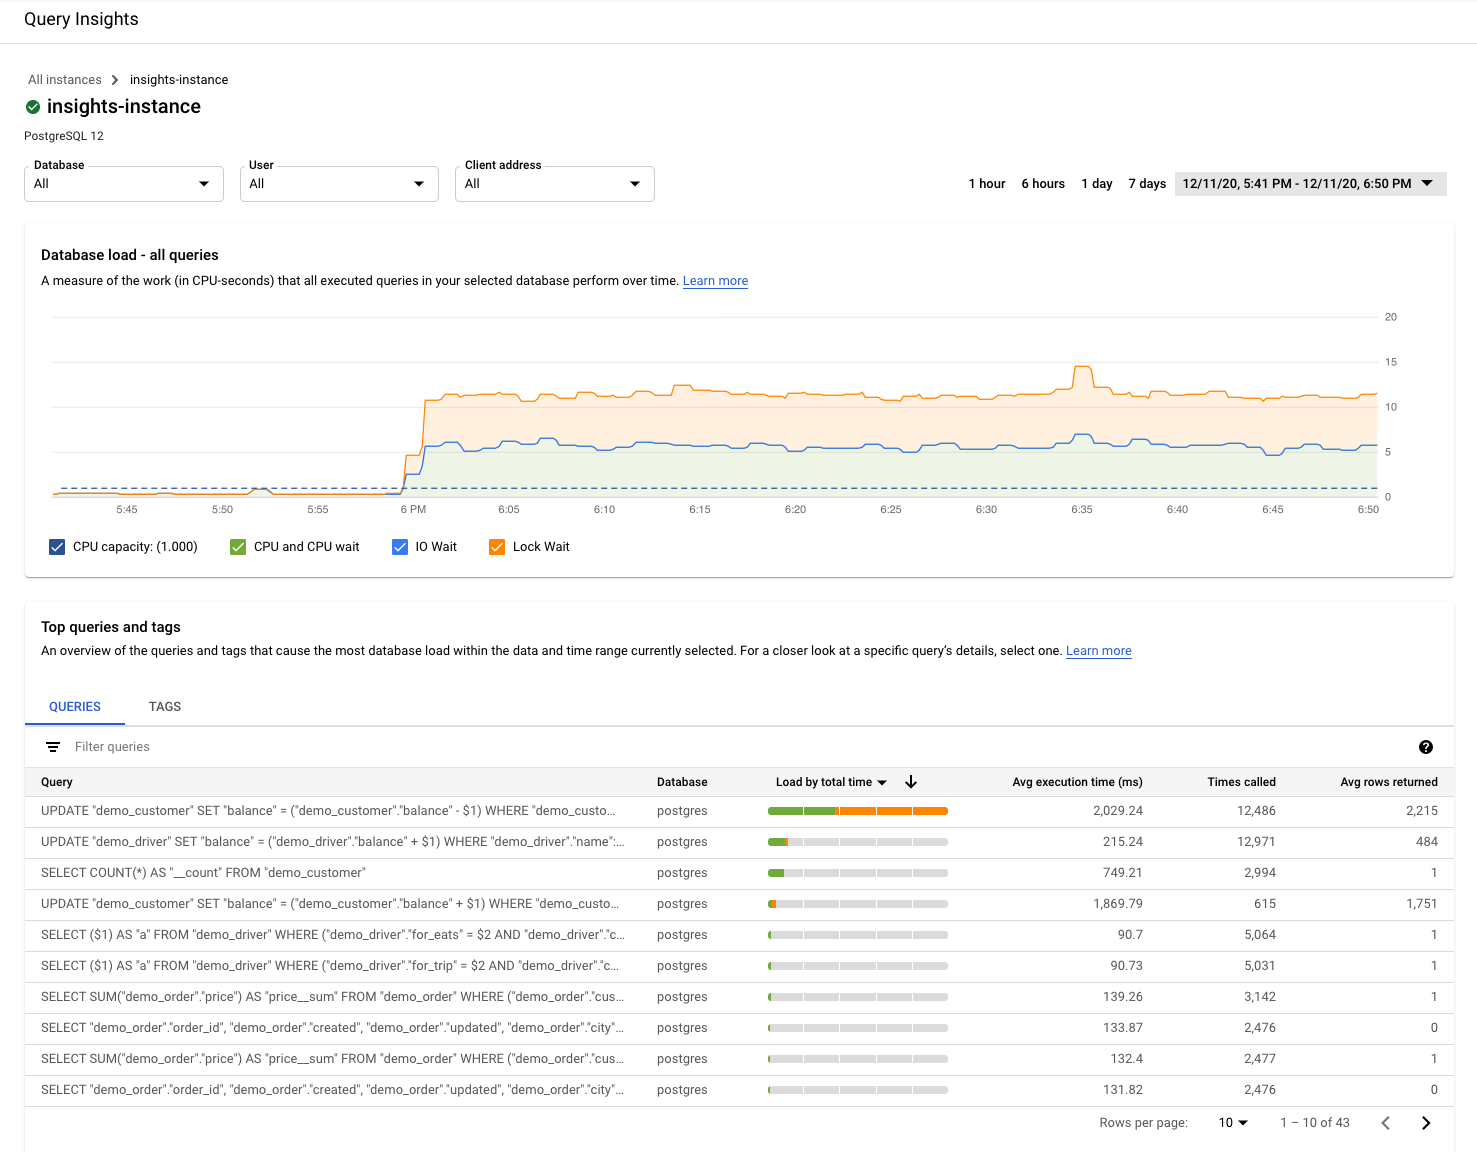
We could click into that query to view detailed information about the query, such as database load for this specific query, query latency, query plan samples, and top users. Since this application is built using an ORM, I'm not sure what part of the application is responsible for that query. Luckily, Cloud SQL Insights' Top Tags section can help us figure this out.
Where is the query load originating in the application?
We can toggle from the QUERIES table to the TAGS table to see a list of queries tagged by business logic, giving us a more application centric view. Cloud SQL Insights created an open source library, SQL Commenter, which provides instrumentation and wrappers to augment SQL from frameworks and ORMs. Since our application is using one of the supported ORMs, the queries are automatically tagged with no change to our application code, and we're able to more easily identify query load and pinpoint where the problem may lie, since we can see the controllers (or views in the case of Django) and routes.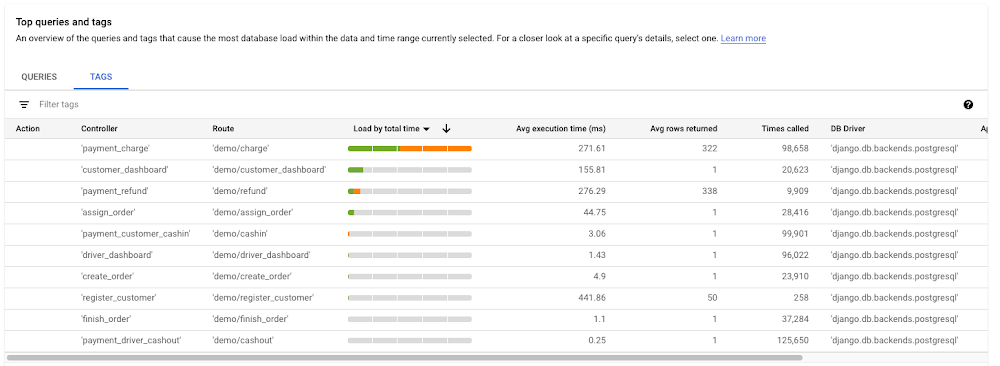
Looking at the first row in the table, we can see that the payment_charge view that's accessed by the 'demo/charge' route in our application is taking the most time.
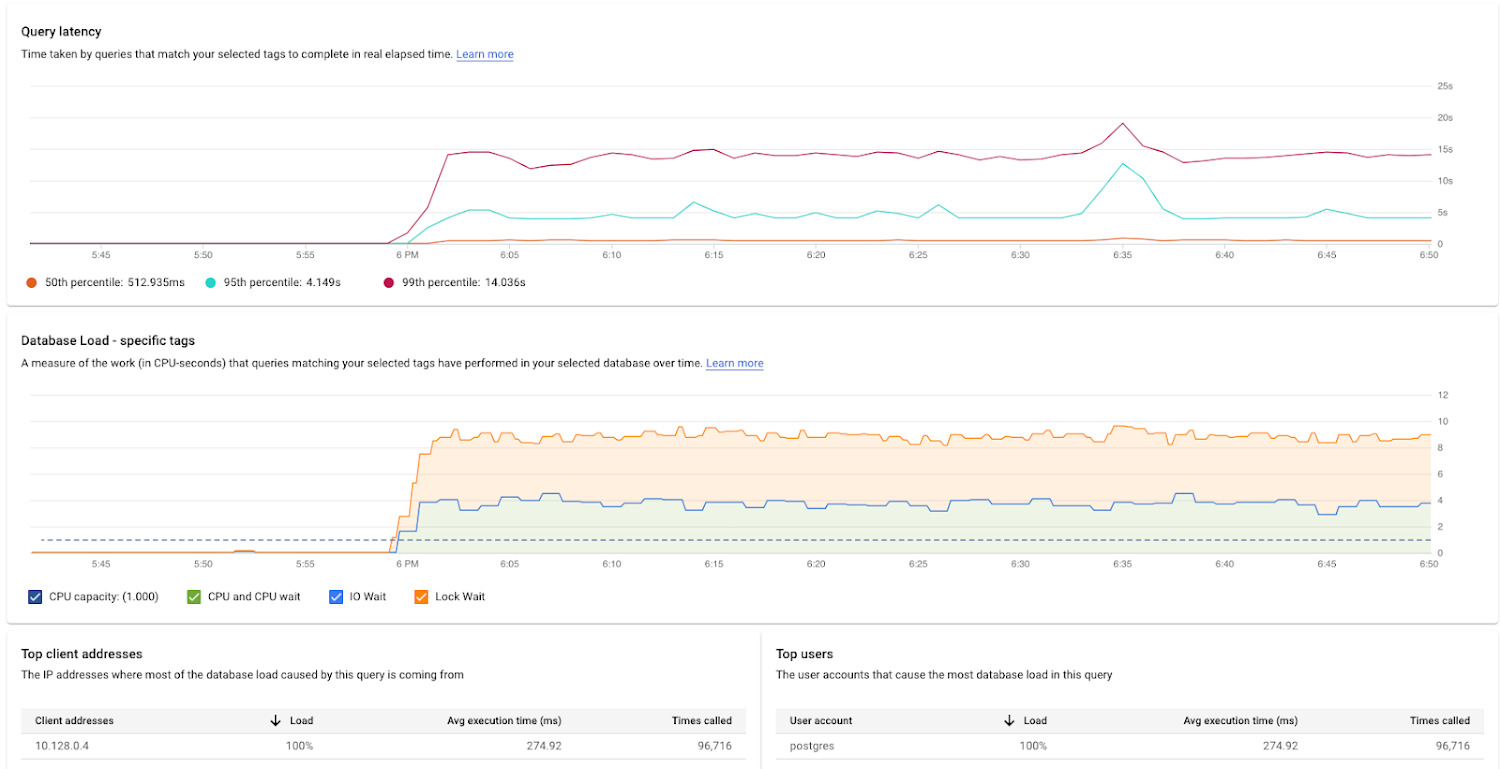
To investigate further, we can click on that first entry in the TAGS table to see more information on that specific application tag, including tag details, query plan samples, query latency, database load for the specific tag, and top client addresses and users.
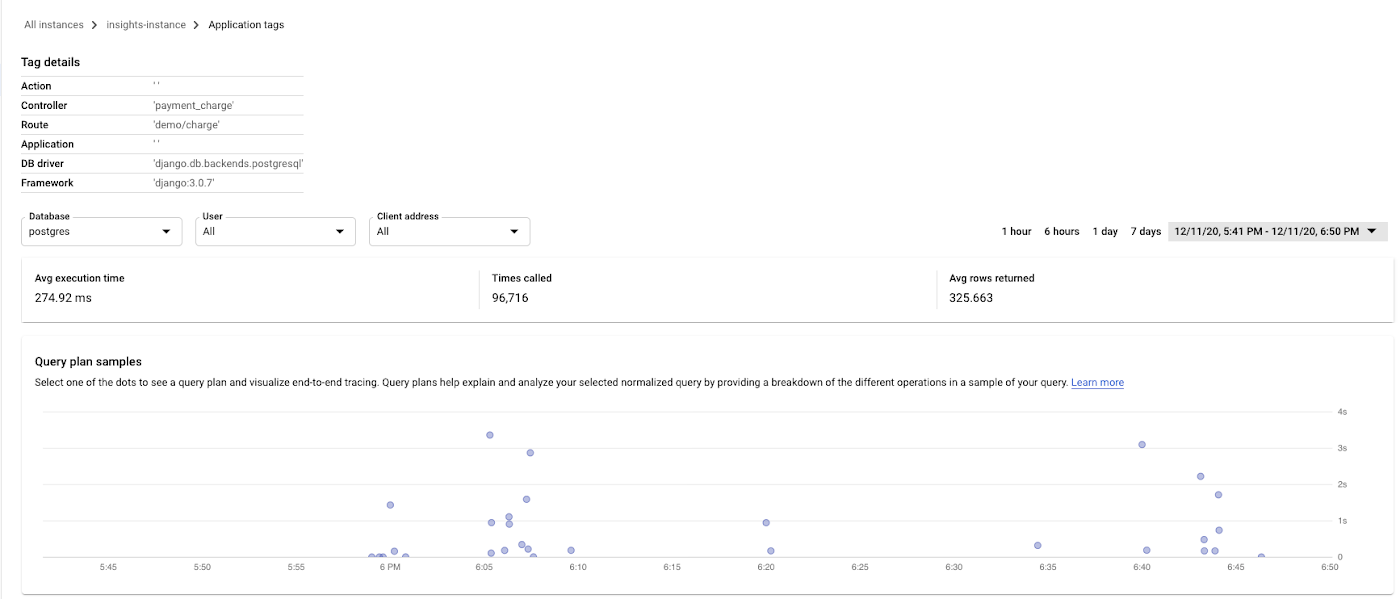
Why is the query running slowly?
We can click into one of the dots in the Query plan samples graph to see a query plan. The query plans show how PostgreSQL executes a query under the covers, making it easier to determine which operation resulted in the slowness.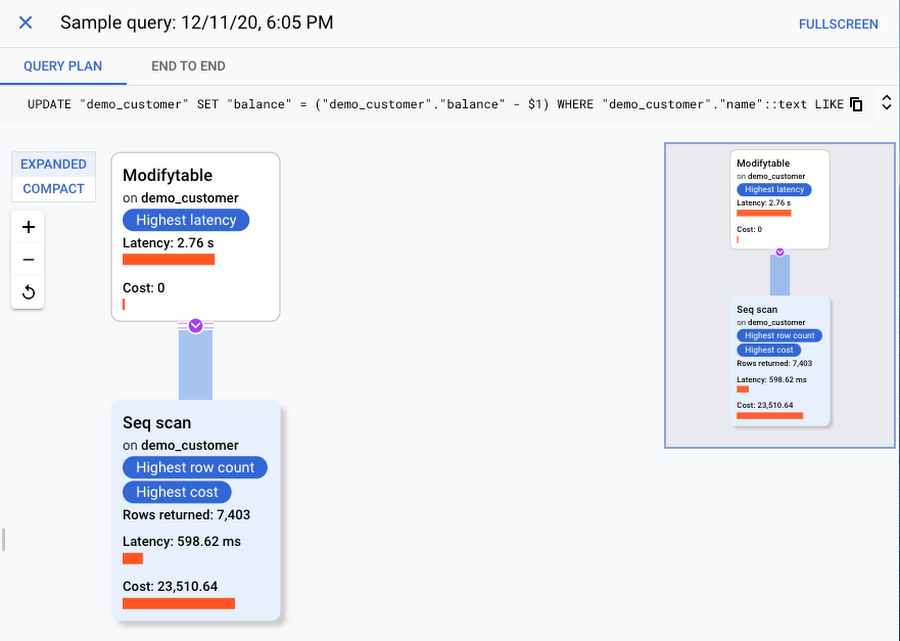
What application code is causing the slowness?
As I mentioned earlier, our application is using an ORM, and I'm not sure what part of the application is generating this query. The built in end-to-end tracing is helpful for investigating further. When we click on the END TO END tab, we can see the in-context trace.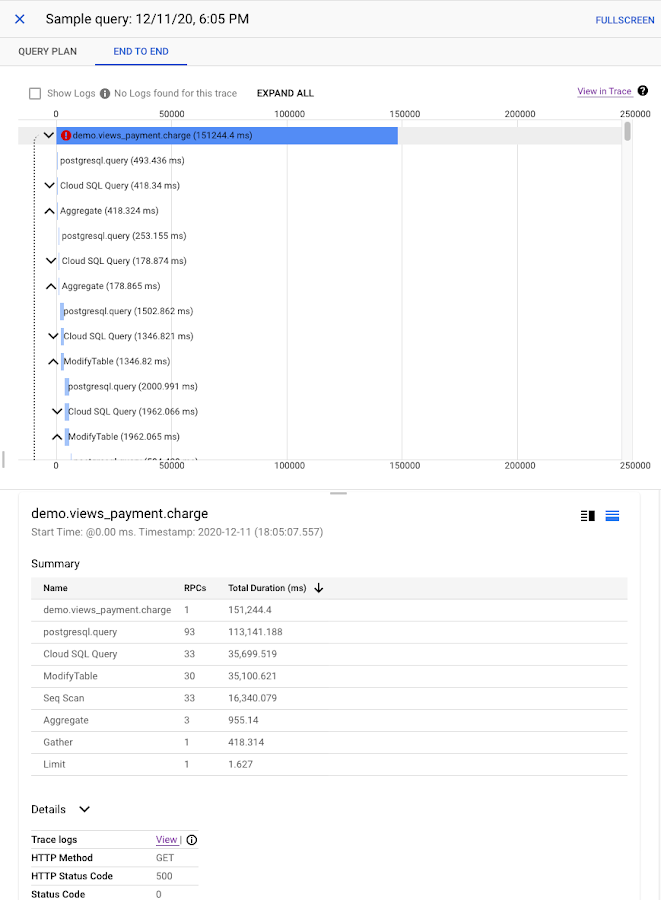
As you can see in the screenshot above, we're getting an HTTP 500 error from demo_views.payment_charge. At this point, we have enough evidence that there is something going wrong in the payment_charge view, and we can investigate further in the code. Cloud SQL Insights helped us narrow down the likely source of the problem in our application code. We were able to identify and fix some inefficient, resource-intensive actions happening in payment_charge only at certain times of the day if a very large number of users were being charged at the same time.
Next Steps
In this post, we looked at ways you can use Cloud SQL Insights to help with diagnosing and troubleshooting application performance issues, all from a single intuitive UI. Try it out yourself with this codelab, or read the documentation to learn about the features in even more depth.