Billing reports and Saved Cost Views

Mark Mirchandani
Google Cloud Developer Advocate
Try out Saved Cost Views to create and share custom views from the Google Cloud billing reports page.
TL;DR — Try out Saved Cost Views to create and share custom views from the Google Cloud billing reports page.
There’s a lot in common with FinOps, cost optimization, cost efficiency, etc. Different companies and cloud providers use these to describe a variety of ideas that have one thing in common: maximize the value on your investment in the cloud. While there are many ways to optimize your investment, none are possible without first understanding your costs.

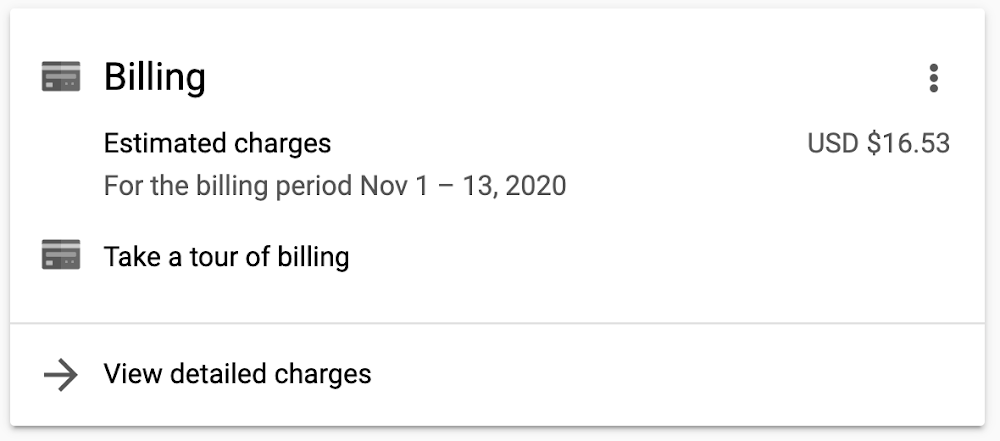
The number one way to start looking at your costs in Google Cloud is to use the billing reports page. Just getting started? Try out the new billing tour to get a quick walkthrough of a few different reports available in the console.
There’s also a video I put together that goes over how to use the billing reports and how to use the filters. It’s from last year so there’s been a few updates, but the idea is still the same and the interface hasn’t changed.

Exploring your GCP costs with Billing reports
There’s more detailed ways to look at your cost that I’ll cover soon, but for now I want to call out a new feature available in the billing reports: Saved Cost Views. It’s a pretty simple feature, so I’ll get right into how to use it.
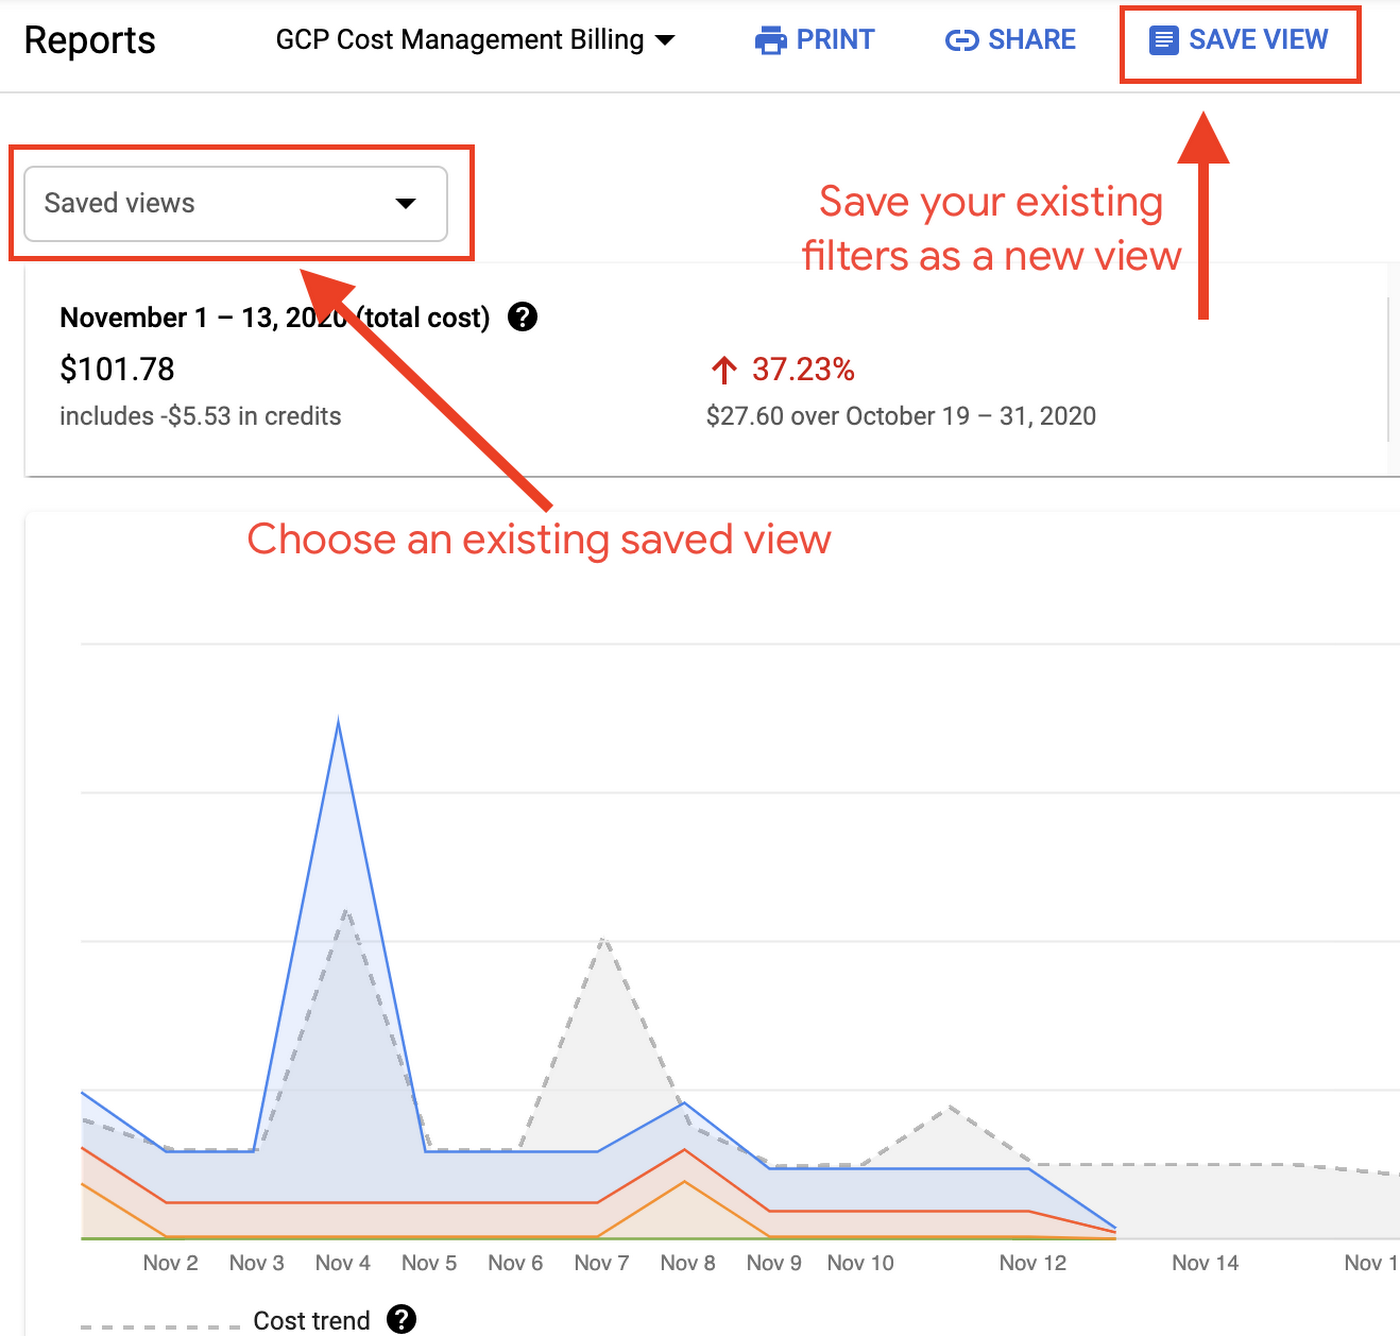
The “Save View” button does exactly what it sounds like: it saves what you’re currently looking at as a new view that you can name. This can be really handy when you find yourself looking for some specific information often. Rather than manually selecting all the filters each time, you can set up your filters once and then save them as a new view.
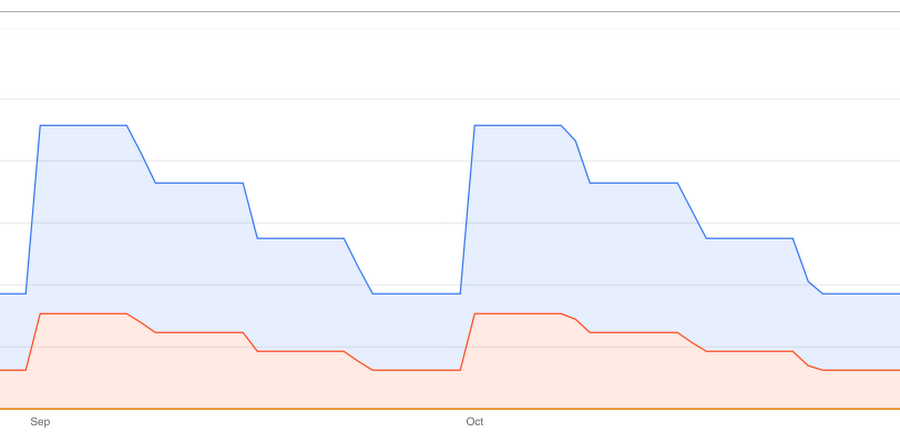
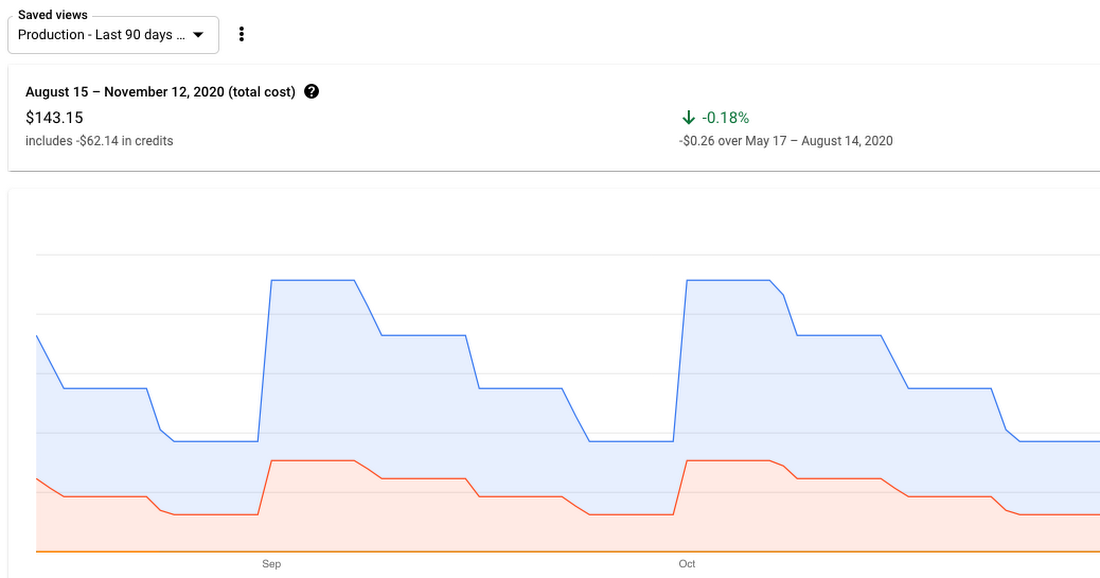
For example, I find myself often looking at the past 90 days for production projects, grouped by SKU, just to make sure everything looks good and I didn’t miss anything. The first step to setting this up would be to set up the filters for what I want to see.

It’s simple enough to change the usage date to the last 90 days, group by SKU, and select the project(s) I care about. These give me a nice-looking graph so I can make sure my recent prod costs look like I expect them to.
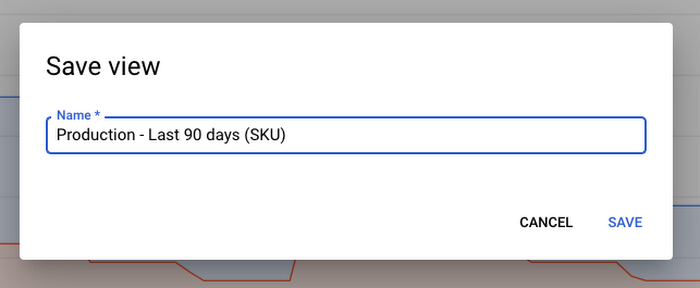
Everything looks exactly how I want it to here, which is great. But I don’t want to have to come back to the reports and constantly set the same filters over and over again. One easy fix is just to bookmark the page since the filters are added as query string arguments, but that becomes a pain to juggle as more views and team members are added. So, I’ll just save the view.
Now anyone with access to the billing reports for this billing account can just select the view from the drop down and they’ll see the same data!
Of course, this is a pretty simple example. There’s a lot more you can filter on, such as regions, labels, and specific products/SKUs. If you’re looking for an easy way to quickly switch between a few reports, try it out for yourself!
If you want to read more, check out the documentation.