Framing up FinOps: All about Google Cloud billing tools
Eric Lam
Head of Cloud FinOps
Sarah McMullin
Group Product Manager, Google Cloud Billing
If you didn’t catch or you need a refresher from our most recent Framing Up FinOps podcast, you’re in luck! In this blogpost, we recap highlights from our episode on Google Cloud billing tools and spotlight 10 FAQs. Read on for resources to help you better understand Cloud Billing. You can gain visibility into what’s driving costs and find out more about tooling to help you optimize your cloud costs.
Generally, we organize our tooling around the three stages of the Cloud FinOps customer user journey: inform, optimize, and operate. Billing tools in the Inform stage are primarily designed to help you see, understand, and allocate costs. Optimization tools promote better efficiency of your cloud spend. And operational tooling can help your organization stay ahead of any cloud cost surprises. In this post, we focus on tooling for the first two of the three lifecycle phases: inform and optimize.
Inform
Make cost information visible.
1. What kind of out-of-the-box tooling comes with the Google Cloud billing console?
With the billing console, you have immediate access to several cost visibility and reporting resources. They can help you understand your cloud costs and organize data, which we aggregate hourly and distribute as soon as they are reported, without having to do a lot of custom reporting work. To help you visualize costs, the billing console features pages, tables, and graphs, plus comprehensive reporting flexible enough to suit your unique business needs. There’s no need to opt in for these resources. This rich data and robust tooling is available out of the box.
Two examples of data-rich pages in the console include the billing overview page, which features summary data of your high-level spend, project trends over time, remaining credits, budget-alert functionality, and more. The cost reports pages depict your cloud costs in both graphical and tabular form. You can filter data by SKU, service, discounts, labels, and other meta data to help you drill down on your costs. The console also supports downloading CSVs as well.
Fun fact: if you’re on a free Google Cloud trial and you don’t have a monthly bill, you can still see a breakdown of remaining credits in your billing console overview.
2. What resources are available to organize the costs that come with these reports?
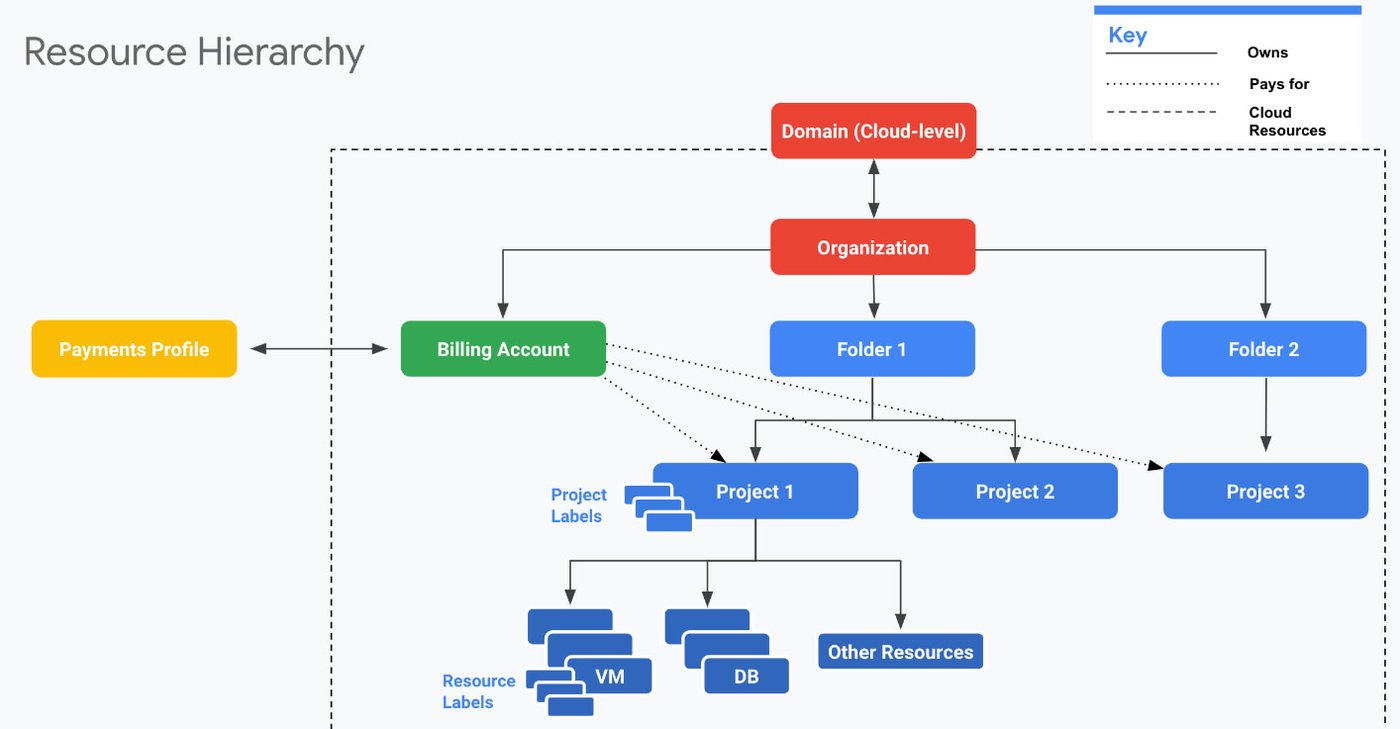
If your organization is like most, different departments and teams use your Google Cloud services. Use folders to isolate requirements of disparate teams, and use projects to organize workload-processing resources. Other options include labels and tags, which you can use to further categorize your service-level (e.g., VM instances) and account-level (e.g., projects) resources. Here’s an example visualization of the resource hierarchy and how you can organize resources within it.
3. Once I’ve exported billing data, how do I allocate costs to the appropriate teams within our organization?
We recommend Google Cloud Tags to help you segment cloud spend, allocate costs, and assign key value pairs across resources. With tags, you can define both cost centers and business units. You can also map costs to different resource owners. Tags offer rich features that labels don’t including:
Governance, which allows you to create different user roles.
Binding inheritance, which cascades project or folder tag values to the resources within them.
An enhanced character set, including the at sign (@) and period (.), which enable you to input email addresses.
With tagging, you can allocate costs through chargeback and showback, that is, charging back various cost centers within your organization and showing costs — by user, team member, business unit, or cost center — back to your organization.
4. Who can access my Google Cloud billing console?
In your billing console, you can assign permissions for who sees what. The two primary permission roles you can choose from are entire-account visibility or a project-based view, which permits users to view individually selected projects.
5. What can I do with Google Cloud billing reports if I have more than one cloud instance?
If you have a multicloud environment, we recommend exporting billing data to BigQuery. With BigQuery, you can store, query, and export large data sets. Then, you can plug this data into home-grown tools or within Looker Studio Pro to analyze your dashboards further.
6. How many BigQuery exports do you have, and what data do they provide?
We offer three billing exports to BigQuery:
Standard billing. This high-level export provides basic billing and usage data, including cost, billing account IDs, services, SKUs, projects, location, credits, and currencies.
Detailed billing. This export provides more granular sub-service cost data. It offers visibility into costs by resources, including VM instances, persistent disks, and Kubernetes cluster. With this detailed data set, you can determine which specific clusters are driving up your cloud costs. It can be particularly useful in managing a multicloud environment as well as cost-allocation, showback, and chargeback modeling.
Pricing data. With this export you can view pricing data, including billing account prices and discounts, across Google Cloud.
7. How can I query data in BigQuery if I don’t know SQL?
Don’t worry if you don’t know SQL. Here is just one of several examples of how to query the billing data exported to and stored in BigQuery. In our Cloud Billing docs, you can find more example queries by cost, tags, SKUs, and more. We suspect that once you’ve had some practice with our example docs, querying will become intuitive.
Optimize
Drive cloud efficiency.
8. How can I optimize my cloud services?
One of the easiest, most succinct ways to optimize your cloud costs is with committed use discounts (CUDs). CUDs provide discount prices in exchange for either a minimum spend or a resource commitment over one or three years. With commitment-based discounts, you can improve your rates and quickly apply discounts to the largest area of your cloud spend. Choose from two types of CUDs:
Resource-based CUDs. These discounts are available for Compute Engine and VM instances. They’re ideal for workloads with predictable resource needs. They cover a wide range of hardware (e.g., vCPUs, memory GPUs, or local SSDs) or software licenses in a particular region.
Spend-based CUDs. These discounted rates offer flexibility in exchange for a minimum spending commitment for a range of Google Cloud products and services, including Compute Engine, Cloud SQL, Cloud Standard, Cloud VMware Engine, Cloud Run, and GKE.
9. What are some examples of how and when I should use the different types of CUDs?
Compute Engine customers commonly use a combination of both resource-based and spend-based CUDs. For their stable and predictable workloads, they use resource-based CUDs. Then, they layer in flexible spend-based CUDs for workloads that tend to fluctuate. Spend-based CUDs are a great option when you need more flexibility, such as migrating workloads or transitioning between machine families. They’re also a good option if you don’t want to be locked into a specific region or machine family.
10. What are other options to optimize my on-demand spend?
If you’re looking to optimize cloud costs, but you’re hesitant to commit for a year or more, you can always gradually increase your commitment overtime. Leverage these two built-in tools in your billing console for no cost to help optimize your on-demand spend:
CUD analysis dashboard. This dashboard provides immediate and long-term trend visibility into your on-demand usage. You can view how much you’re saving and how much of your commitment you’re using. You can leverage daily or even hourly granularity. Or you can view your on-demand trends over multiple years.
CUD recommendations. With a one-button click, view machine learning based CUD recommendations based on 30 days of historical usage.
Whichever billing tools you choose, we encourage you to leverage the Cloud FinOps resources that will help your organization drive innovation, accelerate business value, and meet your business objectives.
Stay tuned for more on this and other Cloud FinOps topics, including billing tools aligned to the Operate pillar. And join us every other week for our newest episode of Framing Up FinOps on Twitter Spaces. For further information, check out two white papers on the topic: