Monitor applications on GKE Autopilot with the GKE Dashboard
John Day
Product Marketing Manager, Google Cloud
Elite software development teams automate and integrate monitoring observability tools more frequently than lower performing teams, per the Accelerate: State of DevOps report. Organizations that need the highest levels of reliability, security, and scalability for their applications choose Google Kubernetes Engine (GKE). Recently we introduced GKE Autopilot to further simplify Kubernetes operations by automating the management of the cluster infrastructure, control plane, and nodes. However, while the infrastructure management is automated, you still need to monitor and troubleshoot the applications which run on your Autopilot clusters. For those who are developing and running applications using GKE Autopilot, the GKE Dashboard from Cloud Monitoring automatically ingests and displays metrics and logs to make monitoring and troubleshooting easier. The GKE Dashboard is a powerful tool that presents observability data and rich associated context in an easy to understand format.
Observability data is automatically available
All GKE Autopilot clusters are configured to send metrics and logs to Google Cloud’s operations suite without requiring any work from you. As a result, when you navigate to the GKE Dashboard, you will see your Autopilot clusters, namespaces, nodes, workloads, services, pods and containers displayed alongside all of your other GKE deployments. You get a holistic view of information including metrics, logs, events, alerts, incidents and SLOs.

The GKE Dashboard, where metrics and logs from Autopilot and standard GKE clusters are displayed
Observability in context
Google Cloud’s logging and monitoring tools are deeply integrated with GKE, enabling direct links to all of the resources being monitored to be built into the dashboards. Going from the contextual dashboards to the logs is also easy. Clicking on the graphs in the tables will bring up a side panel that lists all of the logs for the selected resource.
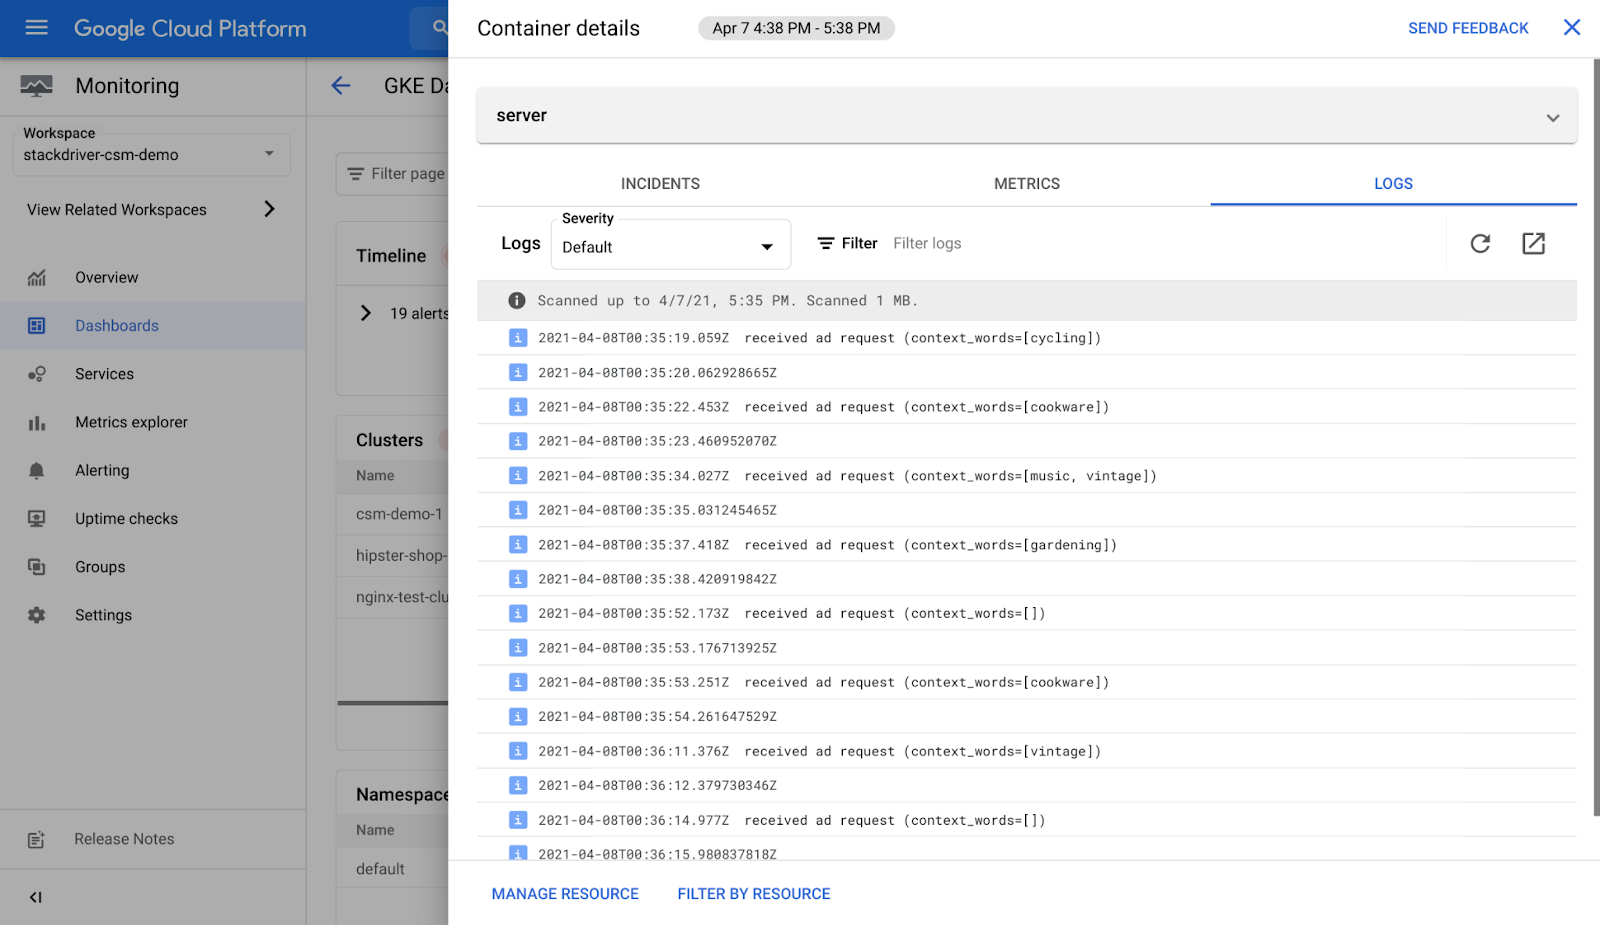
View logs within the GKE Dashboard just by clicking on a resource
For deeper analysis, you can go to the Logs Explorer and the Metrics Explorer.
Common scenarios for monitoring and logging with GKE Autopilot
With Autopilot, Google SRE is handling cluster management as well as managing your nodes, including operations such as provisioning, maintenance, and lifecycle management. Autopilot offers an SLA on hosts, the control plane, and in an industry first, pods. Since the infrastructure and operations automated, you can focus your attention on the applications themselves.
Setting SLOs for your applications
Using Cloud Monitoring you can create Service Level Objectives (SLOs) for Service Level Indicators (SLIs) to measure how you perform against goals. SLIs are performance indicators that you define based on availability, latency, or other custom defined metrics.
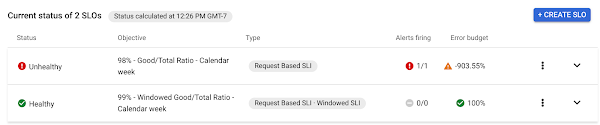
Example of SLO status in a service
Troubleshooting
For modern, container-based applications, developers, DevOps and SRE teams are taking on more responsibility for ensuring the successful operation of their services. So when you are experiencing incidents you may need to ensure that the infrastructure is not causing an issue. This is where the GKE Dashboard, with it’s at-a-glance look across your GKE Autopilot and standard resources can help you check off potential causes of service interruptions before you look into the application itself.
Get started today
Metrics and logs from GKE Autopilot are automatically imported into Cloud Logging and Cloud Monitoring so you can get started without needing to install or configure anything. Navigate directly to the GKE Dashboard in Cloud Monitoring to view your Autopilot metrics and logs or visit the documentation page for more information.