Analyze your GKE and GCE logging usage data easier with new dashboards
Charles Baer
Product Manager, Google Cloud
System and application logs provide crucial data for operators and developers to troubleshoot and keep applications healthy. Google Cloud automatically captures log data for its services and makes it available in Cloud Logging and Cloud Monitoring. As you add more services to your fleet, tasks such as determining a budget for storing logs data and performing granular cross-project analysis can become challenging. That’s why today we’re proud to announce a set of open source JSON dashboards that can be imported into Cloud Monitoring to help you quickly analyze logging volumes, logs-based metrics and information about your logging exports across multiple projects.
The dashboards we are releasing today include:
- Logging management dashboard
- GKE logging usage
- GCE logging usage
- Cloud SQL logging usage
Logging Management dashboard
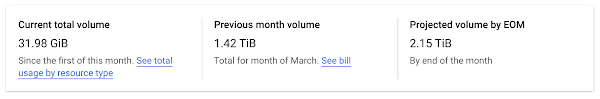
The Logs Storage section of the Cloud Console provides a summary of logging usage data for an individual project including the current total logging volume, previous billed volume and a projected volume estimate for the current month.
While this aggregate level is sufficient for those who just need a high-level view of their usage, you may need to analyze logging usage data across multiple projects or investigate your logging data at a more granular level.
The Logging Management dashboard provides that aggregation for any projects included in your Cloud Monitoring Workspace so you are not limited to analyzing just one project at a time.
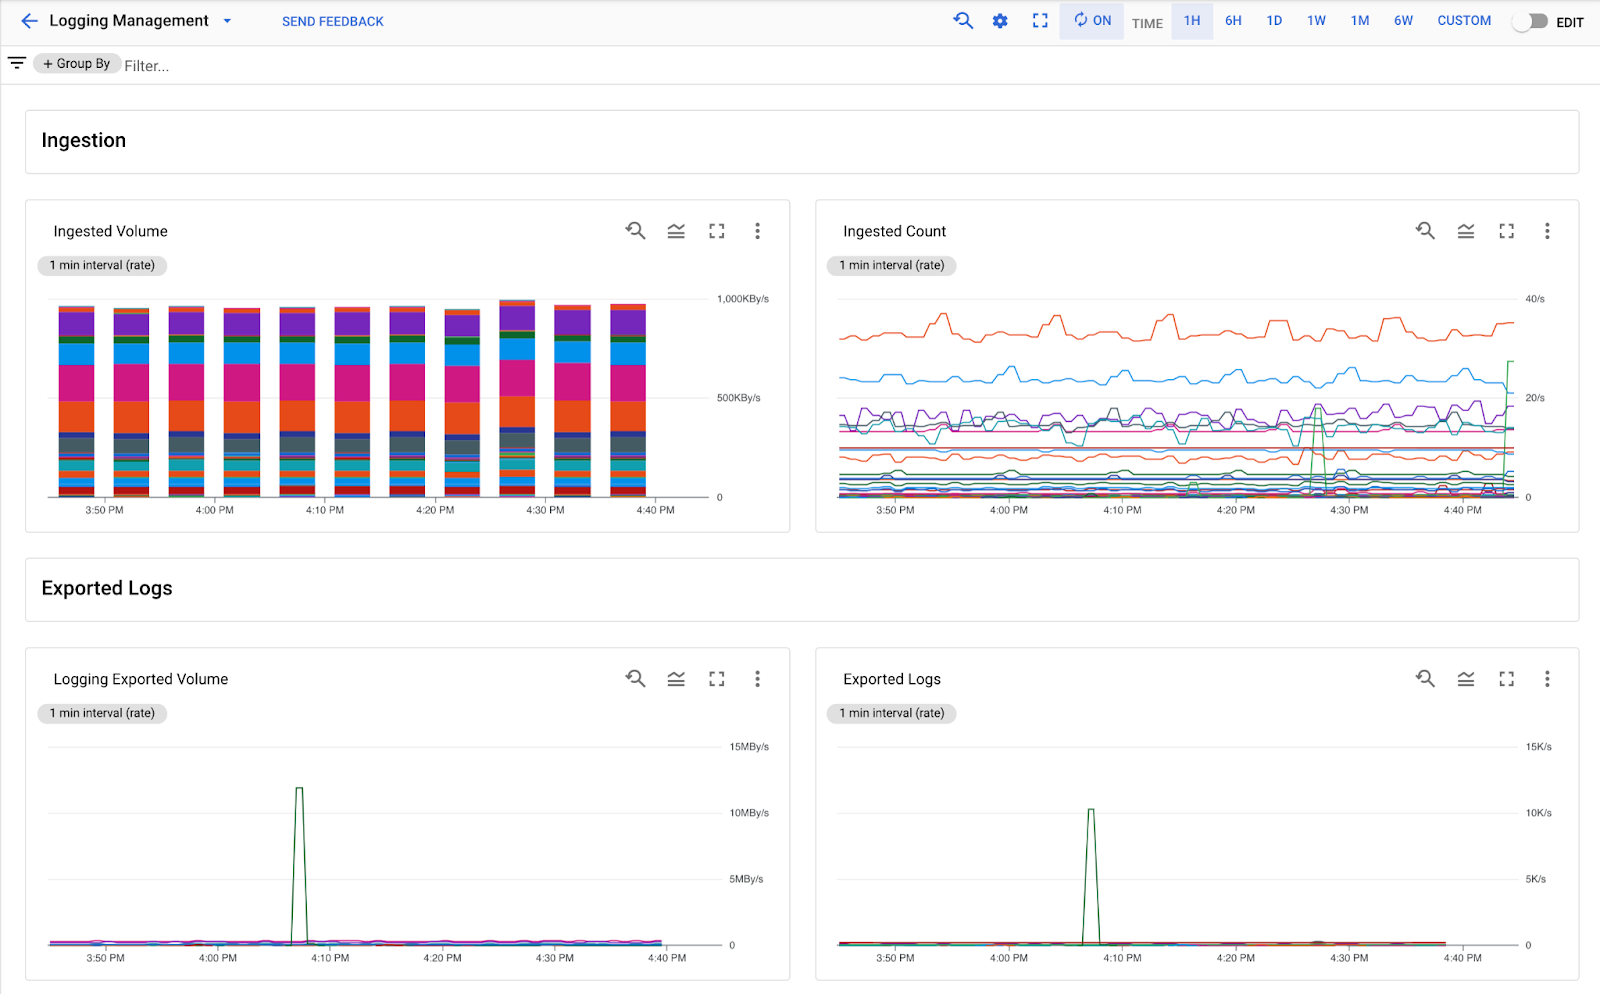
Using standard filters that are available in Cloud Monitoring, you can refine the data to do a more granular analysis, such as display a specific project, log name or log severity.
For example, errors tend to provide the most critical signals for applications, and filtering the charts to include just error logs may help identify specific projects and resources to investigate.
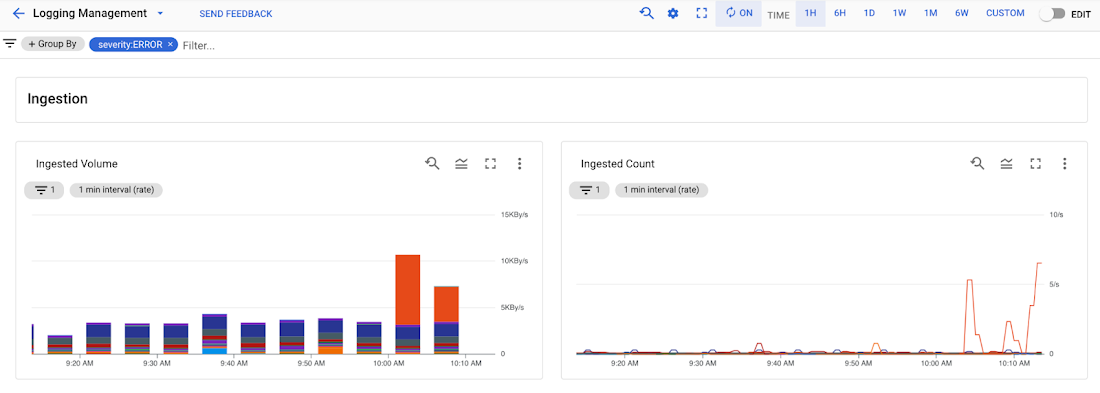
A filtered view of the ingested error logs in the Logging Management dashboard
Logging Usage – Kubernetes dashboard
The Logging usage dashboard for GKE provides an aggregated view of logging metrics for any GKE clusters running in projects included in your Cloud Monitoring Workspace. The views are grouped by cluster, container, pod and namespace.
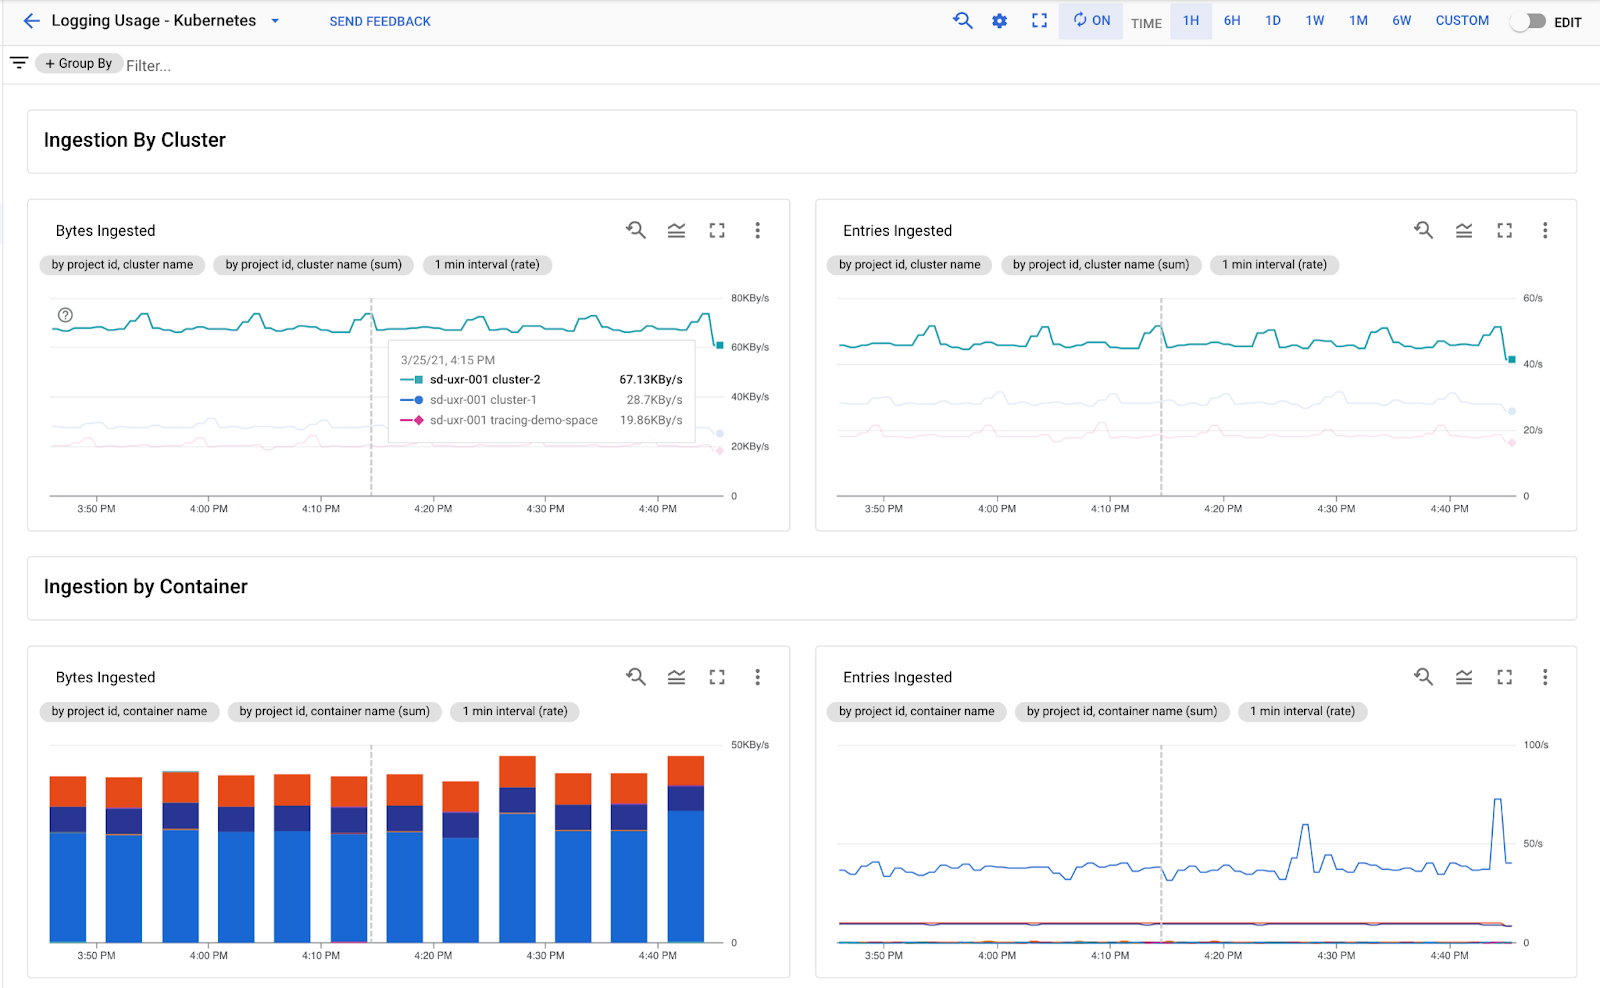
A view of a subset of the tables available in the GKE logging usage dashboard in Cloud Monitoring
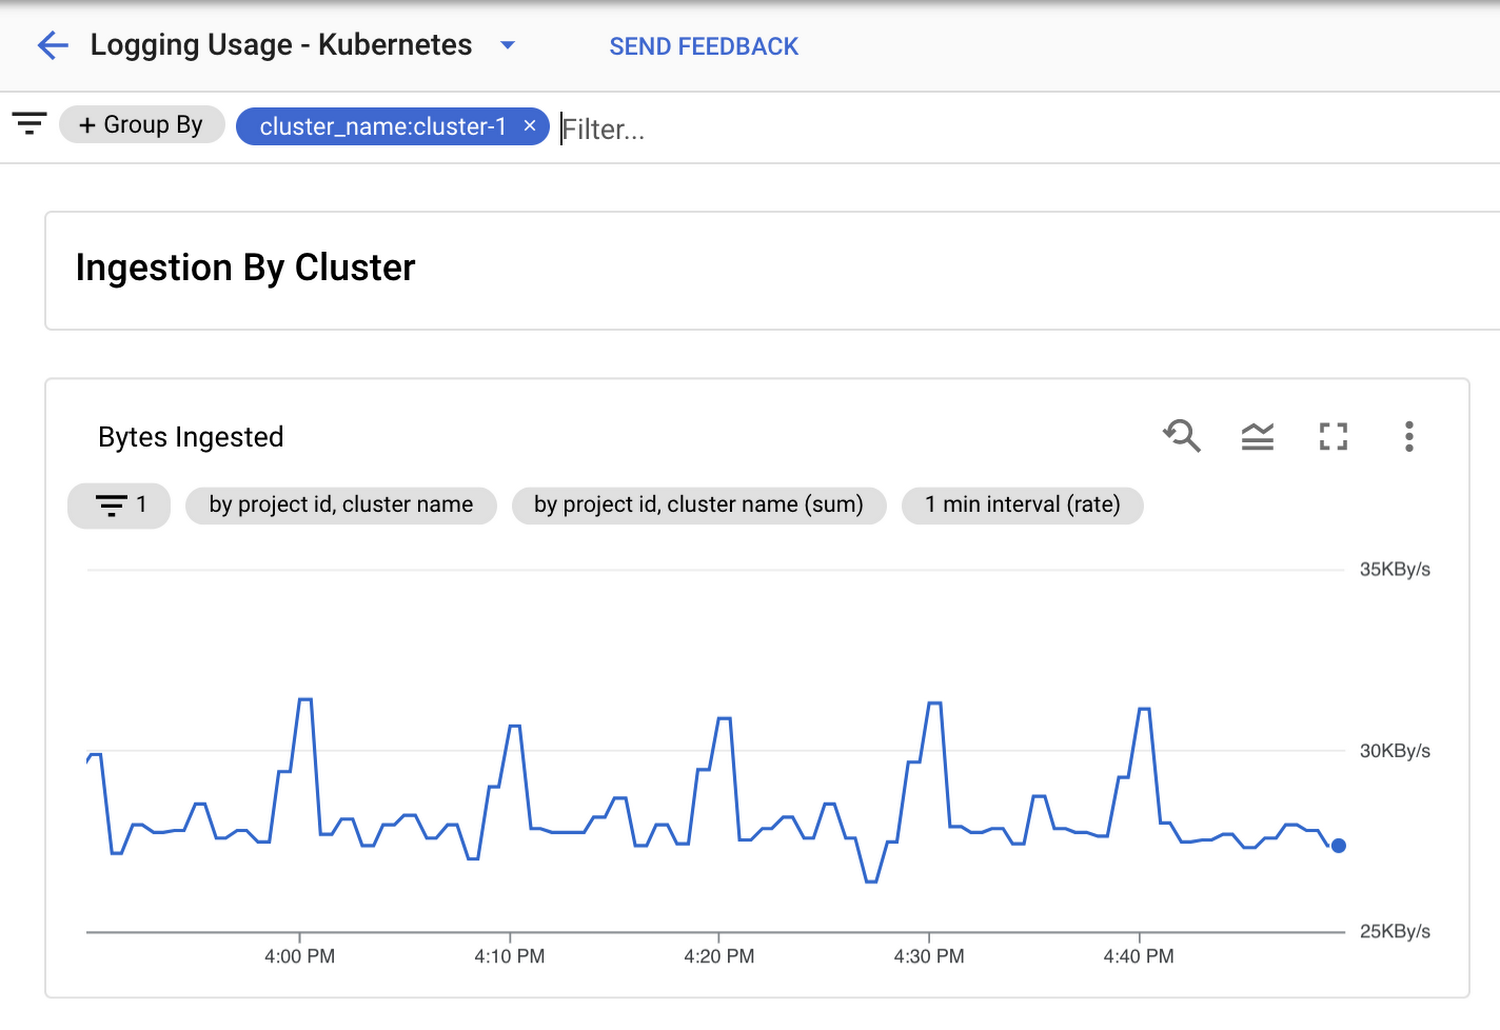
Using this dashboard, you can filter the dashboard by resource to understand the logging metrics for the specific Kubernetes resource. For example, filtering by cluster_name scopes all the charts in the dashboard to the Kubernetes containers, pods and namespaces running in the selected GKE cluster.
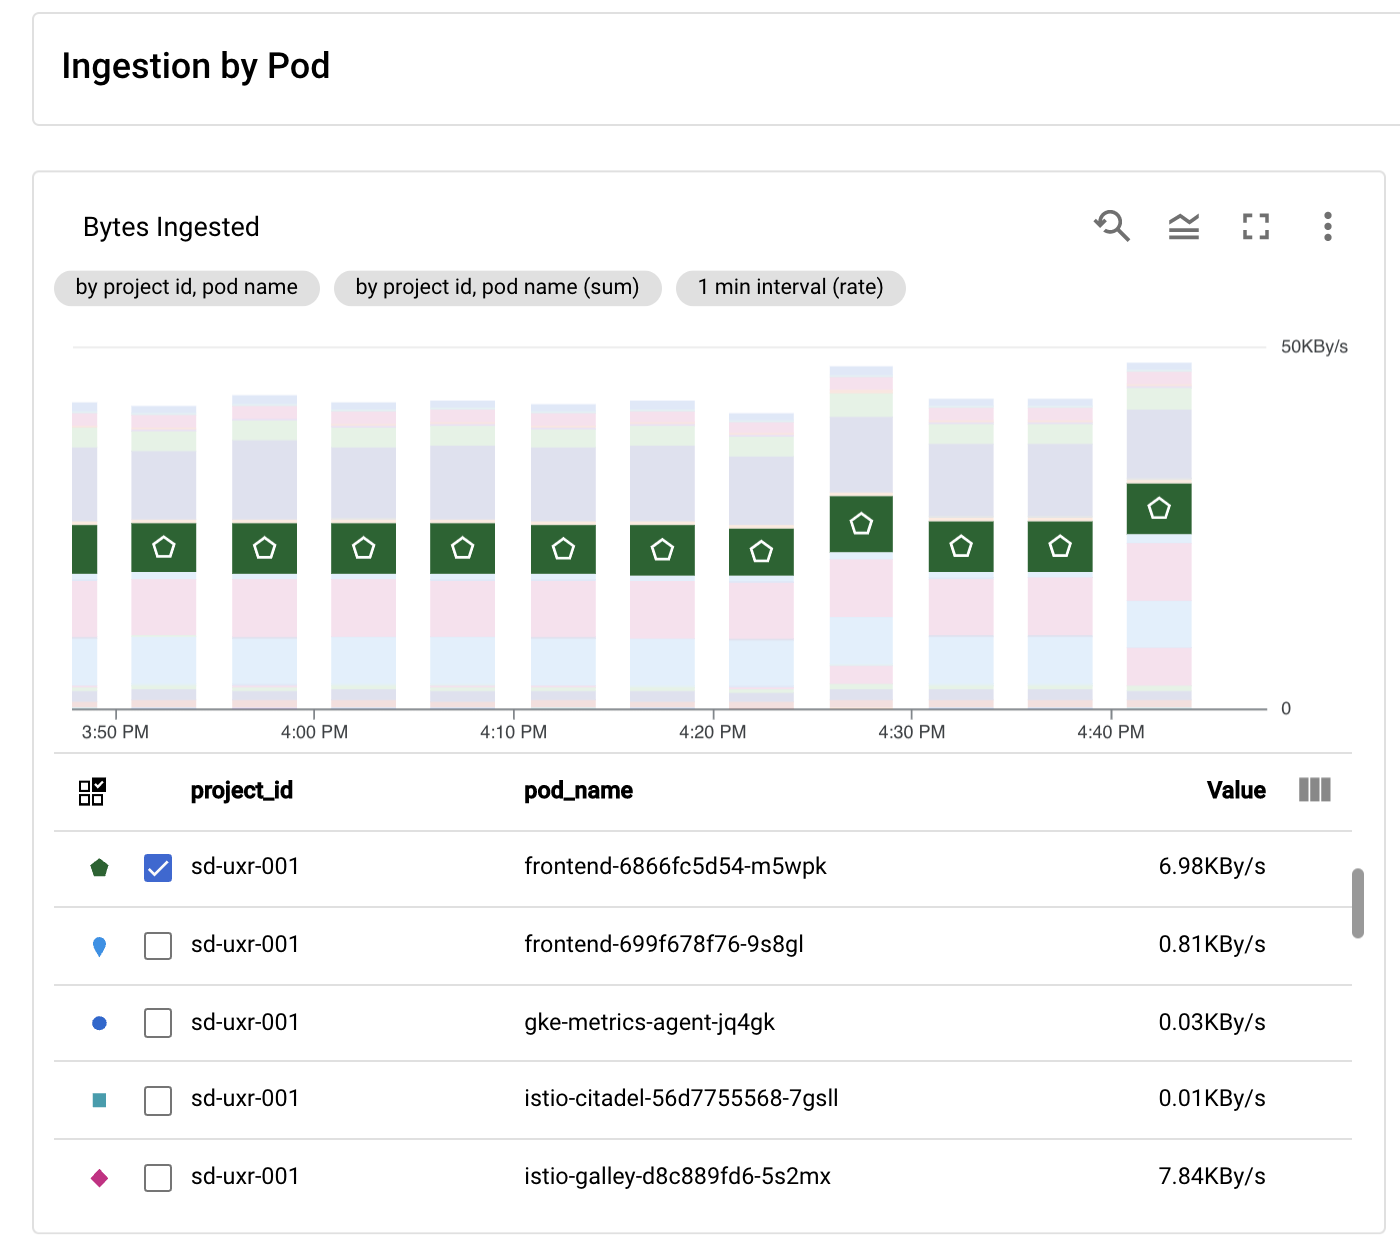
By expanding the chart legend, you can also filter the chart to the selected resources. In the example below, the volume of logs ingested is displayed specifically for the selected resource in the specific Pod.
The logging usage dashboard is a logging management complement to the GKE Dashboard in Cloud Monitoring, which we rolled out last year. The GKE Dashboard provides detailed information about metrics and error logs to use for troubleshooting your services.
Logging usage- GCE & other dashboards
The github repo includes other dashboards built specifically for services like Compute Engine and Cloud SQL.
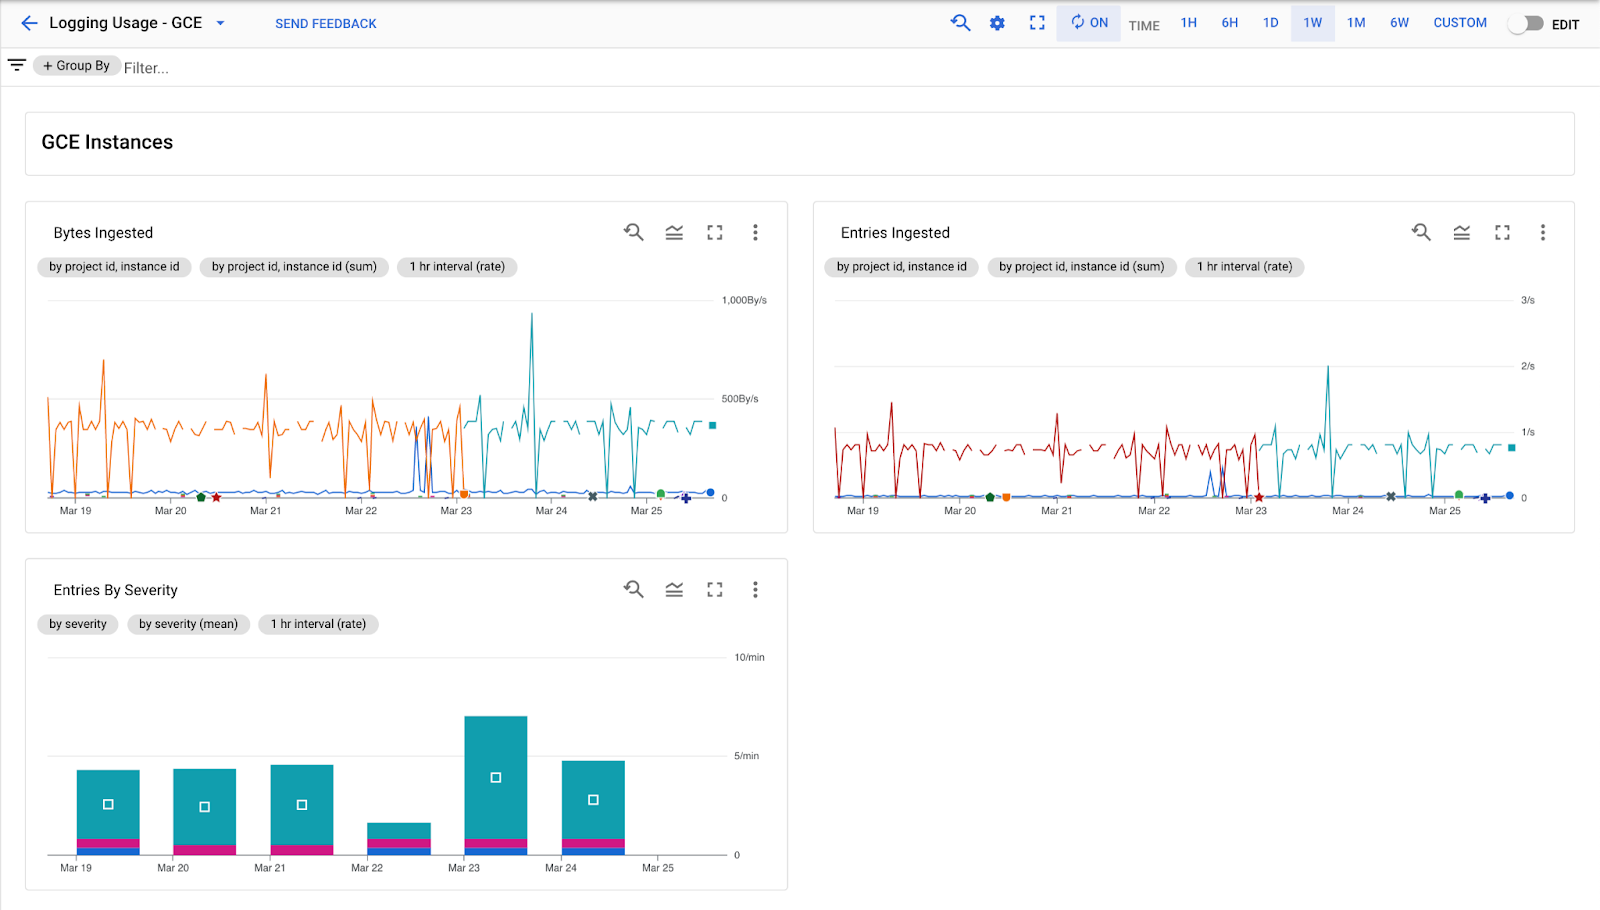
A top-level view of the tables available in the GCE logging usage dashboard
Set alerts and customize further
While you can analyze important usage metrics for Cloud Logging projects in aggregate or filter to specific logs, to take full advantage of the capabilities of Cloud Monitoring, you can also set proactive alerts on the underlying metrics in the dashboards. Alerts can be set on any metric, such as logging usage volumes or errors, so you are notified when they exceed your specified threshold.
Additionally, any of the dashboards can be further customized with our new Monitoring Dashboard builder and if you’re willing to share what you’ve created, send us a pull request against the Monitoring dashboard samples github repo.
Learn more about Cloud Logging
Get started today with the Log Explorer, learn more about Cloud Logging with our qwiklab quest and join us in our discussion forum. As always, we welcome your feedback.