Stackdriver Profiler adds more languages and new analysis features
Morgan McLean
Product Manager
Alexey Alexandrov
Tech Lead and Manager
Historically, cloud developers have had limited visibility into the impact of their code changes. Profiling non-production deployments doesn’t yield useful results, and profiling tools used in production are typically expensive, with a performance impact that means that they can only be used briefly and on a small portion of the overall code base. Code that’s not performing well can add latency and slow down an application without anyone noticing. Stackdriver Profiler, part of Google Cloud’s Stackdriver monitoring and logging tool, lets you understand the performance impact of your code, down to each function call - without sacrificing speed. We’ve added new language and platform support for Profiler, along with weighted filtering and other new filters.
Profiler launched to public beta last spring and it’s been critical when it comes to cost optimization for many developers using Google Cloud Platform (GCP). In particular, we’ve heard from customers that they like the continual insight into their code’s execution, and the cost and performance improvements that they achieve once Profiler is deployed. We’ve heard from multiple enterprise users that they’ve achieved double-digit compute savings with just over one hour of analysis with Profiler. Others discovered the sources of slow memory leaks that they’d previously been unable to identify.
Game developer Outfit7 has already achieved success with Stackdriver Profiler: "Using Stackdriver Profiler, the backend team at Outfit7 was able to analyze the memory usage pattern in our batch processing Java jobs running in App Engine Standard, identify the bottlenecks and fix them, reducing the number of OOMs from a few per day to almost zero,” says Anže Sodja, Senior Software Engineer at Outfit7 Group (Ekipa2 subsidiary). “Stackdriver Profiler helped us to identify issues fast, as well as significantly reducing debugging time by enabling us to profile our application directly in the cloud without setting up a local testing environment."
New features and support now available for Profiler
Since the beta release, we’ve made Stackdriver Profiler even better by adding support for more runtimes and platforms, and adding powerful new analysis features. These include:
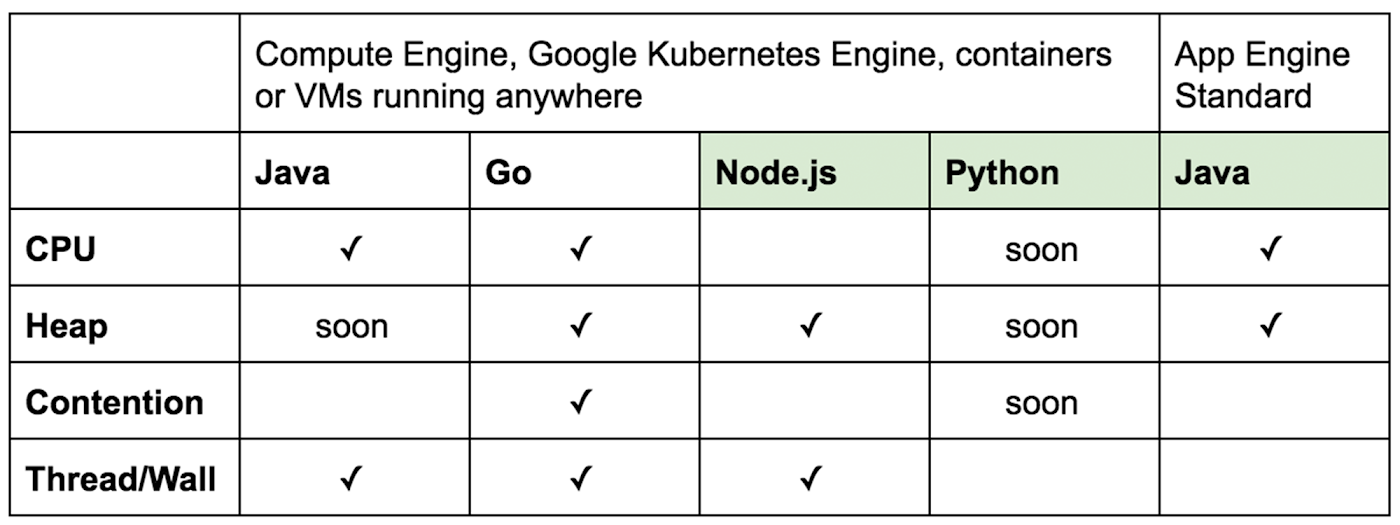
- Support for Node.js, Python (coming soon), and App Engine Standard Java
- Analyzing worst-case performance
- Identifying commonly called functions that have a high aggregate impact
Stackdriver Profiler launched with support for Java CPU profiling, and Go CPU and heap profiling. Since then, we’ve added instrumentation for Node.js, Python, and the App Engine Standard Java runtime. Here’s a quick look at the available environments:
It’s incredibly easy to get started with Profiler; at most, you’ll have to add a library to your application and redeploy. You can find setup guides for all languages and platforms in the Profiler documentation.
If you have Java code deployed to App Engine Standard, getting started with Profiler is even easier. Simply enable it in your appengine-web.xml or app.yaml file, and then click on Stackdriver Profiler in the Cloud Console to see how your code is running in production.
Analyzing worst-case performance with Profiler
Many workloads can be characterized as having bursts or spikes of high resource consumption and poor performance. Stackdriver Profiler’s new weighted filtering functionality allows you to find out what’s causing these spikes so you can smooth them out and improve your customers’ experience with your applications.
Understanding the average resource consumption of your code is incredibly useful during development or when you’re trying to reduce compute spend. However, this isn’t as useful when you’re trying to improve performance. This is where Profiler’s weighted filtering feature comes in.
By applying the Weight filter, you can instruct Stackdriver Profiler to only analyze telemetry captured when your application was consuming its peak amount of resources. For example, if you select “Top 10% weight” when inspecting CPU time, Profiler will only analyze data captured from periods when CPU consumption was at its top 10%. The remaining 90% of data captured when CPU consumption was relatively lower will be ignored. Here’s what this looks like:
Identifying high-aggregate impact functions
In addition, Stackdriver Profiler now includes a list of all of the functions captured within a profile, along with their total aggregate cost. The flame graph that’s currently presented by Profiler lets you quickly discover resource-hungry functions that are called from a single code path. However, it’s less helpful for identifying suboptimal functions that are called throughout your code and impact overall performance.
In the example below, we use this new function list to identify a commonly called logging process that is consuming 50% of the service’s CPU consumption. The impact of this function wasn’t necessarily obvious from looking at the flame graph alone.
To open this list, click on the magnifying glass button to the left of the filter bar, as shown above. This will apply the Focus filter to the selected function.
Exploring filters in Profiler
Along with the Weight filter, there are other filters in Profiler that let you view details of your code to find issues.
Focus
Along with using the function list, you can access the Focus filter view by entering “Focus” into the filter bar, or from the tool tip displayed when mousing over a function in the flame graph. Focus reflows the flame graph to show all of the code paths that flow to and from the focused function, along with their relative resource consumption. It’s great for visualizing the impact of a commonly called function or for understanding which ways a particular piece of code gets called.
Show Stacks
A stack refers to a vertical set of functions on the flame graph, which represent a call path through a code base.
The Show Stacks filter presents a similar view to Focus, with a few key differences. While Focus combines all of the instances of the selected function to show the code paths that flow in and out of it, Show Stacks simply filters the view to remove any stacks that don’t contain the selected function. This is useful when you want to preserve separate instances of a specific function and don’t want to change the structure of the flame graph.
Hide Stacks
This filter is similar to Show Stacks, except it removes stacks that match the specified function name. Hide Stacks is often useful for hiding information about uninteresting threads in Wall profiles of Java programs. For example, adding a “Hide stacks: Unsafe.park” filter is rather common.
Show From Frame
Like the Focus filter, this combines all instances of the selected function and shows the aggregated set of paths leaving that function. Unlike Focus, it does not show the code paths that lead into a function.
Also, unlike Focus, it can match several functions, and all of the matching functions will be shown as roots of the flame graph. This filter is useful to focus on a subset of functions (for example, a specific library) to dive into its performance aspects. For example, adding a “Show from frame: com.example.common.stringutil” might be a useful way to limit the view to the string utility functions used across the code base.
Hide Frames
This filter removes functions that match the specified name. It is commonly used to hide unimportant stack frames, such as using “Hide frames: java.util” to emphasize application code on the flame graph.
Highlight
The Highlight filter allows you to quickly identify the location of a given function in the flame graph without changing the graph itself. Think of it as Ctrl+F for function names within a profile.
Weight
As discussed earlier, this filter allows you to only analyze profiles captured when the selected resource (CPU, heap, etc.) was at peak consumption.
Let us know what you think of Profiler
We’re excited to make Stackdriver Profiler more useful for more developers, and we have some bigger announcements in the works. Until then, send your feedback via our ongoing user survey (you’ll see a notification for it at the bottom of your screen when you open Profiler) or other channels. And consider taking Profiler’s Quickstart or codelab to get started.