Setting SLOs: a step-by-step guide
Cindy Quach
Site Reliability Engineer
Are you responsible for a customer-facing service? If you are, you know that when that service is unavailable, it can impact your revenue. A lengthy outage could drive your customers to competitors. How do you know if your customers are generally happy with your service? If you follow site reliability engineering (SRE) principles, you can measure customer experience with service-level objectives (SLOs). SLOs allow you to quantifiably measure customer happiness, which directly impacts the business.
Instead of creating a potentially unbounded number of monitoring metrics, we suggest using a small number of alerts grounded in customer pain—i.e., violation of SLOs. This lets you focus alerts on scenarios where you can confidently assert that customers are experiencing, or will soon experience, significant pain.
Here we’ll walk through a hands-on approach for coming up with SLOs for a service and creating real dashboards and alerts.
Setting SLOs for an example service
We’re going to be creating SLOs for a web-based e-commerce app called “Online Boutique” that sells vintage items. The app is composed of 10 microservices, written in a variety of languages and deployed on an Istio-installed Google Kubernetes Engine (GKE) cluster.
Here’s what our architecture looks like:
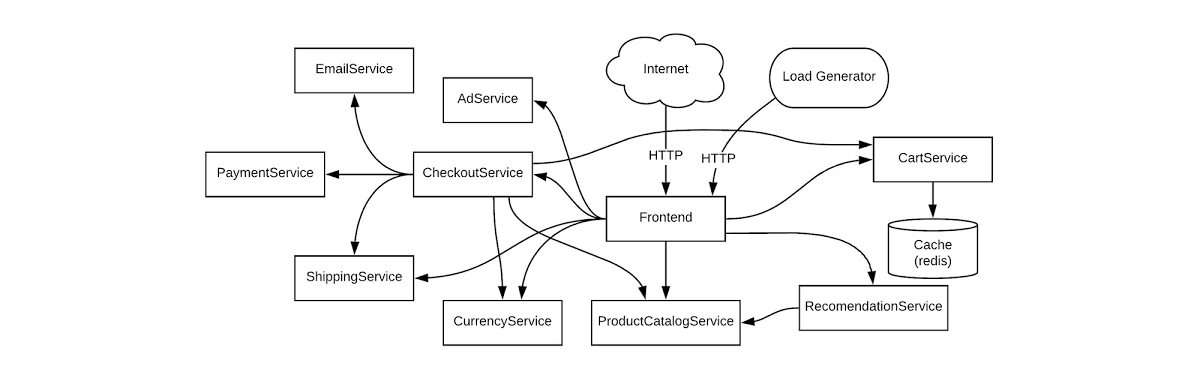
This shop has a front end that exposes an HTTP server to serve the website, a cart service, product catalog, checkout, and various other services. Our service is pretty complex and we can easily get into the weeds trying to figure out what metrics we need to monitor. Fortunately for us, using SLOs, we can drill down to monitor the most important aspects of our service using an easy step-by-step approach. Here’s how to determine good SLOs:
SLO process overview
List out critical user journeys and order them by business impact.
Determine which metrics to use as service-level indicators (SLIs) to most accurately track the user experience.
Determine SLO target goals and the SLO measurement period.
Create SLI, SLO, and error budget consoles.
Create SLO alerts.
Step 1: List out critical user journeys and order them by business impact
The first step in SLO creation is listing critical user journeys for this business. A critical user journey describes a set of interactions a user has with a service to achieve some end result. So let’s look at a few of the actions our customers will be taking when they use the service:
Browse products
Check out
Add to cart
Next, let’s order these items by business impact. In this case, as an e-commerce shop, it’s important that customers can complete their purchases. Look at user journeys that directly affect their ability to do so.
So the newly prioritized list is going to look like this:
Check out
Add to cart
Browse products
You may be wondering why “browse products” is at the bottom of this list. Shouldn’t it be a dependency of the other two items, thus making it more important? You would be correct; it is a dependency of the other two items. However, users can come to your site and browse products all day long, but that doesn’t mean they want to buy anything. When they go through the checkout flow, you now have a stronger indicator of an intent to make a purchase, so this portion of your service is very important to your business.
For the rest of this example, we’ll use the “Checkout” critical user journey as the basis for SLOs. Once you know how the process works, you can apply the same techniques to other critical user journeys.
Step 2: Determine which metrics to use as SLIs to most accurately track the user experience
The next step is to figure out which metrics to use as SLIs that will most accurately track the user experience. SLIs are the quantifiable measurements that indicate whether or not the service is working. We can choose from a wide range of indicators, such as availability (i. e., how many requests are succeeding), latency (i.e., how long a request takes), throughput, correctness, data freshness, etc.
The SLI equation can help quantify the right SLI for the business:
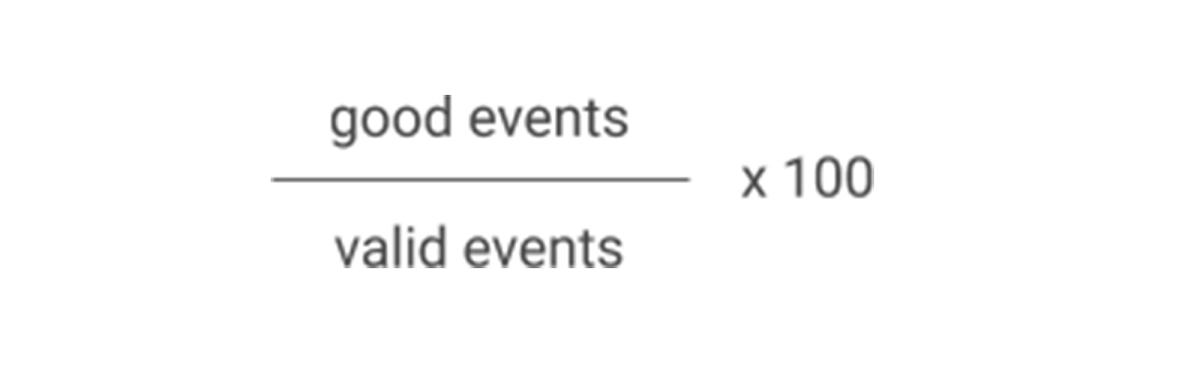
The SLI equation is the number of good events divided by the total number of valid events, multiplied by 100 to keep it a uniform percentage.
Let’s look at the SLIs we want to measure for the “Checkout” critical user journey. Picture the journey your customers take to buy a product from the store. First, they spend time browsing, researching items, adding the item to cart (maybe letting it sit there so they can think about it some more), then finally, when they are ready, they decide to check out. If you get this far with your customer, you can assume you’ve succeeded in gaining their business, so it is absolutely critical that customers are able to check out.
Here are the SLIs to consider for this user journey.
Availability SLI
We want the checkout functionality of our service to be available to our users, so we’ll choose an availability SLI. What we’re looking for is a metric that will tell us how well our service performs in terms of availability. In this case, we want to monitor how many users tried to check out and how many of those requests succeeded, so the number of successful requests is the ”good” metric. It’s important to detail what specifically we’re going to measure and where we plan on measuring it, so the availability SLI should look something like this:
The proportion of HTTP GET requests for /checkout_service/response_counts that do not have 5XX status (3XX and 4XX excluded) measured at the Istio service mesh.
Why are 3XX and 4XX status codes excluded? We don’t want to count events that don’t indicate a failure with our service because they will throw our SLI signals off, so we exclude 3XX redirects and 4XX client errors from our “total” value.
Latency SLI
You’ll also want to make sure that when a customer checks out, the order confirmation will be returned within an acceptable window. For this, set a latency SLI that measures how long a successful response takes. Here we’ll set a value of 500ms for a response to be returned, assuming that this is an acceptable threshold for the business. So the latency SLI would look like this:
The proportion of HTTP GET requests for /checkout_service/response_counts that do not have 5XX status (3XX and 4XX excluded) that send their entire response within 500 ms measured at the Istio service mesh.
Step 3: Determine SLO target goals and SLO measurement period
Once we have SLIs, it’s time to set an SLO. Service-level objectives are a target of service-level indicators during a specified time window. This helps to measure whether the reliability of a service during a given duration—for example, a month, quarter, or year—meets the expectations of most of its users.
For example, if there are 10,000 HTTP requests within one calendar month and only 9,990 of those return a successful response according to the SLI, that translates to 9,990/10,000 or 99.9% availability for that month.
It’s important to set a target that is achievable so that alerts are meaningful. Normally, when choosing an SLO, it’s best to start from historical trends and assume if enough people are happy with the service now, you’re probably doing OK. Eventually, it’s ideal to converge those numbers with aspirational targets that your business may want you to meet.
We can say that our SLO will be 99.9%, according to the historical data trends. Next, it’s time to put these words into real tangible dashboards and alerts.
Step 4: Create SLI, SLO, and error budget consoles
As engineers, we need to be able to see the state of the service at any time, which means we need to create monitoring dashboards. For customer-focused monitoring, we want to see graphs for SLIs, SLOs, and error budgets.
Most monitoring frameworks operate in very similar ways, so it’s up to you to decide which one to use. The basic components are generally the same. Breaking down the Checkout Availability SLI to generic monitoring fields would most likely look like this:
Metric Name: /checkout_service/response_counts
Filter:
Good filter: http_response_code=200
Total filter: http_response_code=500 OR http_response_code=200
Aggregation: Cumulative
Alignment Window: 1-minute interval
With a lot of elbow grease, you can calculate the right definitions needed to create SLI and SLO graphs. But this process can be pretty tedious, especially when you have multiple services and SLOs to create. Fortunately, the Service Monitoring component of Cloud Operations can automatically generate these graphs. Because we are using Istio service mesh integration in this example, observability into the system is even more accessible. Here’s how to set up a dashboard with Service Monitoring:
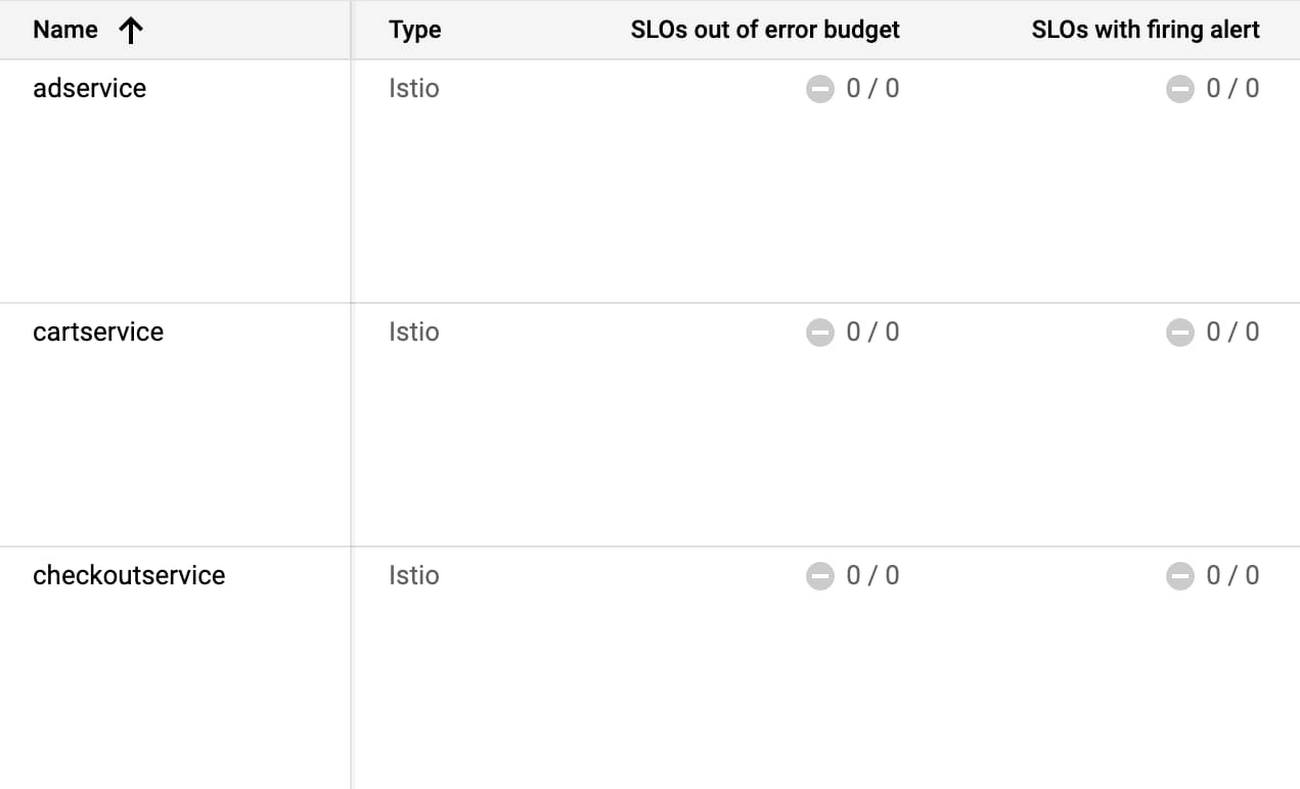
1. Go to the Monitoring page in Cloud Console and select Services
2. Since we’re using Istio, our services are automatically exposed to Cloud Monitoring, so you just need to select the checkout service.
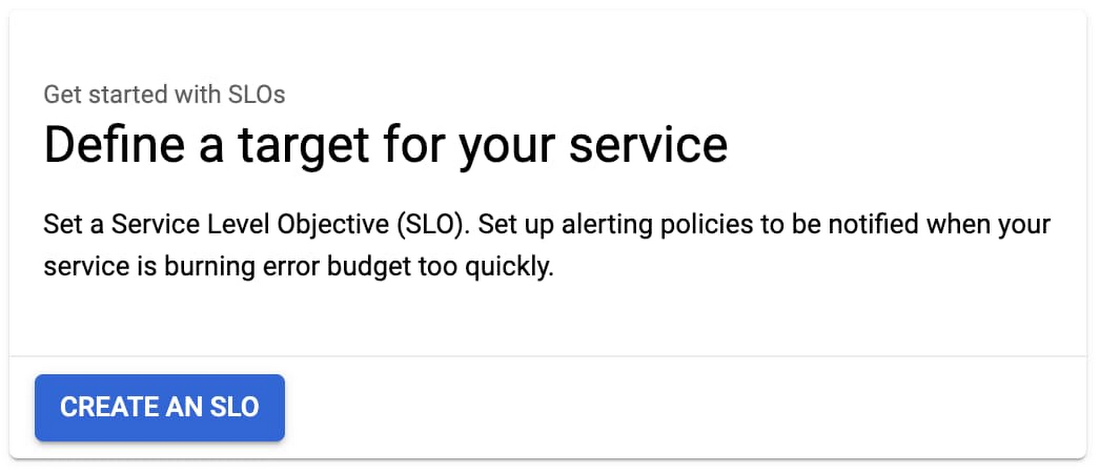
3. Select Create an SLO
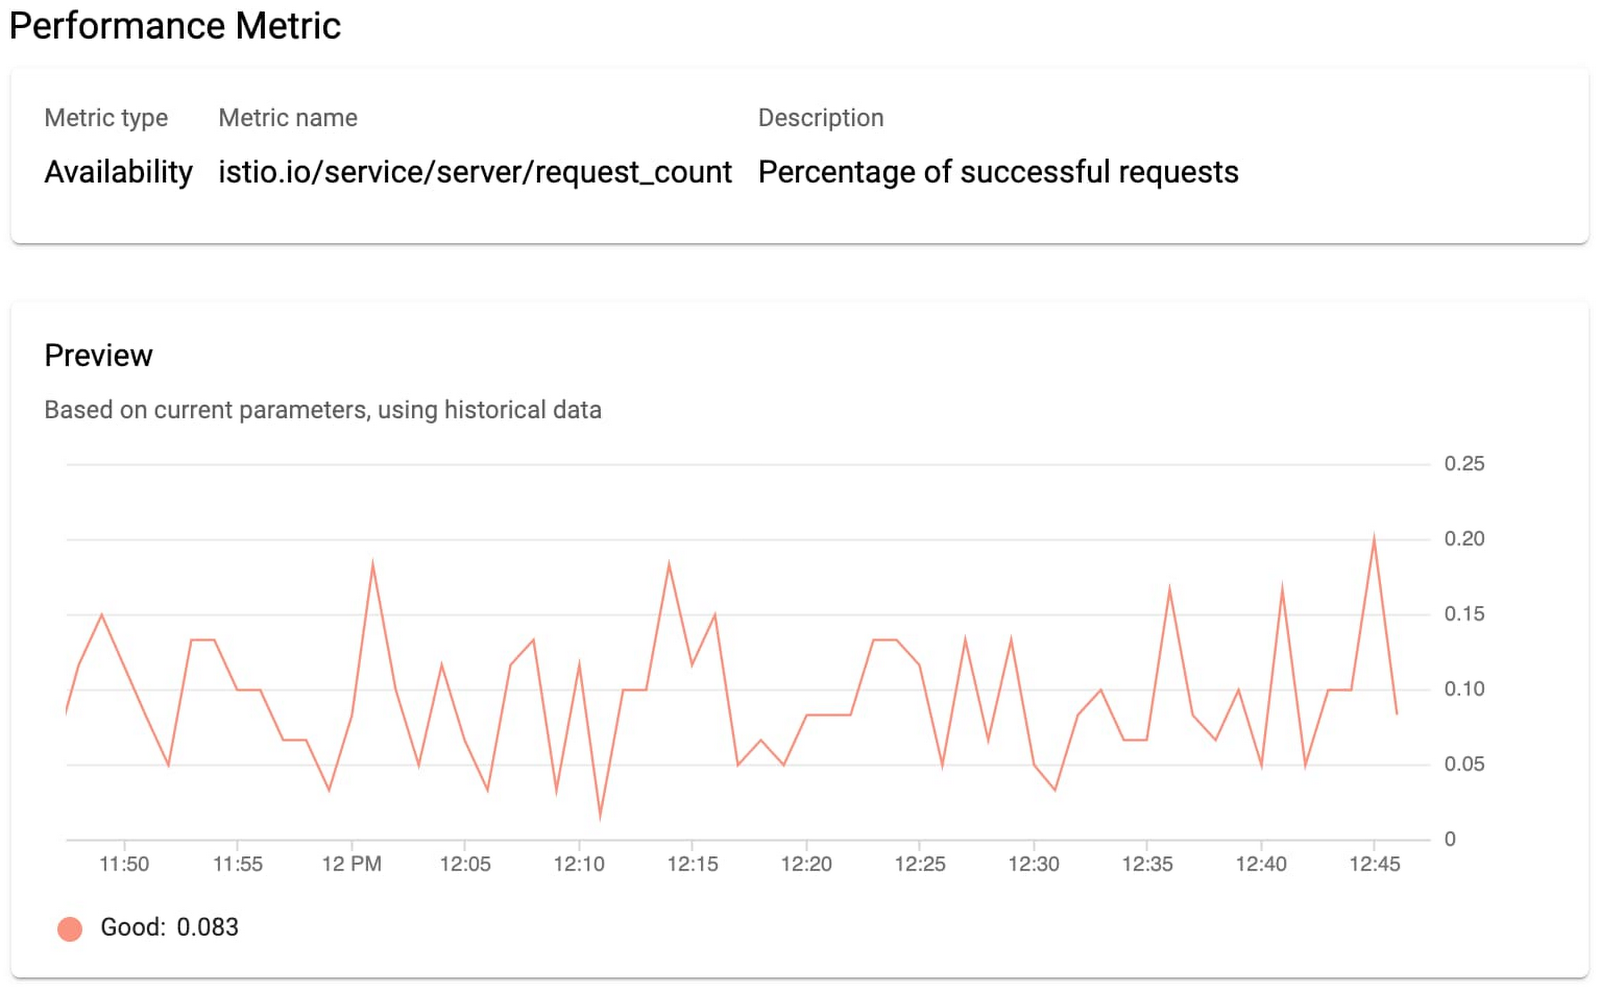
4. Select Availability and Request-based metric unit.
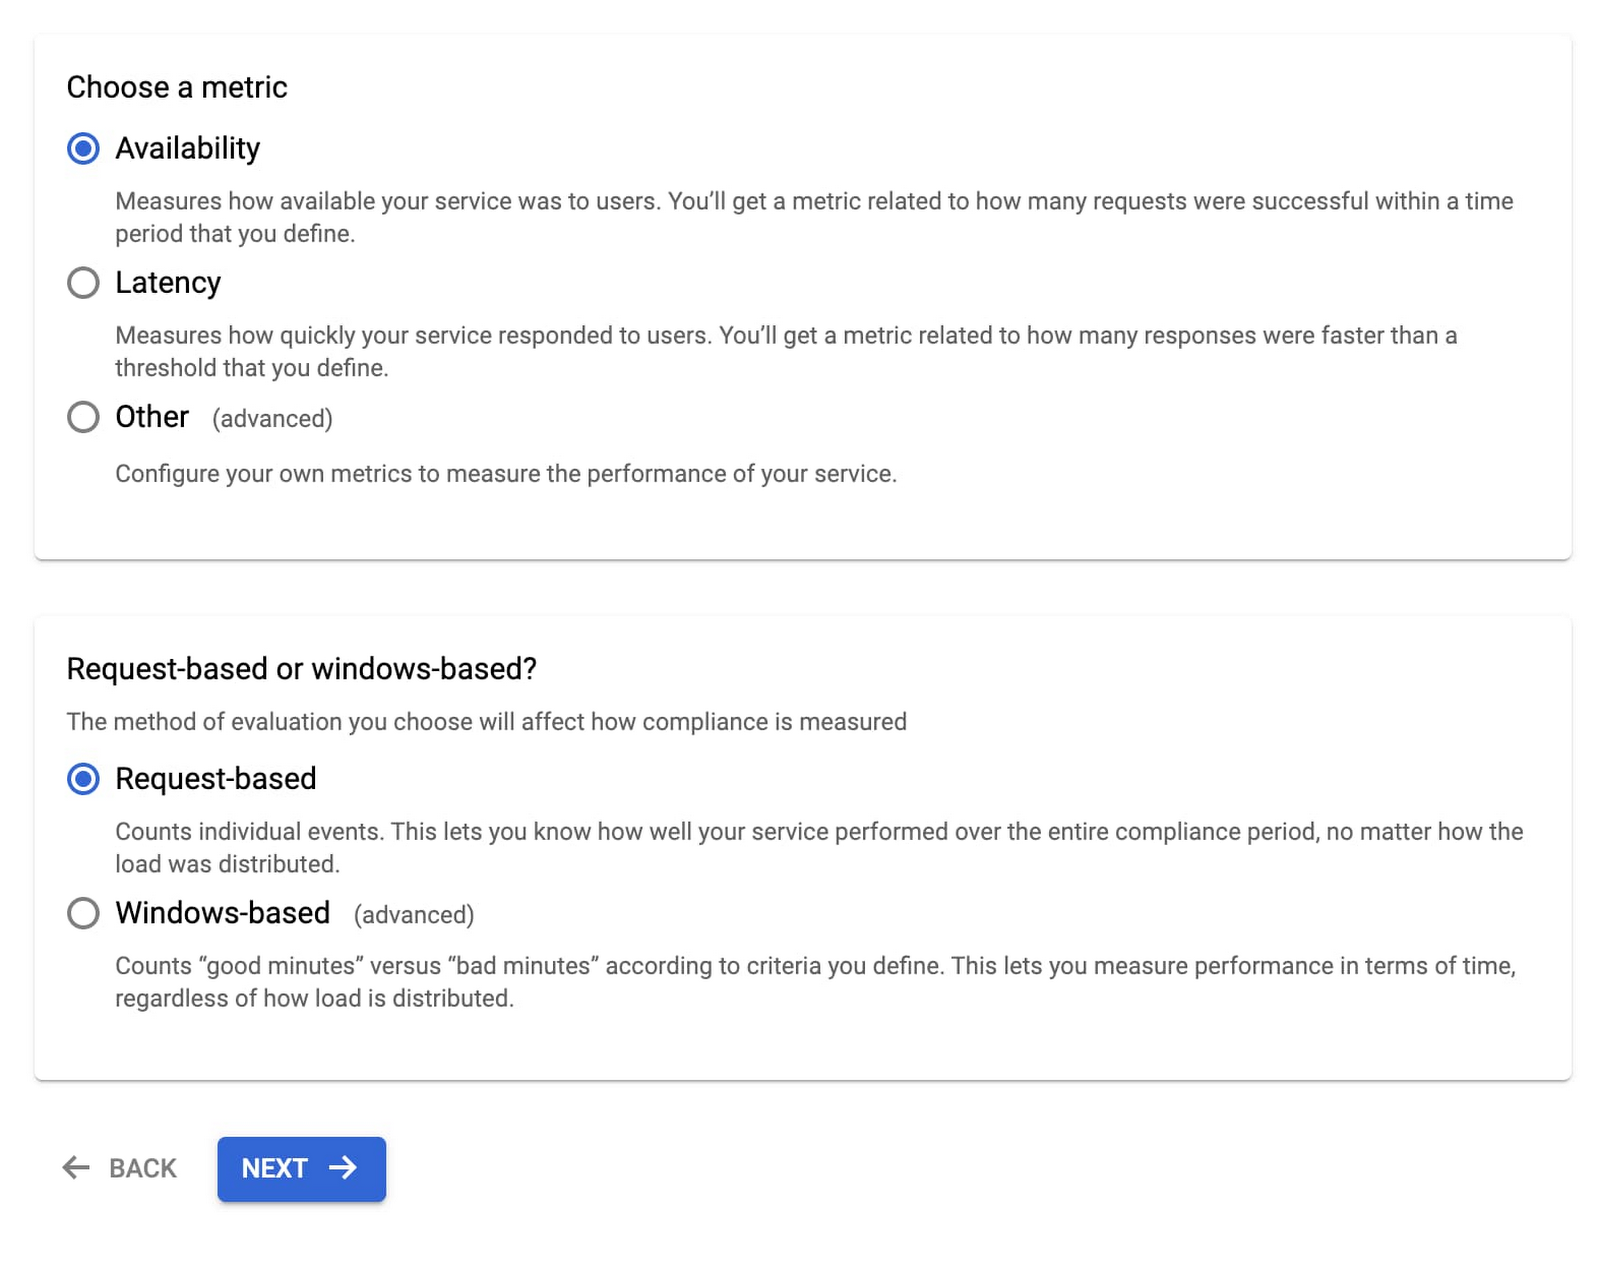
Now you can see the SLIs as well as details into what metrics we are using.
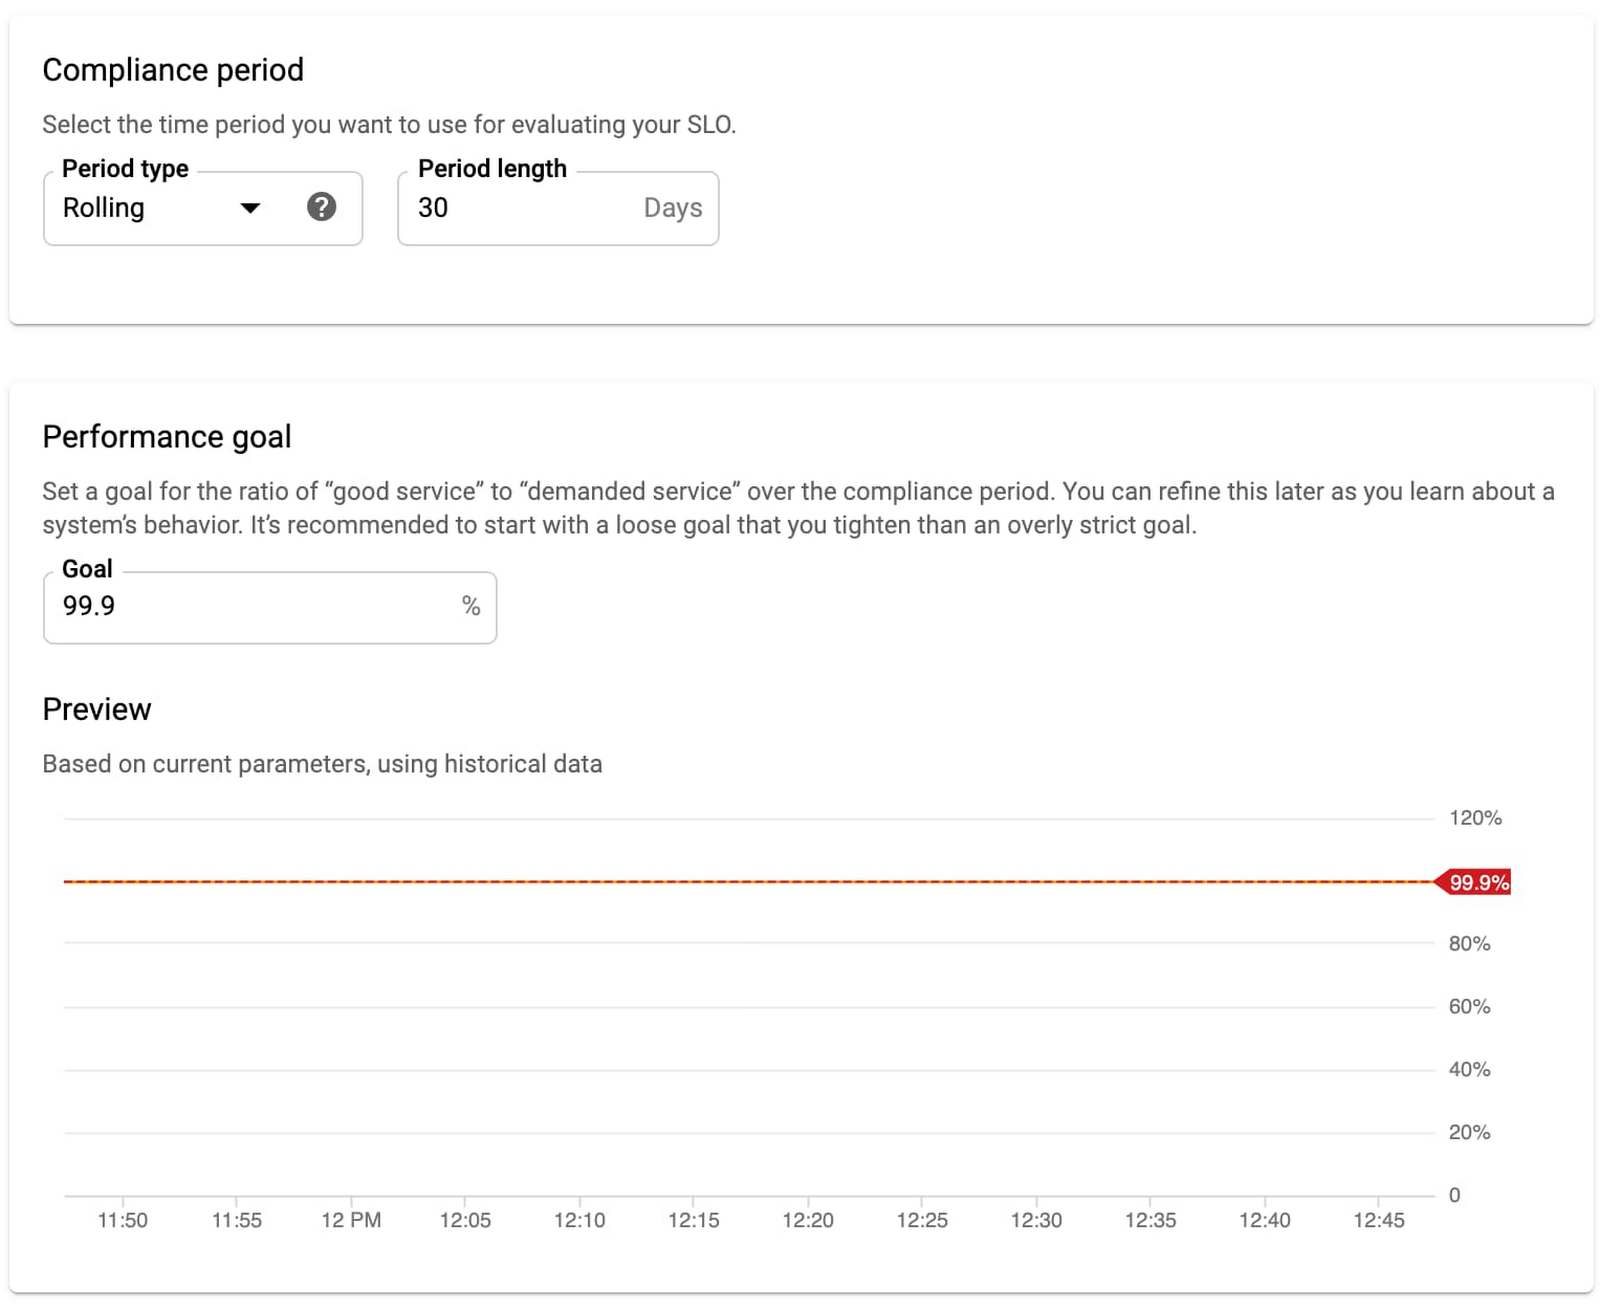
5. Select the compliance period. Here we’ll use a rolling window and a target of 30 days. Rolling windows are more closely aligned with user experience, but you can use calendar windows if you want your monitoring to align with your business targets and planning.
6. Select the previously set SLO target of 99.9%. Service Monitoring also shows your historical SLO achievements if you have existing data.
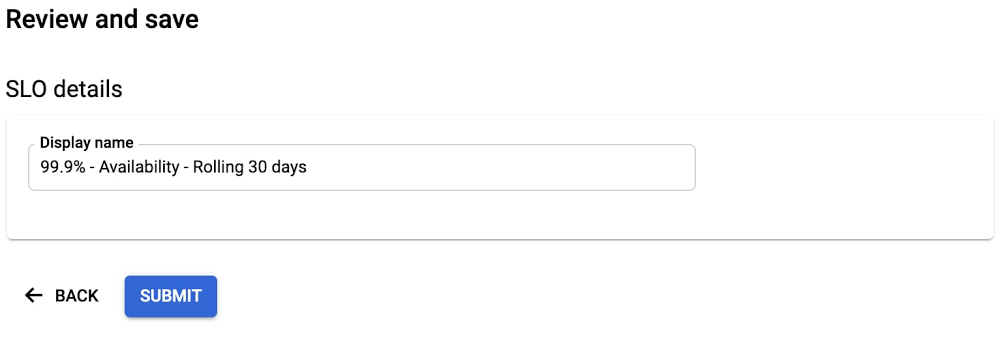
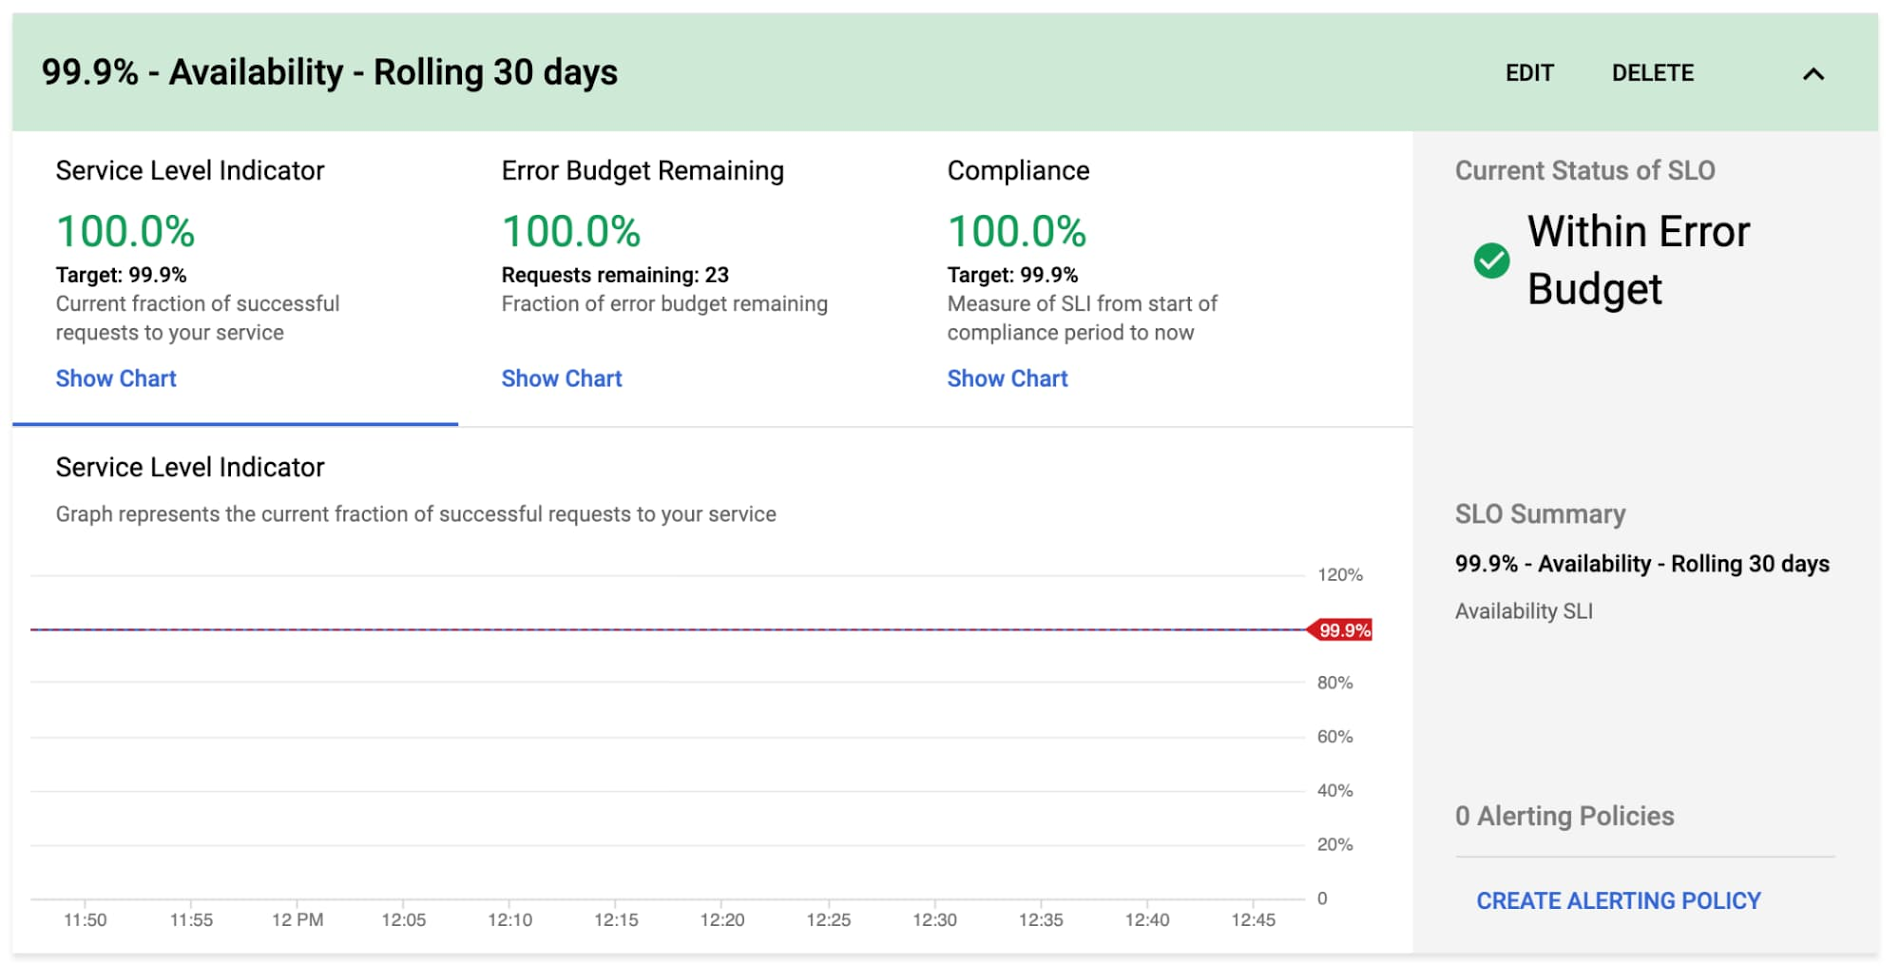
That’s it! Your monitoring dashboard is ready.
Once we’re done, we end up with nice graphs for SLIs, SLOs, and error budgets.
You can then repeat the process for the Checkout Latency SLI using the same workflow.
Step 5: Create SLO alerts
As much as we love our dashboards, we won't be looking at them every second of the day, so we want to set up alerts to notify us when our service is in trouble. There are varying preferences for which thresholds to use when creating alerts, but as SREs, we like using the error budget burn-based alerting.
Service Monitoring lets you set alerting policies for this exact situation.
1. Go to the Monitoring page in Cloud Console and select Services.
2. Select Set up alerting policy for the service you want to add an alerting policy for.
3. Select SLO burn rate and fill in the alert condition details.
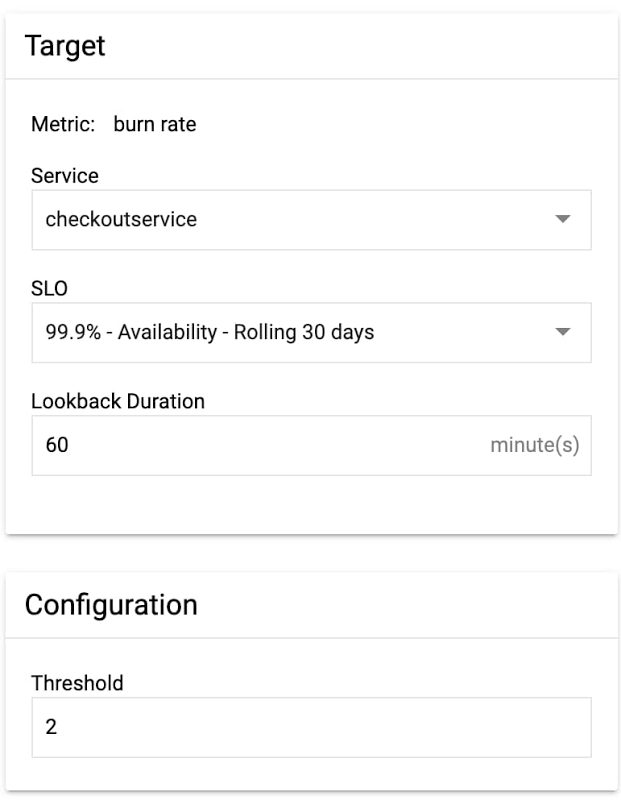
Here, we set a burn rate alert that will notify us when we burn our error budget at 2x the baseline rate, where the baseline is the error rate that, if consistent throughout the compliance period, would exactly use up the allotted error budget.
4. Save the alert condition.If you run a customer-facing service, following this process will help you define initial SLIs and SLOs. One thing to keep in mind is that your SLOs are never set in stone. It’s important to periodically review your SLOs every six to twelve months and make sure they still align with your users’ expectations and business needs or if there are other ways you can improve your SLOs to more accurately reflect your customer’s needs. There are many factors that can affect your SLOs, so you need to regularly iterate on them. If you want to learn more about implementing SLOs, check out these resources for defining and adopting SLOs.
One final note: while we used the Service Monitoring UI to help us create SLIs and SLOs, at the end of the day, SLIs and SLOs are still configurations. As engineers, we want to make sure that our configurations are source-controlled to improve reliability, scalability, and maintainability. To learn more about how to use config files with Service Monitoring, check out the second part of this series at Setting SLOs: observability with custom metrics.