Setting SLOs: observability using custom metrics

Cindy Quach
Site Reliability Engineer
If you’ve embarked on your site reliability engineering (SRE) journey, you’ve likely started using service-level objectives (SLOs) to bring customer-focused metrics into your monitoring, perhaps even utilizing Service Monitoring as discussed in “Setting SLOs: a step-by-step guide.” Once you're able to decrease your alert volume, your oncallers are experiencing less operational overhead and are focused on what matters to your business—your customers. But now, you’ve run into a problem: one of your services is too complex and you’re unable to find a good indicator of customer happiness using Google Cloud Monitoring-provided metrics.
This is a common problem, but not one without a solution. In this blog post, we’re going to look at how you can create service-level objectives for services that require custom metrics. We will utilize the help of service monitoring again, but this time, instead of setting SLOs in the UI, we will look at using infrastructure as code with Terraform.
Exploring an example service: stock trader
For this example, we have a back-end service that processes stock market trades for buying and selling stocks. Customers submit their trades via a web front end, and their requests are sent to this back-end service for the actual orders to be completed. This service is built on Google Compute Engine. Since the web front end is managed by a different team, we are going to be responsible for setting the SLOs for our back-end service. In this example, the customers are the teams responsible for the services that interact with the back-end service, such as the front-end web app team.
This team really cares that our service is available, because without it customers aren’t able to make trades. They also care that trades are processed quickly. So we’ll look at using an availability service-level indicator (SLI) and a latency SLI. For this example, we will only focus on creating SLOs for an availability SLI—or, in other words, the proportion of successful responses to all responses. The trade execution process can return the following status codes: 0 (OK), 1 (FAILED), or 2 (ERROR UNKNOWN). So, if we get a 0 status code, then the request succeeds.
Now we need to come up with what metrics we are going to measure and where we are going to measure them. However, this is where the problem lies.
There’s a full list of metrics provided by Compute Engine.You might think that instance/uptime shows how long the VM has been running, so it’s a good metric to indicate when a back-end service is available. This is a common mistake, though—if a VM is not running, but no one is making trades, does that mean your customers are unhappy with your service? No. What about the opposite situation: What if the VM is running, but trades aren’t being processed? You’ll quickly find out the answer to that by the number of angry investors at your doorstep. So using instance/uptime is not a good indicator of customer happiness here.
You can look at the Compute Engine metrics list and try to justify other metrics like instance/network, instance/disk, etc. to represent your customer happiness, but you’d most likely be out of luck. While there are lots of metrics available in Cloud Monitoring, sometimes custom metrics are needed to gain better observability into our services.
Creating custom metrics with OpenCensus
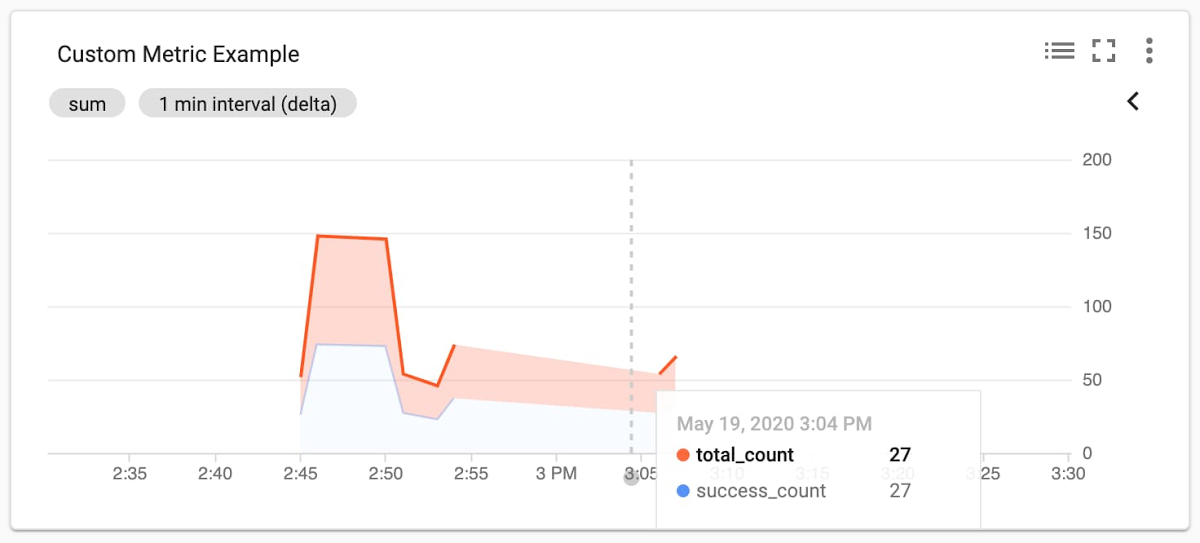
There are various ways that you can create custom metrics to export to Cloud Monitoring, but we recommend using OpenCensus for its idiomatic API, open-source flexibility and ease of use. For this example, we’ve already instrumented the application code using the OpenCensus libraries. We’ve created two custom metrics using OpenCensus: one metric that aggregates the total number of responses with /OpenCensus/total_count and another one, /OpenCensus/success_count, that aggregates the number of successful responses.
So now, the availability SLI will look like this:
The proportion of/OpenCensus/success_count to /OpenCensus/total_count measured at the application level.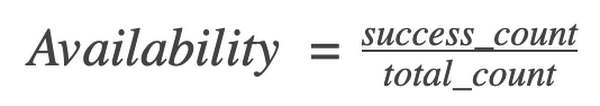
Once these custom metrics are exported, we can see them in Cloud Monitoring:
Setting the SLO with Terraform
With application-level custom metrics exported to Cloud Monitoring, we can begin to monitor our SLOs with Service Monitoring. Since we are creating configurations, we want to source-control them so that everyone on the team knows what’s been added, removed or modified. There are many ways to set your SLO configurations in Service Monitoring, such as using gcloud commands, Python and Golang libraries, or using a REST API. But in this example, we will be utilizing Terraform and the google_monitoring_slo resource. Since this is configuration-as-code we can take advantage of a version control system to help track our changes, perform rollbacks, etc.
Here’s what the Terraform configuration looks like:
Let’s explore the main components:
resource “google_monitoring_slo”allows us to create a Terraform resource for Service Monitoring.goal = 0.999sets an SLO target or goal of 99.9%rolling_period_days = 28sets a rolling SLO target window of 28 daysrequest_based_sliis the meat and potatoes of our SLI. We want to specify an SLI that measures the count of successful requests divided by the count of total requests.good_total_ratioallows us to simply compute the ratio of successful or good requests to all requests. We specify this number by providing two TimeSeries monitoring filters for what constitutes agood_service_filter. In this case, “/opencensus/success_count” is joined with our project identification and resource type. You want to be as precise as you can with your filter so that you only end up with one result. Then do the same for thetotal_service_filter, which filters for all your total requests.
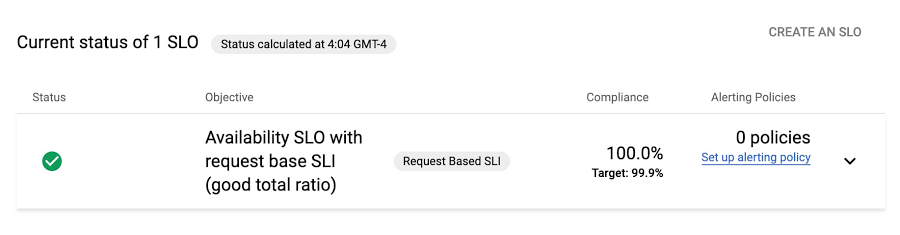
Once the Terraform configuration is applied, the newly created SLO is in the Service Monitoring dashboard for our project (as shown in the figure below). We can even make changes to this SLO at any time by editing our Terraform configuration and re-applying it-simple!
Setting a burn-rate alert with Terraform
Once we’ve created our SLO, we will need to create burn-rate alerts to notify us when we’re close to exhausting the error budget. The google_monitoring_alert_policy resource can do this:
Let’s explore the main components:
conditionsdetermine what criteria must be met to open an incident.filter = “select_slo_burn_rate”is the filter we will use to create SLO burn-based alerts. It takes two arguments: the target SLO and a lookback period.thresholdis the error budget consumption rate. If a service uses a burn rate of 1, this means that it is consuming the error budget at a rate that will completely exhaust the error budget by the end of the SLO window.notification_channelswill use existing notification channels when the alerting policy is triggered. You can create notification_channels with Terraform, but here we’ll use an existing one.documentationis the information sent when the condition is violated to help recipients diagnose the problem.
Now that you’ve looked at how to create SLOs out of the box with service monitoring, and how to create SLOs for custom metrics to get better observability for your customer-focused metrics, you’re well on your way to creating quality SLOs for your own services.
You can learn more about the Service Monitoring API to help you accomplish other tasks such as setting windows-based alerts and more.