How Mercari reduced request latency by 15% with Cloud Profiler
Bill Chung
Software Engineer (Microservice platform), Mercari
Sho Ogihara
Software Engineer (Microservice platform), Mercari
Editor’s note: For retailers, predicting consumers’ desires and demand is the holy grail. For retail IT, the goal is understanding the performance of your ecommerce applications. Here, Japanese online retailer Mercari shows how they used Cloud Profiler and Trace to understand a complex microservices-based application running on Google Cloud, to meet rigorous SLOs as demand shifts for their products.
The events of 2020 have accelerated ecommerce, increasing demand for and traffic on online marketplaces. Analyst eMarketer predicts that ecommerce sales in the United States will grow 18% in 2020, against an overall fall in total retail sales of 10.5% for the year. Likewise, our business—Japan-headquartered consumer-to-consumer marketplace Mercari Inc—is growing rapidly. In the United States alone, we have seen 74% year-on-year growth in monthly average users to 3.4 million. A big part of our success are our robust payment and deposit systems and AI-based fraud monitoring, which enable sellers to list items for purchase and buyers to complete transactions safely.
Mercari started as a monolithic application but as complexity grew we decided to transition to a microservices architecture. And through it all, tools like Cloud Profiler and Cloud Trace helped us track down performance problems in our code, significantly improving latency.
A microservices menagerie
Today, we run 80+ microservices on Google Cloud with a mix of languages including Go, Python, JavaScript and Java. To deliver this new architecture, we created a gateway-like microservice to route traffic from soon-to-be migrated monolithic service to the Google Cloud microservices, which delivers a range of features.
After creating several microservices, we identified common requirements and created a template to accelerate their development. These common requirements included:
Exporting metrics to Prometheus
A gRPC server and interceptors
Error Reporting, Cloud Trace and Cloud Profiler. Error Reporting counts, analyzes and aggregates crashes in running cloud services, while Cloud Trace provides a view of requests as they flow through microservices and Cloud Profiler shows how microservices consume CPU, memory and threads.
We then used Python to create a template for machine learning services, also expediting the creation of new microservices. This has enabled us to grow the number of microservices we use in order to address new requirements. However, as our microservices proliferated, we needed to efficiently monitor and understand their performance.
Maintaining SLO a challenge
In particular, we needed to monitor the impact of new versions on the production environment and the efficiency of production operations, so we could maintain our service level objective (SLO) for success rates of 99.95% and 350 milliseconds for 95% latency.
Our engineering team also uses canary deployments to detect issues with new versions of major services. However, despite applying these measures, we found it challenging to maintain our SLO when our business grew faster than expected or during unanticipated spikes in demand. Some issues can be obvious or easy to detect. For example, if a service is experiencing high CPU utilization, we could simply place or fine tune our horizontal pod autoscaler (HPA) to resolve the problem. However, other issues may be less obvious. For example, a drop in performance may not directly be tied to a specific release—it may instead be due to unexpected requests, or may arise from changes to multiple functions in a single code release.
Using Cloud Profiler and Cloud Trace to minimize performance issues
In particular, our business-critical UserStats service, which tracks the speed with which a user replies to a message and how fast and reliably a seller ships an item, recently started performing poorly.
New feature requirements had prompted us to track how often a seller cancels an order and provide statistics. However, while adding this new functionality, the change refactored other functions, meaning we were unable to identify the function experiencing reduced performance. Since most of our services are enabled with Cloud Profiler and Cloud Trace, we turned to these products to investigate and identify the root cause.
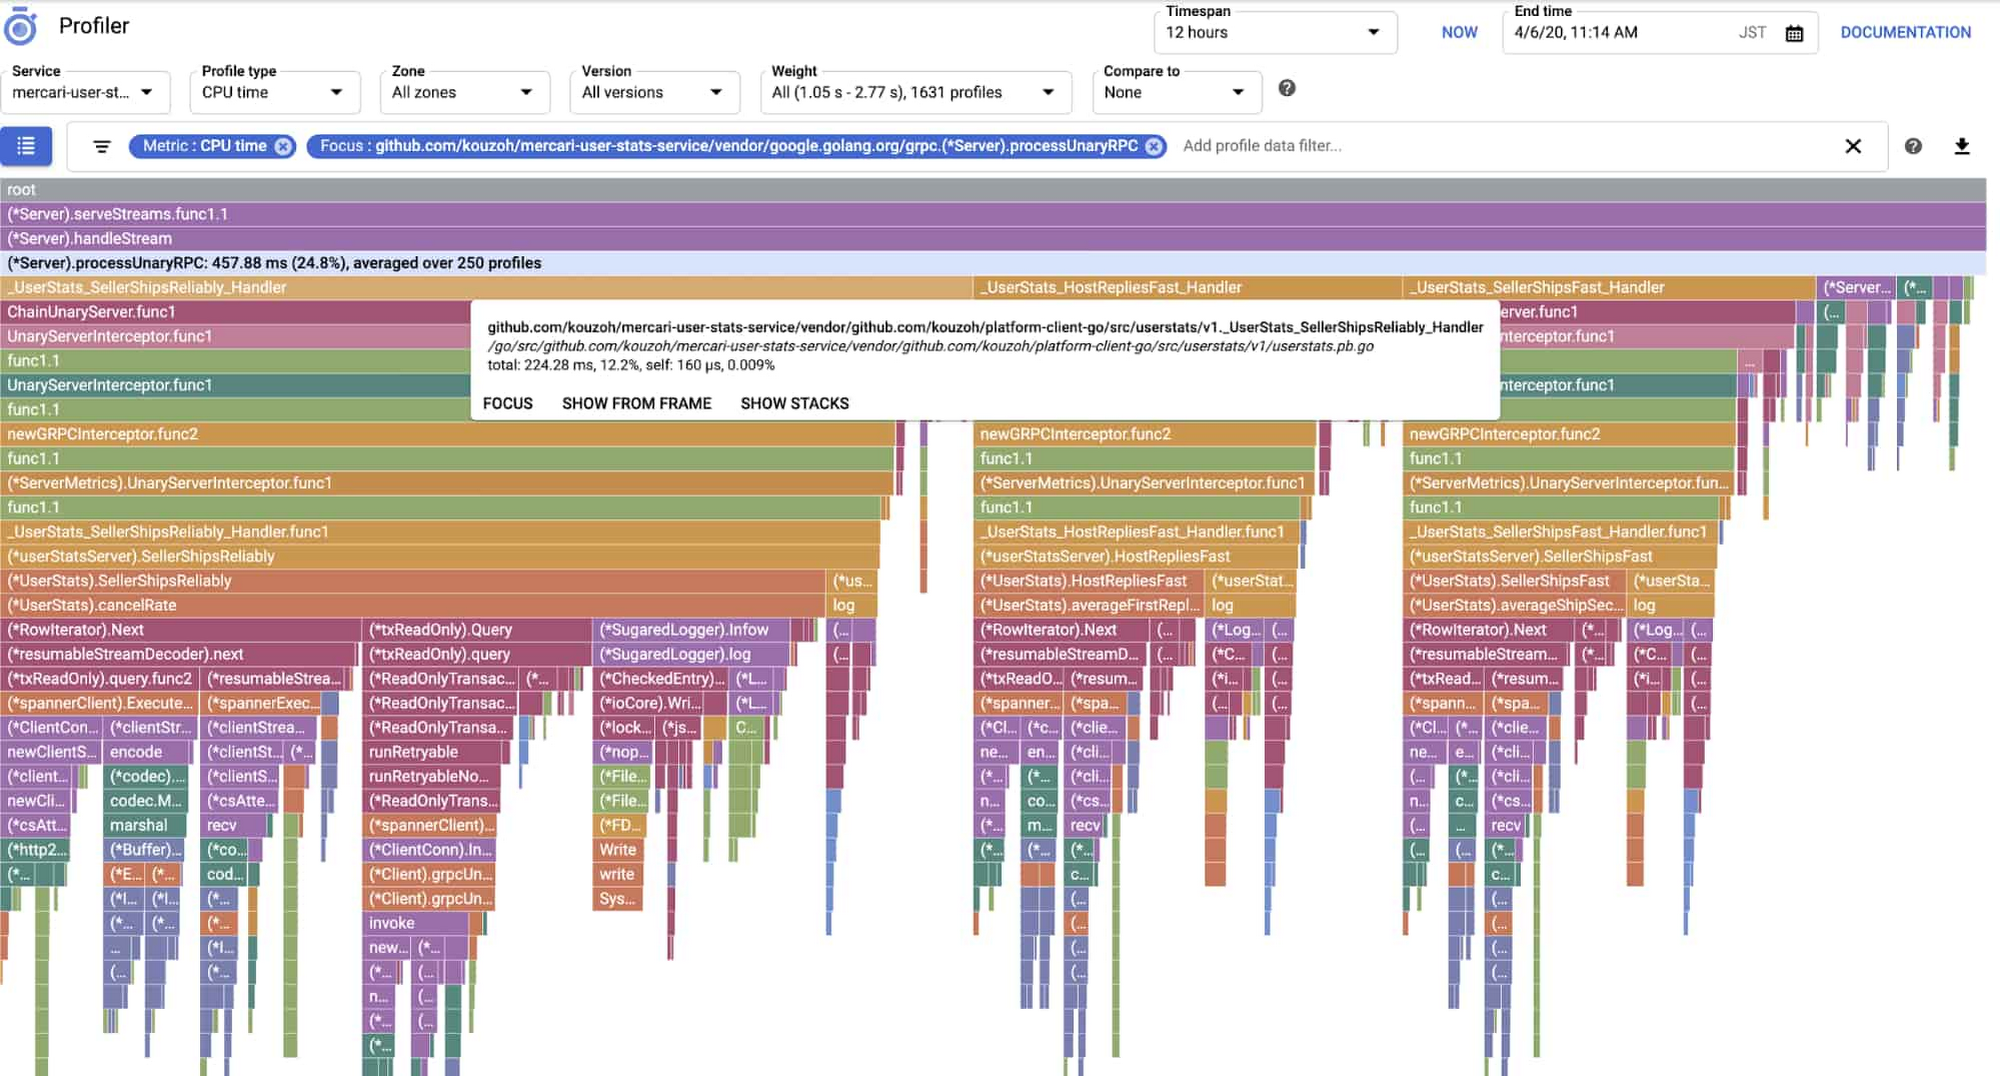
Before the change:
After the change:
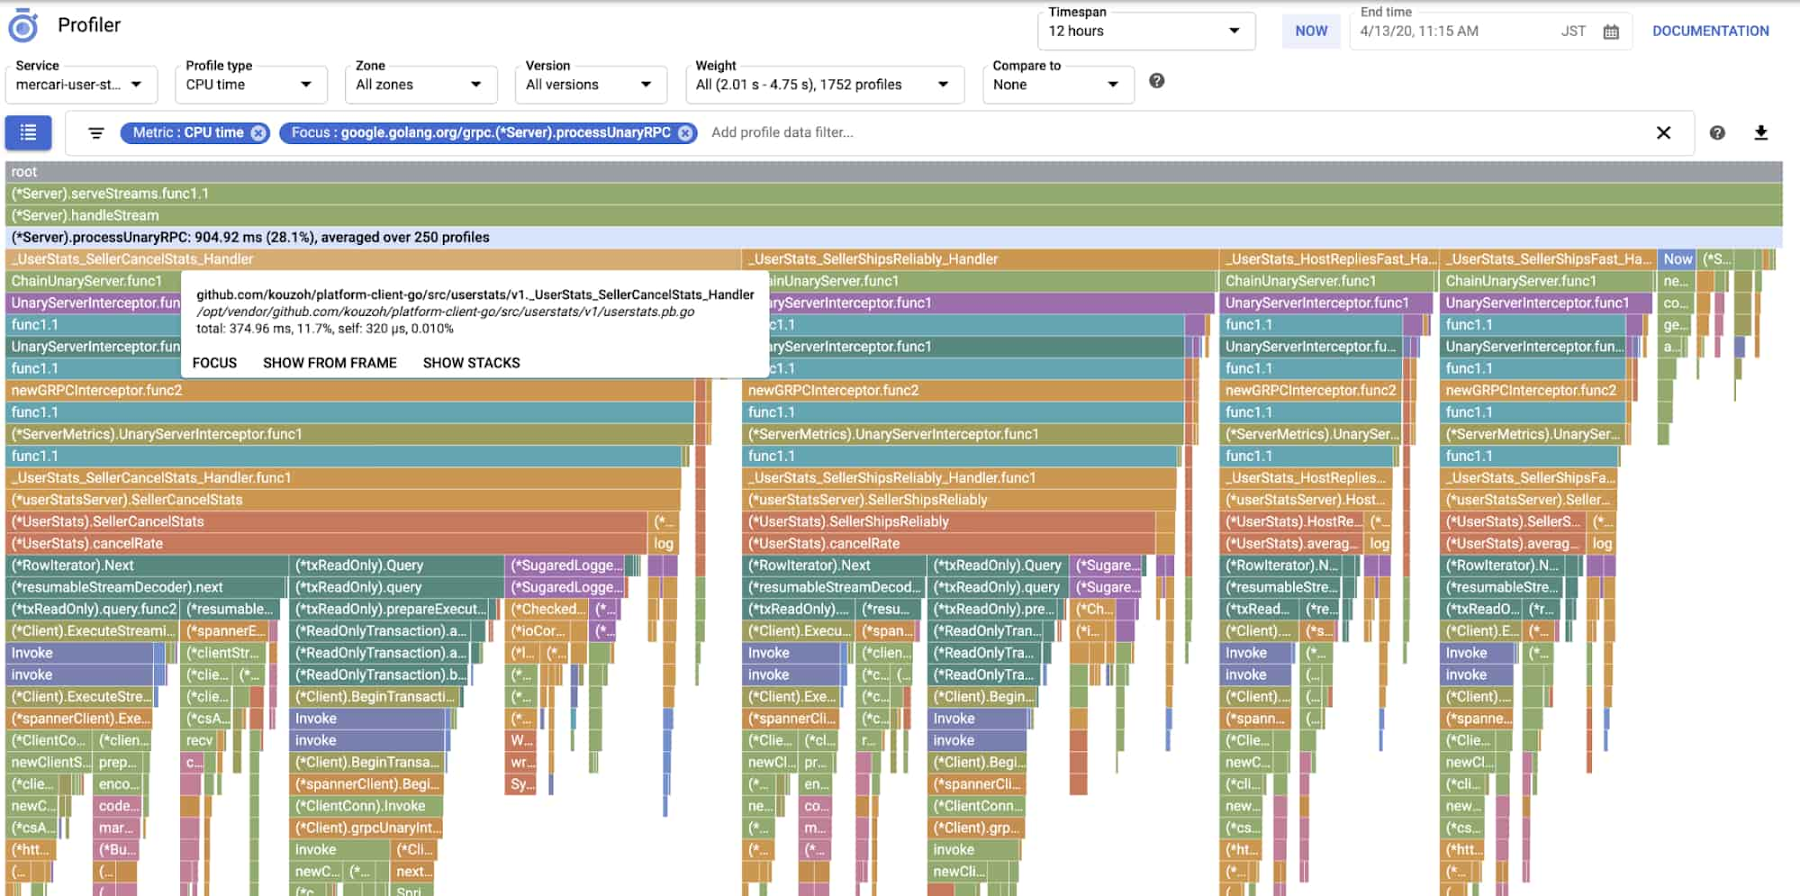
These two Cloud Profiler views show the CPU time of the call stack increased from 457 milliseconds to 904 milliseconds, with most of the delta attributable to the _UserStats_SellerCancelStats_Handler function. But because other functions also saw variations in their CPU consumption, and because calls occurred in parallel, we found it difficult to identify the cause of latency increases. The fact that this function call was necessary meant we could not remove the entire function.
We checked Cloud Trace and confirmed the function call had increased overall latency on some requests, similar to below:
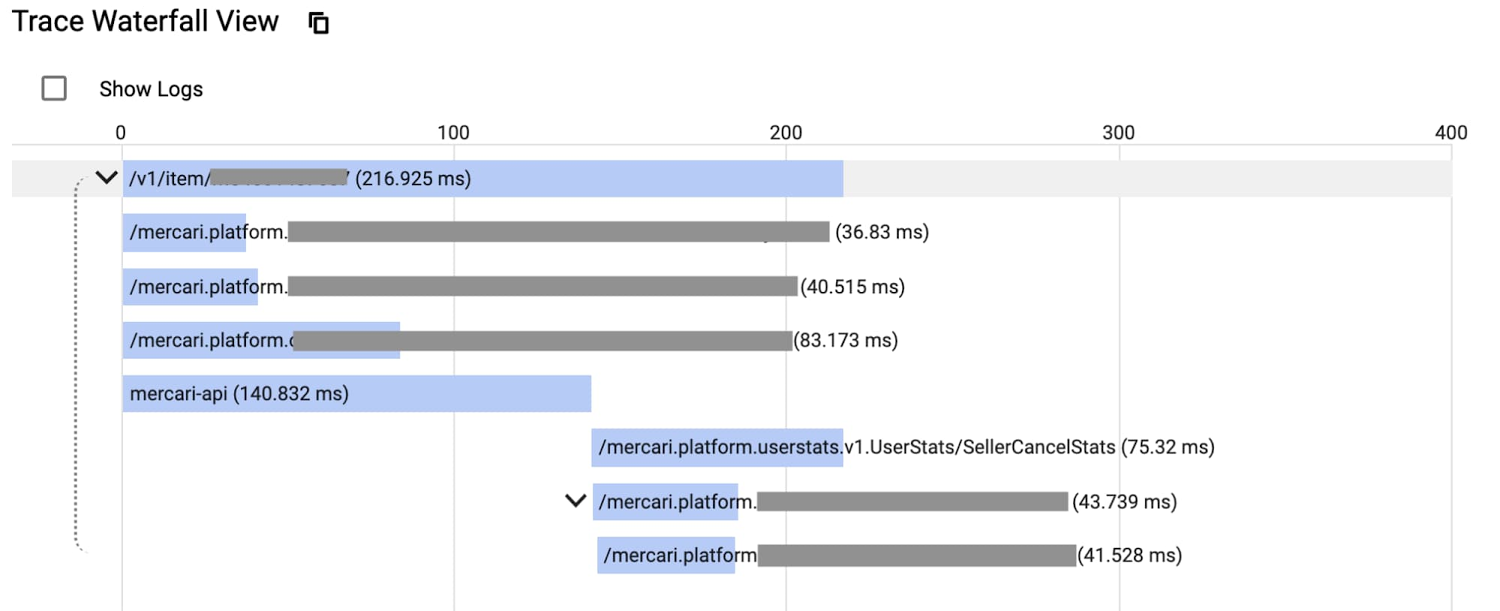
We analyzed the service with Cloud Profiler and identified hot spots that were contributing to the increase in CPU time consumption. We optimized these hot functions, deployed the new code, used Cloud Profiler to verify that the changes had the desired effect of reducing the CPU time. Doing so, we were able to improve latency by 10% to 15%!
Simplifying the DevOps experience
Before adopting Cloud Profiler, profiling production services was a tedious and manual undertaking involving recompiling with debug flags; deployment to production environments, and using disparate tools to collect profiles and perform analysis. Containerization only increased this complexity, further reducing developer productivity.
Cloud Profiler enables us to continuously profile production environments with small and simple code changes, replacing the tedious work previously required to set up environments for performance analysis. Low overhead continuous profiling with Cloud Profiler helps us react swiftly to changes in service performance by root causing and resolving issues quickly.
Further, tools such as Cloud Trace and Cloud Profiler require minimal effort to setup and provide a consistent DevOps experience for our service owners. This is particularly important as we grow in the United States and elsewhere. Without Google Cloud, monitoring, debugging and profiling across production environments that feature a mix of languages, technology stacks, frameworks and containers would be extremely challenging and time-consuming. The release of new features and experiences in tools such as Cloud Profiler make us glad we chose Google Cloud as our primary cloud platform. We will continue to work with new features and provide feedback to Google Cloud, so it can continue to provide a better service to users.
Visit the Google Cloud website to learn more about Cloud Profiler and Cloud Trace.