How to identify and reduce costs of your Google Cloud observability in Cloud Monitoring

Kyle Benson
Product Manager, Cloud Ops
Haskell Garon
Sr. Product Manager
If it matters, you should measure it! This adage underpins an explosion of growth in the monitoring and observability market over the last decade. Unfortunately, many organizations struggle to realize the benefits of their tooling, leading to budget bloat without gaining much additional insight.
Here at Google Cloud, the Cloud operations suite is the first source of telemetry for Google Cloud workloads. According to a 2022 IDC report, more than half of respondents surveyed stated that managing and monitoring tools from public cloud platforms provide more value compared to third-party tools.
We previously showed you how to save money when using Cloud Logging. Today we’ll take a look at how you can reduce costs associated with Cloud Monitoring as well.
A quick recap on Cloud Monitoring:
We use a simple “pay-as-you-go” model across the complete portfolio of our logging and monitoring services. You have total control and transparency, so you only pay for what you use.
We provide several free metrics for services across Google Cloud. If you turn on a service, you get these system metrics at zero additional cost and with no instrumentation or action required.
We also provide tools like our Dashboard Builder, Metrics Explorer, and Alerting to help you understand your metrics and get proactive notifications at no additional cost.
Only custom metrics (Ops Agent metrics, custom metrics, Prometheus metrics, etc) that you deploy for your workloads are billable, making it easy to align your billing costs with your observability goals.
With that in mind, let’s see some practical tips to save costs.
Understand your costs today and the primary drivers
Like any cloud or IT cost, before beginning cost optimizations, it is important to understand your baselines and the major drivers of your Monitoring costs so that you can intelligently make trade-offs and prune unneeded telemetry and spending. To get an idea of your costs today and what you get for that, check out the following:
Understand Cloud Monitoring pricing
Our pricing is transparent, and thousands of Google Cloud metrics across services are automatically made available to you at no additional cost. Some metrics and activities are chargeable though, including:
Sending metrics generated by Google’s Ops Agent, custom metrics, and log-based metrics — all of which are charged per-MiB of ingestion (with a monthly 150 MiB free tier per account per month), and with no additional charge for retention
Sending metrics from Google Cloud Managed Service for Prometheus, which are charged per-sample ingested, with two years of retention included
Reading metrics via the Cloud Monitoring API, which are charged per 1000 API calls, with the first 1 million API calls per billing account per month included in the free tier
Cloud Billing reporting
In the Cloud Console, go to Billing, select the Billing Account, and choose “Reports”. Then, on the right side, under Filters -> Services, select “Monitoring” as the service. You can then view a breakdown of Monitoring spend by project and compare trends over time. Customers often find that a small number of projects are driving the majority of spend, perhaps due to heavy instrumentation on production applications — and this may be expected — but it is good to know the drivers.
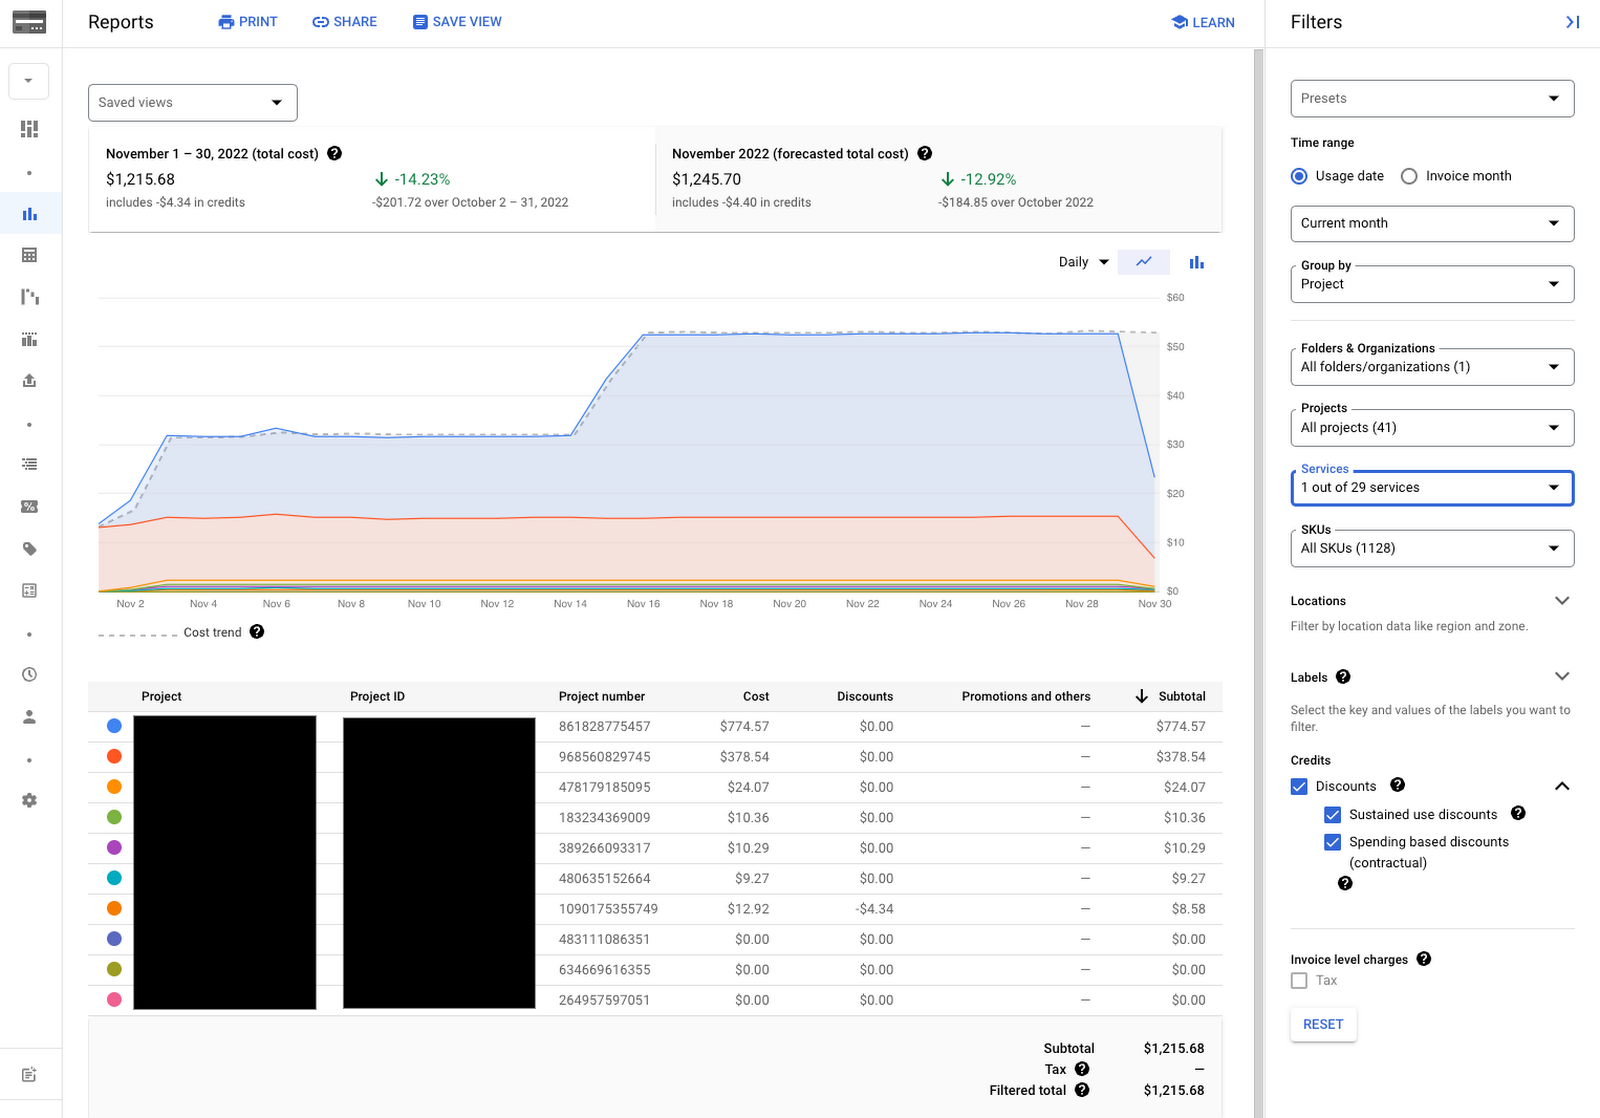
The Billing UI also provides a variety of tools for cost breakdown, budgeting, and budget alerts. All of this is available for any chargeable Google Cloud service, including other Cloud operations products like Logging and Trace, and all of the other Cloud products you use.
Metrics diagnostics
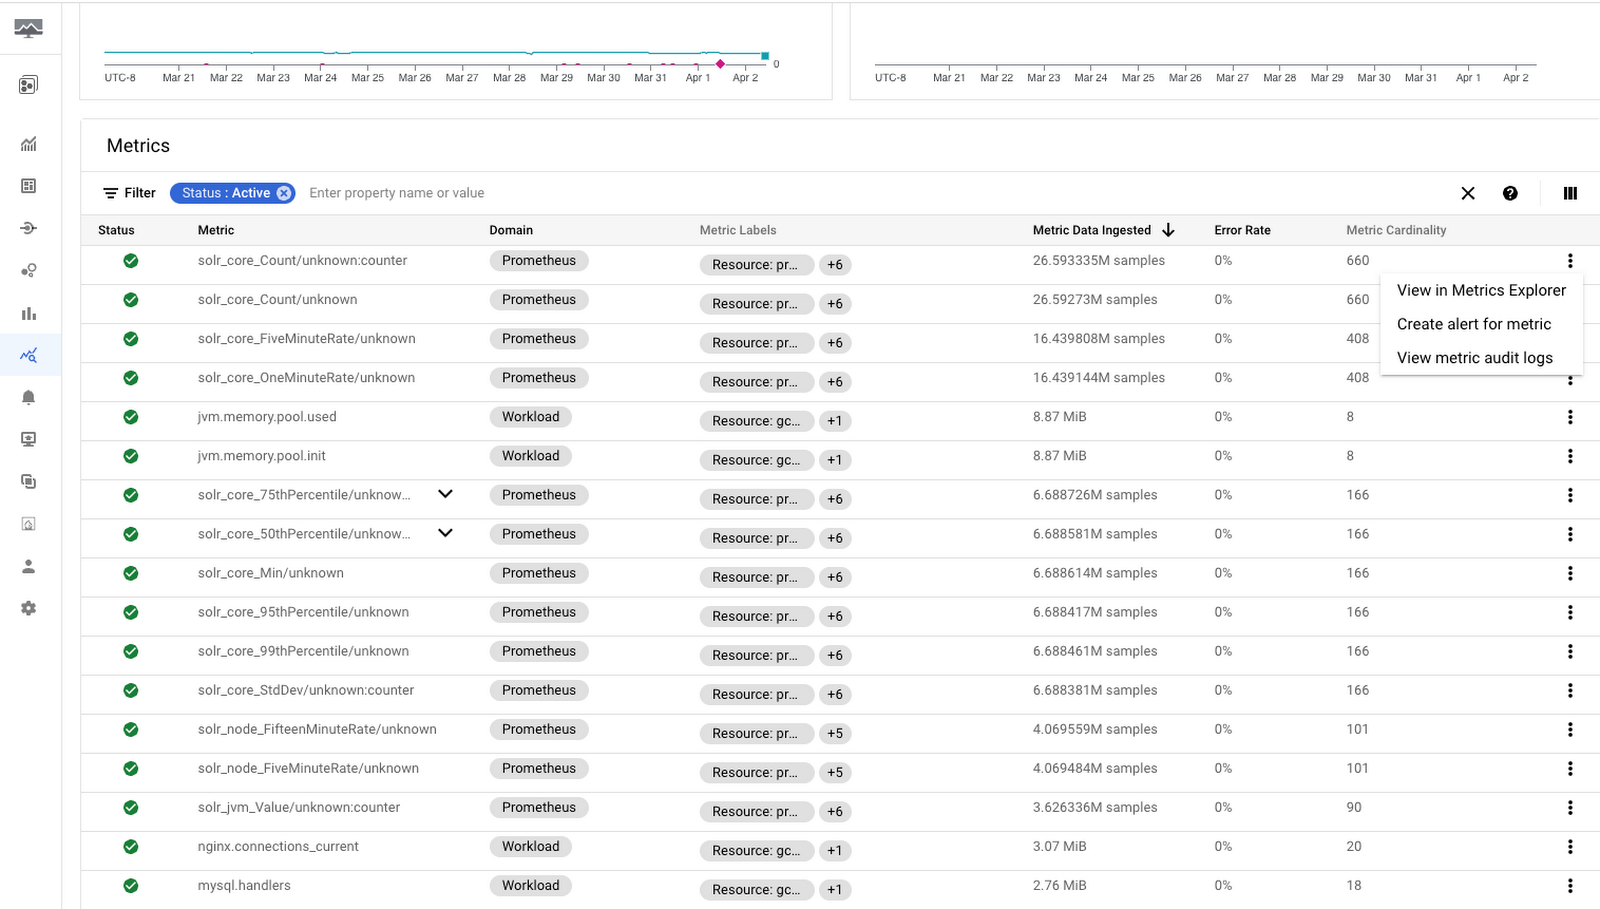
Once you know the projects where you are spending on Cloud Monitoring, we want it to be easy to understand which metrics are driving these observability costs and provide insights on how to reduce spend on unused and noisy metrics. To get started, go to Monitoring → Metrics Diagnostics. This page provides a variety of tools to understand metric ingestion and Monitoring API usage. One tool is a “Metrics” table where you can sort and filter metrics by (a) volume or samples ingested, (b) metric cardinality, (c) metric name and domain, (d) metric labels, (e) project, (f) error rate, and much more. We’ll discuss how to use information like cardinality and domain in more detail later in this blog, but to start, we recommend sorting metrics by “Metric Data Ingested” in descending order to identify exactly which metrics are primarily driving ingestion volume. Whether intended or not, our customers often find that only a few metrics or metric types drive the majority of consumption, and these are the ones that are ripe for cost reduction and optimization.
The three-dot menu to the right of each metric also allows you to do a deeper dive on a given metric in Metric Explorer, easily create alerts for the metric (e.g., to alert on a spike, dip, or trend in a given metric value), and check the audit logs associated with the metric. On the top of the page, you can click easily to change the time-range over which the table is calculated.
Now that you know where you are spending on Monitoring, let’s look at some common options to reduce your bill.
Deciding when to use billable metrics
As mentioned before, many metrics in Cloud Monitoring come at no cost. So what are some scenarios where you might want to include billable metrics?
Granularity
Let’s use a really simple example where we’re focused on measuring or alerting on a Compute Engine instance’s CPU utilization. We can do that using the following free metric:
compute.googleapis.com/instance/cpu/utilization
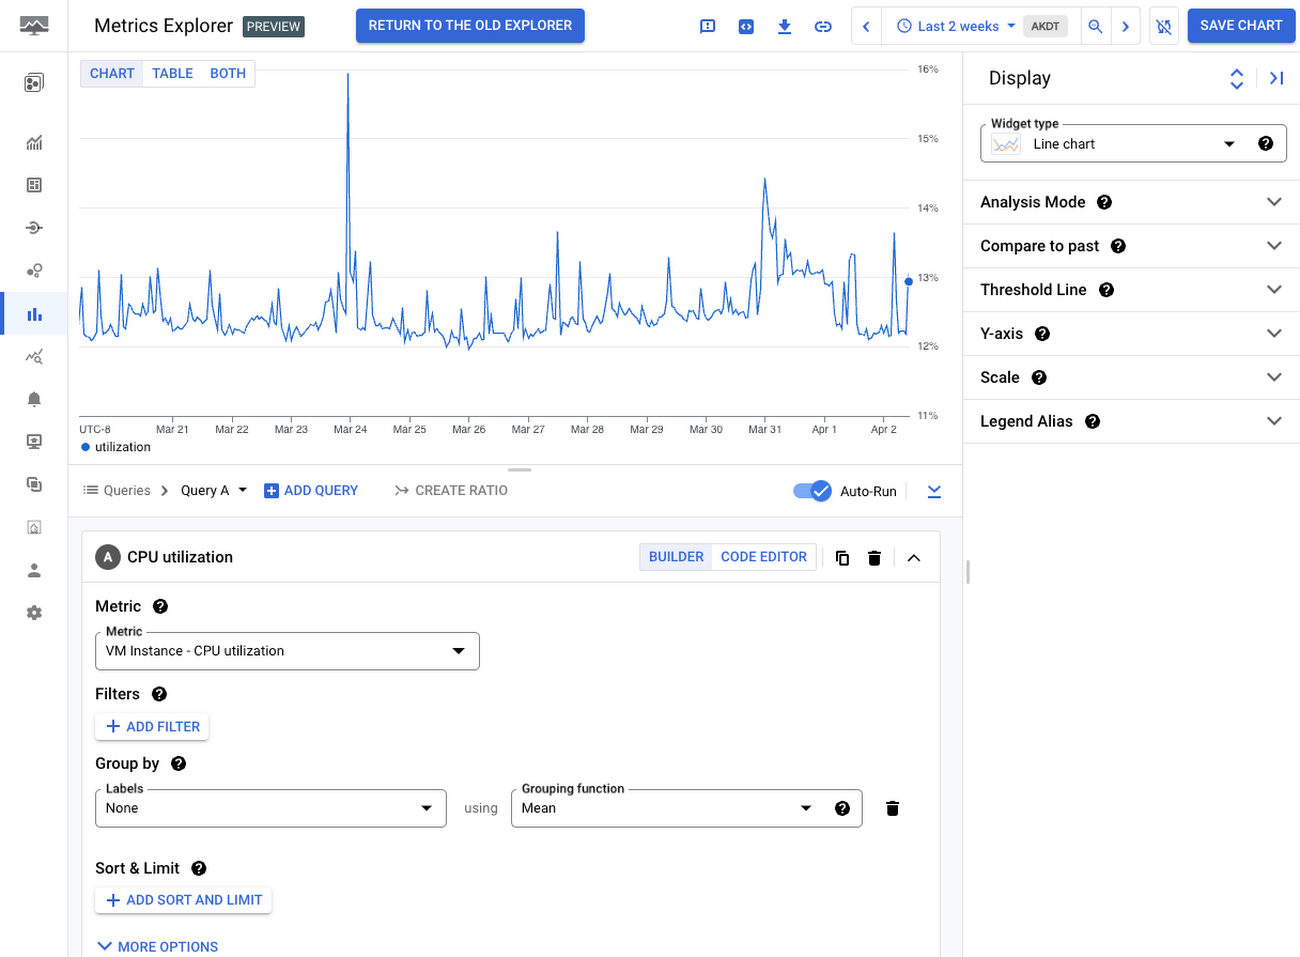
In the view above, this metric comes from the hypervisor host where the Compute Engine instance runs. This might be all you need to effectively monitor your Compute Engine instance. For example, many customers choose to rely on only free system metrics for certain workloads and applications, and do not necessarily need the added granularity of custom or agent metrics.
On the other hand, production, customer-facing applications with stringent SLOs often need advanced and more granular metrics to proactively monitor application health, troubleshoot more effectively, and improve your team’s mean-time-to-detection and resolution.
Taking the previous example, maybe you need better insight into how your VM is actually using CPU. For that, you can deploy the Ops Agent to collect metrics from within the operating system. Here’s that same host where you can see that OS itself actually reports the state of the CPU in terms of utilization:
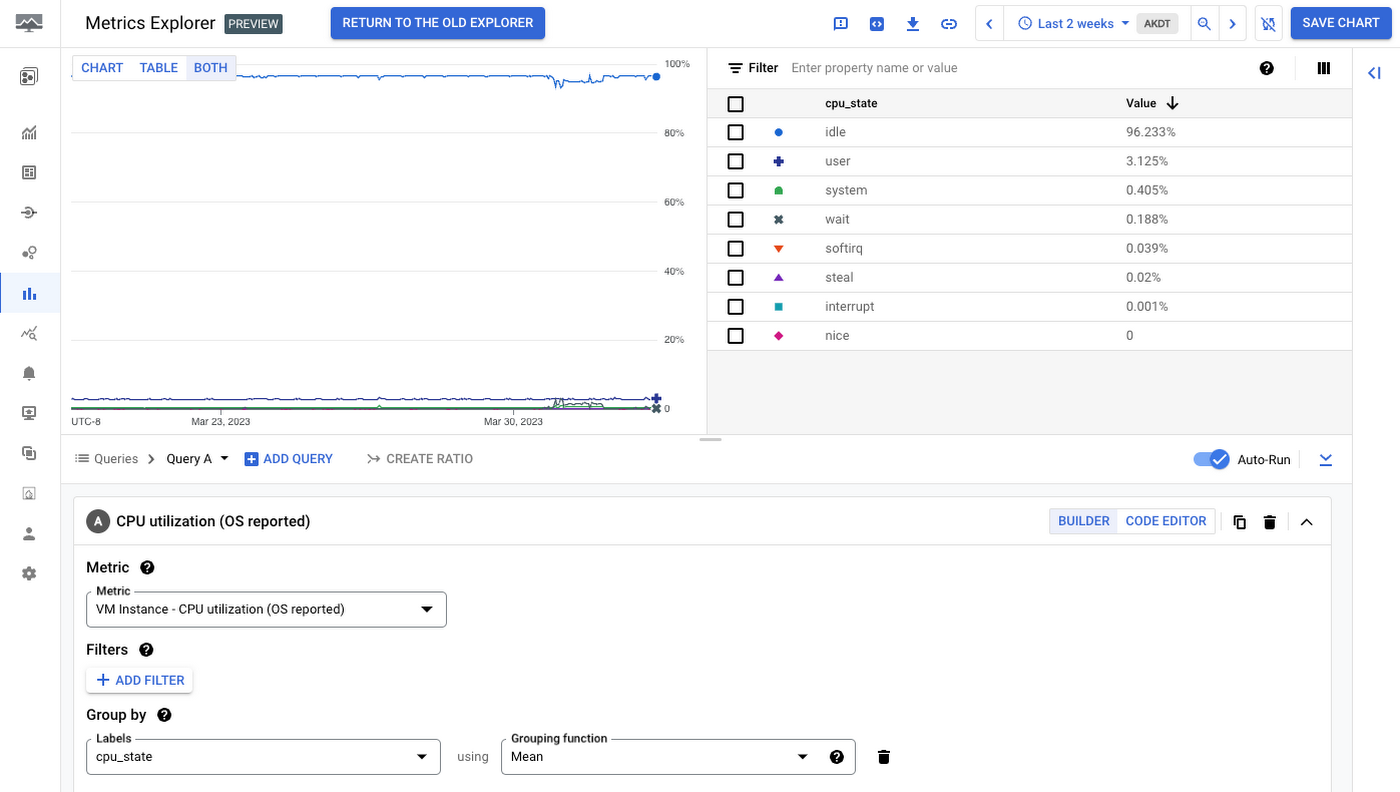
You might then want to understand which live processes are actually driving the CPU consumption on this VM or set of VMs. Billable metrics from the Ops agent allow you to slice and dice CPU utilization by process, command, PID, and more:
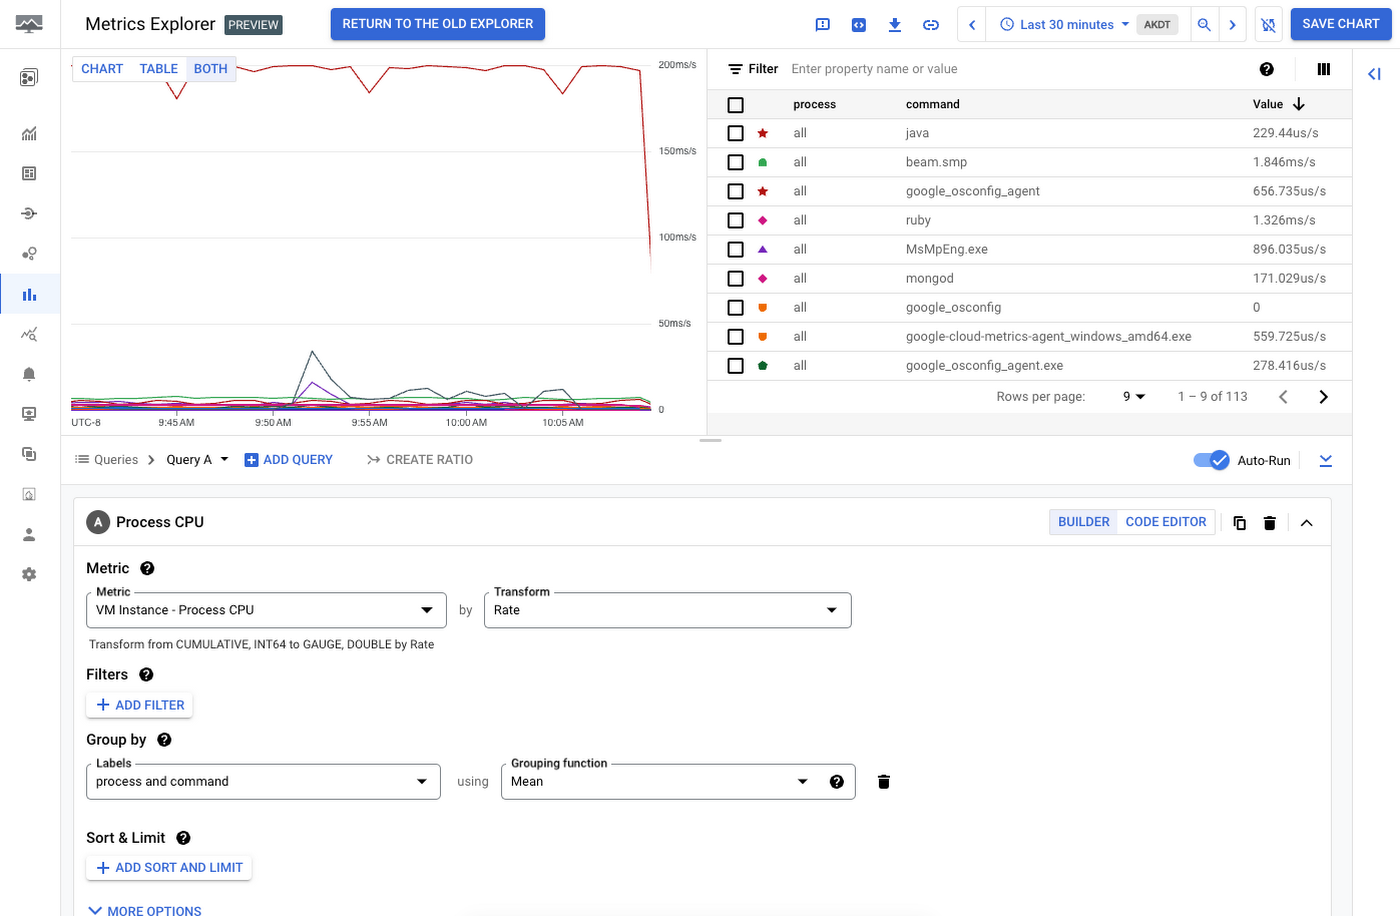
Not all production workloads will require this level of granularity, but your most critical ones may well need this additional telemetry and insight. Similarly, many of your production workloads may require custom metrics specific to your cloud setup. Ultimately, your platform and engineering teams will need to collaboratively decide when system metrics are sufficient, or when additional custom telemetry is required.
Strategies to reduce monitoring costs
Just a handful of strategies to reduce monitoring costs that can have a big impact on your total monitoring costs.
Reduce cardinality
Most people in the telemetry and observability spaces are already familiar with the concept of cardinality but it’s important to recognize that cardinality can have a big impact on your overall costs. Using the “Cardinality” and “Metric Labels” columns in the Metrics Diagnostics UI described above, you can determine whether metrics with high ingestion volume also have high cardinality — and can decide whether additional labels and cardinality are truly adding more observability value, or just adding noise and cost. For example, while some metrics benefit from per-endpoint granularity, others may be totally fine to monitor in aggregate across all paths without regular need for per-endpoint analysis. In the most serious cases, we see users inadvertently try to add labels for information like “sessionID” or IP address — and this type of high-cardinality metadata is almost certainly something that should be recorded in raw logs instead of as metric labels.
Prometheus metrics in particular can often come with high metric volume or cases where users add unneeded cardinality; we provide additional tools in Metrics Explorer to quickly identify the metrics contributing most to ingestion volume, and easily attribute them to the namespace emitting them.
Write metrics less frequently
If you have a billable metric that’s valuable but you need to save on costs, a straightforward but sometimes overlooked option is to send the metric less frequently. Continuing our example with the Ops Agent, this per-process memory metric is may be valuable, but perhaps you can tolerate it reporting only every 2 minutes instead of 1. You can modify the Ops Agent’s metrics configuration to write at 120 second intervals instead of 60 like this:
Then all you have to do is restart the agent, and you’ve reduced the overall cost of this metric by about half, assuming you end up in the same pricing tier. Similarly, when writing custom metrics to Cloud Monitoring, consider how often you need the metric and your overall requirements for precision and frequency and reduce them accordingly. For example, you might find that a given custom metric or Prometheus metric can be sampled every few minutes instead of writing at high-frequency intervals like 5 to 10 seconds.
Remove unneeded metrics
Sometimes our customers find that metrics that were once needed for their observability are no longer required, or that they need certain Ops Agent metrics, but do not get value out of others. In this case, we of course advise you not to consume and pay for metrics you don’t use! The Ops Agent configuration YAML makes it easy to add inclusion or exclusion filters to specify only the metrics of interest. Taking the example above, process metrics might be critically needed for application monitoring and debugging, but perhaps the total count of network packets sent by your VMs is less useful. In this case, you need only add an exclude_metrics filter so that the Ops Agent no longer ingests this:
Likewise, we recommend the same if you see high ingestion volume for custom metrics, log-based metrics, or Prometheus metrics; if there are metrics that your team does not use for monitoring, alerting, or other troubleshooting scenarios, consider excluding them entirely, or at least reducing the frequency and cardinality.
Write metrics as aggregated single points instead of as a histogram/distribution
Metrics of the value-type distribution can be powerful for visualizing data in novel ways like heatmaps, or for quickly computing statistics like 50th or 99th percentile. Distributions also can come with higher ingestion costs though, as each non-zero histogram bucket is charged as an additional point in Prometheus pricing, or 80 bytes for each data point written under non-Prometheus ingestion.
For custom metrics in particular, consider carefully if a histogram is actually required, or if simply pre-computing and writing the median, average, or max as a single point may be sufficient. For example, certain applications may need only to track the max or average latency, but are unlikely to need to do the more complex statistical modeling that is possible with distribution metric types.
Consider using more Prometheus metrics
We previously discussed that Managed Service for Prometheus charges for metrics per-sample, as opposed to per-MiB. Prometheus is the de facto standard for Kubernetes monitoring, and this efficient per-sample pricing is designed with the understanding that Kubernetes workloads can generate large volumes of telemetry. We recently announced support for Prometheus built into the Ops Agent. If your organization is already using or evaluating Google Cloud Managed Service for Prometheus or heading in that direction, unifying telemetry collection under per-sample Prometheus collection can also come with significant cost savings vs per-MiB custom pricing. We provide more details on cost controls and attribution for Prometheus users here, building on the tips and strategies above.
One key tip when deciding to use Prometheus is that many open-source Prometheus exporters generate far more samples than is usual for VMs. So while you can see savings on a 1:1 metric basis, we strongly recommend using the above practices when working with Prometheus, as well ensuring you’re capturing the right telemetry for your organization.
Remember not to increase your operational burden and toil
At the end of the day, it’s important to remember that when choosing an observability solution, cost should be a factor but not the only factor for most organizations. When evaluating monitoring solutions, it is important to factor in the total-cost-of-ownership, accounting for the ongoing operational overhead, maintenance, and support needed to run and maintain a home-brewed or in-house monitoring stack. Sometimes orgs fall into the trap that using a totally “free” solution is sufficient without recognizing how this impacts their employees, teams, and overall culture.
We hope these tips were useful for you, but if you have questions don’t hesitate to reach out on the Google Cloud Community.