Understand production performance with Cloud Profiler history view
Morgan McLean
Product Manager
Kalyana Chadalavada
Engineering Manager
Cloud Profiler is a favorite of Google Cloud customers thanks to the insight that it provides into the performance of your production code. You can use this knowledge to reduce and shorten outages, improve performance, and optimize compute spend—always a popular topic! Profiler has always provided the ability to view and compare CPU and memory performance over time through time filters and the comparison feature. Now, Profiler lets you view the performance of a single function or a group of functions over time.
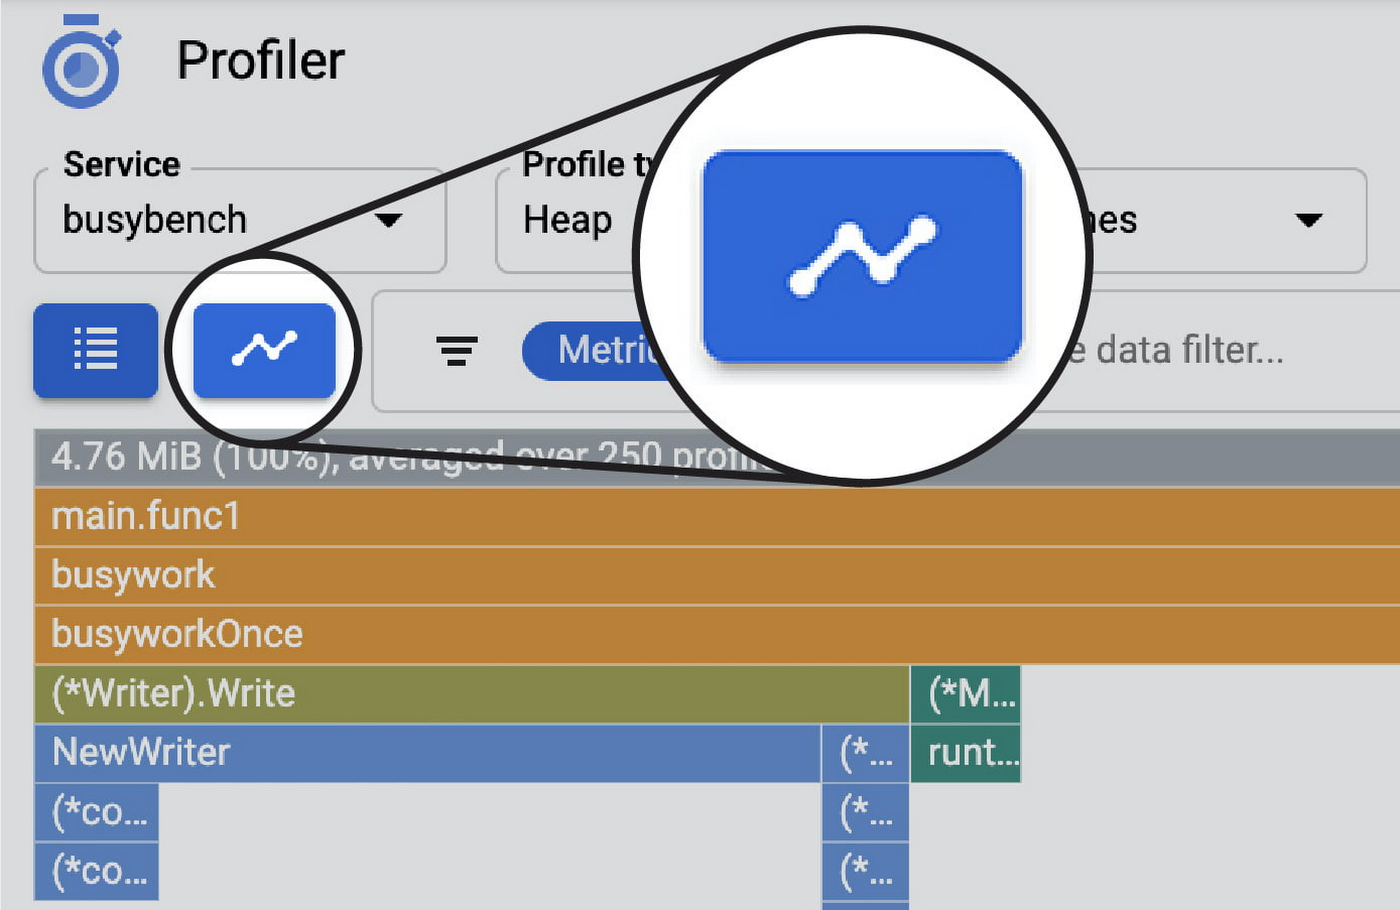
You can access this using the history view button, which displays the new function history view window that shows the relative resource consumption of the most resource hungry functions within a given service.
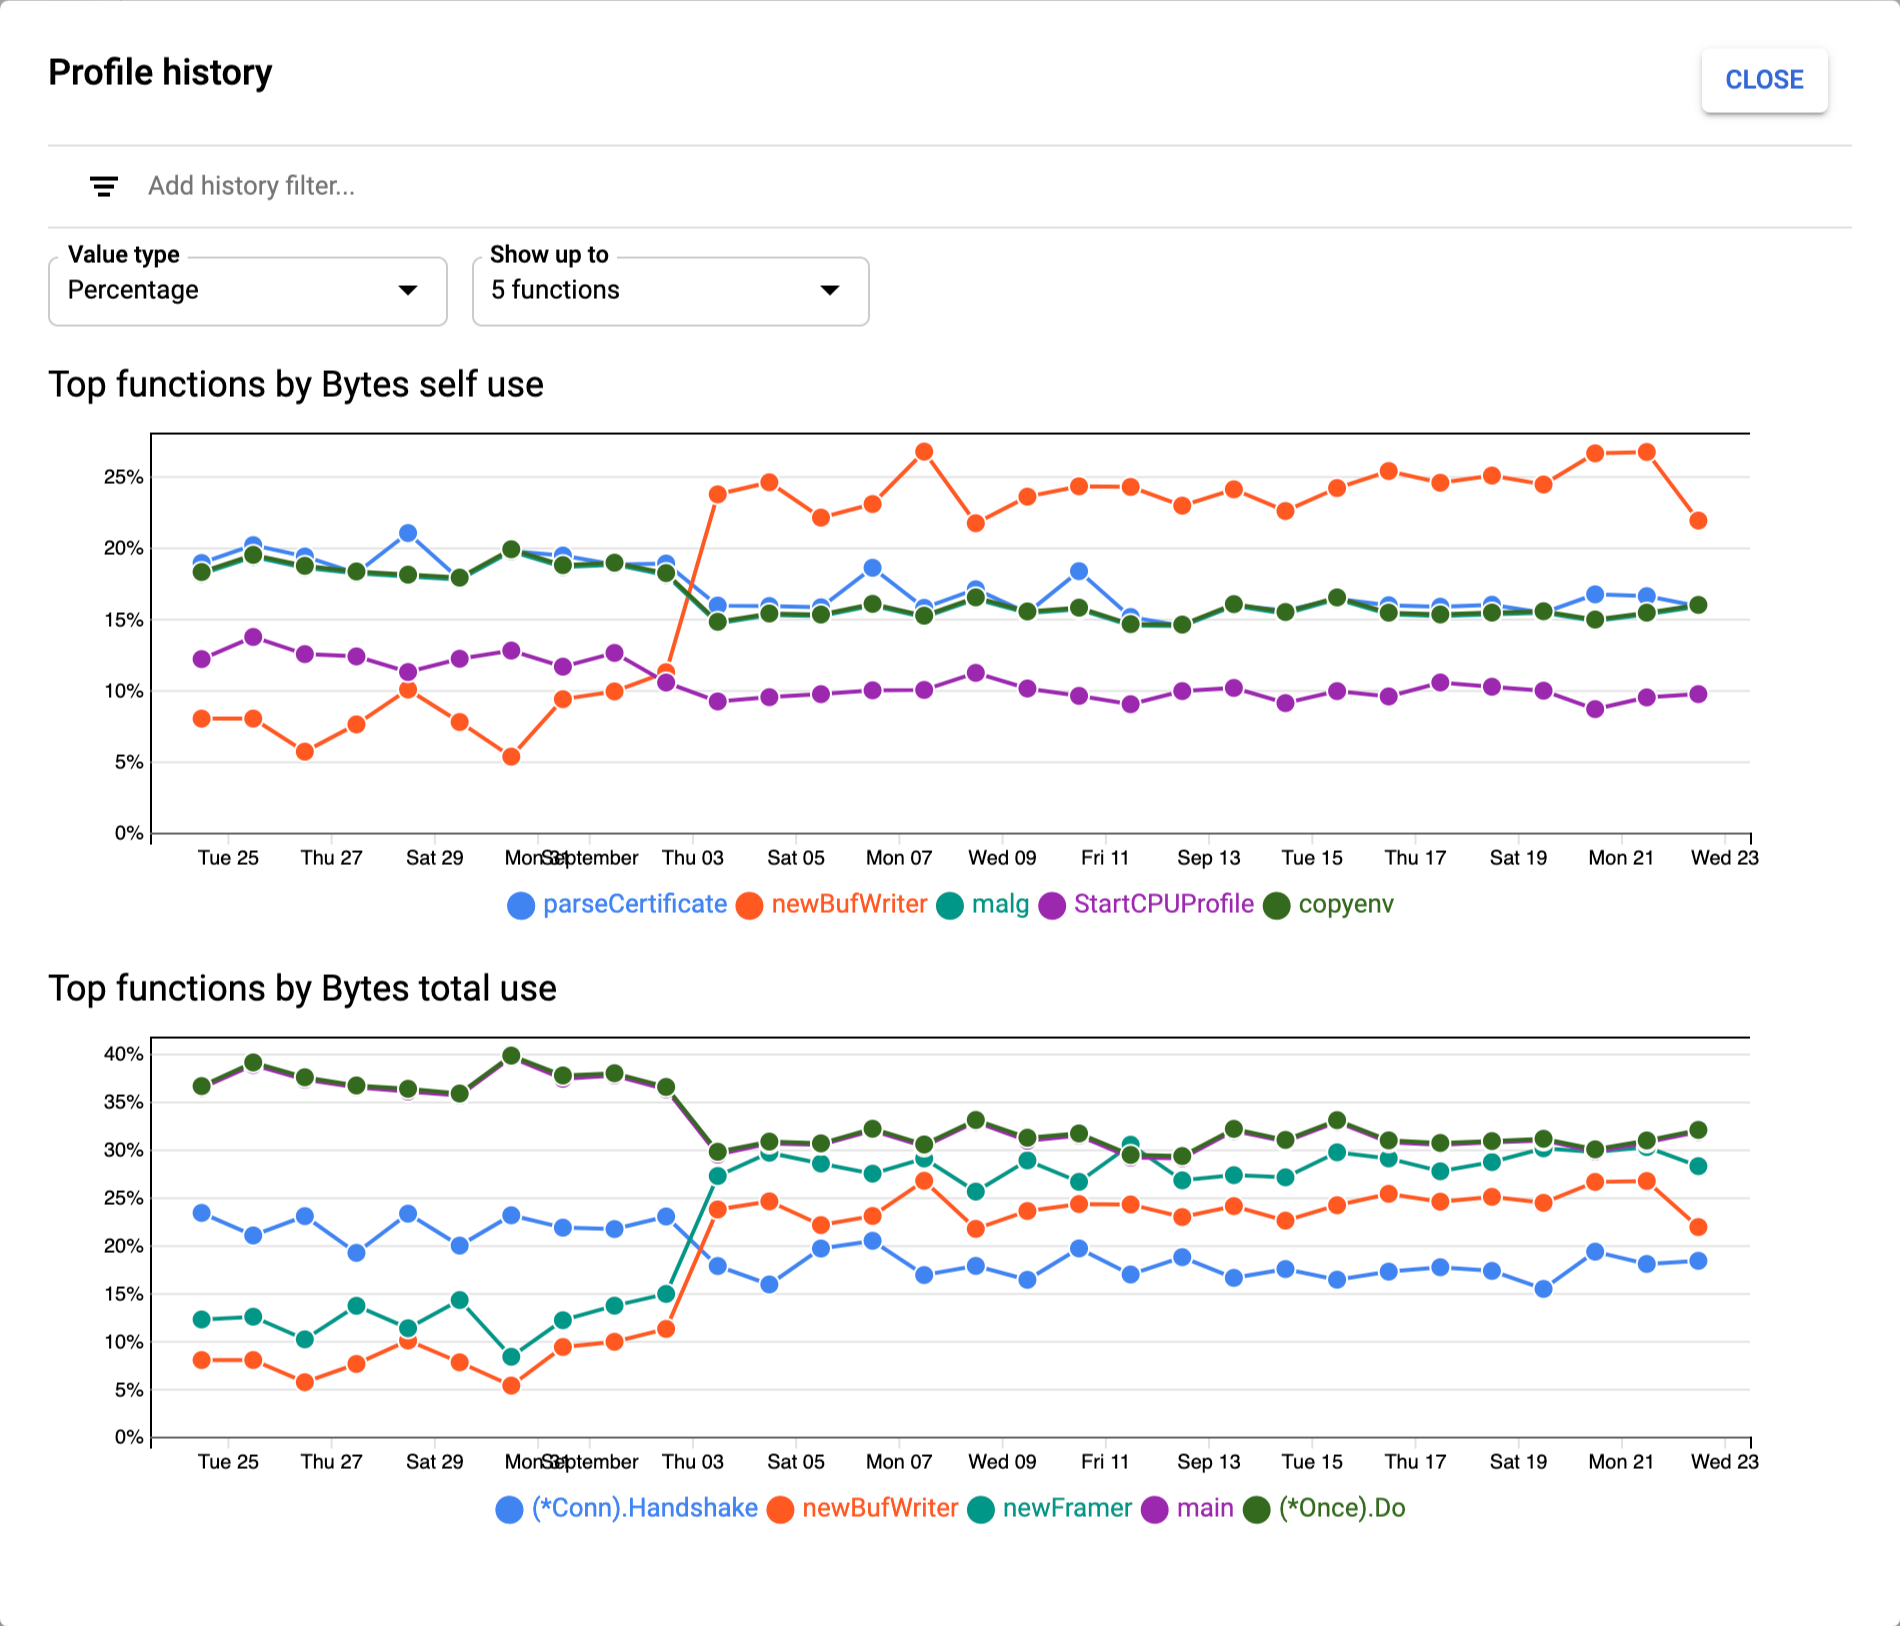
You can use the history view feature to do a number of different things:
Intuitively understand the performance trends of the most resource-intensive functions over time
Discover unintended resource usage changes. Large-scale or complex code changes can have unintended resource usage implications. Looking at the history view, you can verify that your code changes didn’t introduce unintended performance or resource usage changes.
Verify the performance impact of recent code changes.
Rapidly find the root cause of an outage of severe performance regression. If a service has stalled due to high CPU or memory consumption, looking at the history of each function’s resource consumption will provide insight into when and what parts of the code recently started using more resources.
Characterize how a codebase’s performance changes due to external factors such as usage spikes (this can also be visualized with Profiler’s weight filter) or known changes in usage patterns.
Profiler history view is available immediately as a preview for all users. Read more about how to use this feature.
If you are new to Profiler, our Quickstart or codelab can help you get started.