Detecting and responding to Cloud Logging events in real-time
Charles Baer
Product Manager, Google Cloud
Xiang Shen
Solutions Architect
Logging is a critical component of your cloud infrastructure and provides valuable insight into the performance of your systems and applications. On Google Cloud, Cloud Logging is a service that allows you to store, search, monitor, and alert on log data and events from your Google Cloud Platform (GCP) infrastructure services and your applications. You can view and analyze log data in real time via Logs Viewer, command line or Cloud SDK.
These logging tools are built to help you find and understand your logs. You may have business or technical processes that may require an automated action or you may want to reduce toil for your DevOps team. For example, you may want to use changes in your Cloud Audit Logs to take action and remediate a security vulnerability caused by inadvertent infrastructure changes.
Using a Logging sink, you can build an event-driven system to detect and respond to log events in real time. Cloud Logging can help you to build this event-driven architecture through its integration with Cloud Pub/Sub and a serverless computing service such as Cloud Functions or Cloud Run.
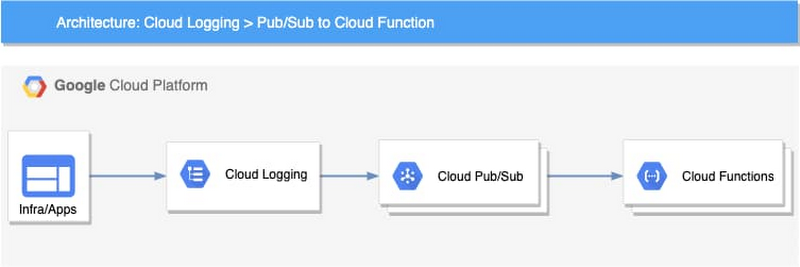
Architecture overview
The high-level architecture of this event-driven system is both simple and flexible. There are four main components:
Log events – The applications and the infrastructure send logs to Cloud Logging
Logging – Cloud Logging sinks in the Logs Router lets you send log events to Pub/Sub topics based on the specific filters you create
Pub/Sub – Initiates Cloud Functions asynchronously based on the received log events
Cloud Functions – The business logic to process and respond to the log events
This loosely coupled event-driven system can autoscale based on the volume of log events without any capacity planning or management from the user. Using a serverless computing option can also significantly reduce the cost and improve programmers’ productivity. For example, you can use Cloud Function code to help analyze log entries, store data, and invoke other APIs or services as needed.
Log events
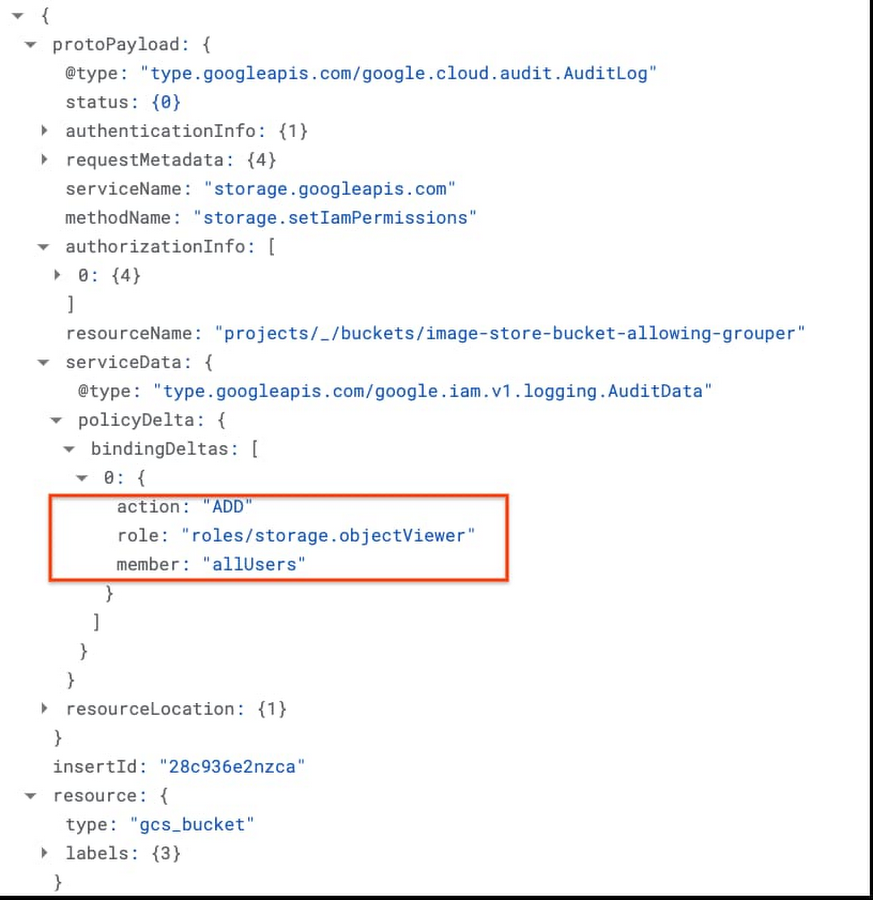
Each log event written to Cloud Logging includes a LogEntry, which includes the log name, timestamp, resource of the log source, payload, and metadata. Depending on how the log is written, the payload could be data stored as one of three types: a Unicode string (textPayload), a JSON object (jsonPayload), or a protocol buffer (protoPayload). You can examine the payload of the logs and extract useful events such as errors, exceptions, or specific messages. This same payload is available to the Cloud Function logic.
For example, if public read permission is added to a Cloud Storage bucket, an audit log entry similar to the following one will be sent to Cloud Logging. You can extract the payload and process based on the action.
Use cases
There is a wide range of situations where you can implement an event-driven system to process and respond to log events. To provide examples, we have developed three different Cloud Functions as reference code which respond to three different types of log messages. In our reference code, we implemented the logic using Cloud Functions to host and run the code. If you prefer, you could also implement similar logic using Cloud Run or App Engine. If you’re not sure which serverless computing options you need, you can read more at the serverless options comparison page to help you decide.
Here are three common use cases that you can use as reference for an event-driven architecture for log events.
1. Automatically enforce firewall rules
Our first use case is to automate firewall changes against “obvious policy violations” on Google Cloud such as allowing full internet access for an internal company service. In many organizations, there are security policies that only allow Ingress traffic to applications from specific ports, such as 80, 443, or within a particular IP range. If a change made to firewall rules violates these policies, that could open a security vulnerability and potentially leave a system open for compromise. For example, a private service not meant to receive internet traffic may be exposed with a firewall rule that allows all ingress traffic (0.0.0.0/0). You can remediate a firewall change that doesn’t adhere to policy when it is detected.Based on our event-driven architecture, the implementation includes three components:
Logging sink - Using a Logging sink, you can direct specific log entries to your business logic. In this example, you can use Cloud Audit logs for Compute Engine which use the resource type
gce_firewall_ruleto filter for the logs of interest. You can also add an event typeGCE_OPERATION_DONEto the filter to capture only the completed log events. Here is the Logging filter used to identify the logs. You can try out the query in the Logs Viewer.resource.type="gce_firewall_rule"operation.last=truePub/Sub topic – In Pub/Sub, you can create a topic to which to direct the log sink and use the Pub/Sub message to trigger a cloud function.
Cloud Function – In Cloud Functions, you can create logic to evaluate the received logs based on your business requirements.
The cloud function can then be invoked for any firewall rule changes that are captured in Cloud Audit Logs including:
compute.firewalls.patchcompute.firewalls.insertcompute.firewalls.update
If one of the log entries above appears in the audit logs, that triggers the cloud function logic. In the reference implementation, the cloud function retrieves the entire firewall rule details using the Compute Engine API and checks all the items in it. In our example, we simply remove the firewall rule if we find a violation. You can also patch the rule or roll it back with additional logic.
After you write the code, you can deploy it using an Infrastructure-as-Code approach. For instance, you can use the following configuration with Cloud Deployment Manager to automate the deployment.
In this configuration, you can see how the Logging sink, Pub/Sub topic and Cloud Function are provisioned. Optionally, you can also configure Sendgrid to send an email notification to your specified email address.
2. Automatically remediate a misconfigured bucket
Our second use case focuses on preventing a misconfigured bucket in Cloud Storage. A misconfigured bucket can expose sensitive data and cause damage to your organization. To help protect against this, you can monitor the configuration changes to the bucket. For example, if an admin inadvertently opens a bucket to the public for read/write, you can capture this change and remove the public access using a cloud function. This is especially useful when combined with an aggregated sink that captures all logs for your Google Cloud organization.You can then invoke the cloud function for any Cloud Storage bucket changes that Cloud Audit Logs captures, including:
storage.buckets.createstorage.buckets.updatestorage.setIamPermissions
If one of the changes above appears in the audit logs, you can look up the bucket policy and remove rules associated with allUsers or allAuthenticatedUsers.
3. Automate your business event logic
For our last use case, we’ll show you how to extend the system by integrating it with other services. In Cloud Logging, you can create logs-based metrics, which are custom metrics in Cloud Monitoring from log entries. For example, the payment service in an ecommerce app logs various exceptions during the payment process. You can create a logs-based metric to count all those exceptions. After that, you can create an alerting policy to send your primary on-call person an alert if the metric exceeds a threshold in a short period.Built-in logs-based metrics are good for counting the number of log entries and tracking the distribution of a value in your logs. However, it might not be adequate when you need to perform computation based on the log entry content or add business-specific labels to your metrics. For those use cases, you can use the logs-based event-driven architecture to write the metrics.
For example, let’s say that you want to monitor product recommendations in real time for your ecommerce app. You can use logs-based metrics to capture your specific business metrics. As an example, this microservices demo app is a simple demo ecommerce app that you can deploy. In it, when a user clicks a product, a recommendation is generated for related products on the site and written as a log entry. Using a logs-based event-driven architecture pattern, you can capture the log entries in a cloud function and then create your custom business metrics with business-specific labels for the products recommended by the application. With these metrics, you can create alerting policies in Cloud Monitoring just like you can for any other Monitoring metrics.