Take charge of your data: Understanding re-identification risk and quasi-identifiers with Cloud DLP
Miguel Guevara
Product Manager, Google Security/Privacy
Scott Ellis
Senior Product Manager
Preventing the exposure of personally identifiable information, a.k.a. PII, is a big concern for organizations—and not so easy to do. Google’s Cloud Data Loss Prevention (DLP) can help, with a variety of techniques to identify and hide PII that are exposed via an intuitive and flexible platform.
In previous “Taking charge of your data” posts, we talked about how to use Cloud DLP to gain visibility into your data and how to protect sensitive data with de-identification, obfuscation, and minimization techniques. In this post, we’re going to talk about another kind of risk: re-identification, and how to measure and reduce it.
A recent Google Research paper defines re-identification risk as "the potential that some supposedly anonymous or pseudonymous data sets could be de-anonymized to recover the identities of users." In other words, data that can be connected to an individual can expose information about them and this can make the data more sensitive. For example, the number 54,392 alone isn’t particularly sensitive. However, if you learned this was someone’s salary alongside other details about them (e.g., their gender, zip code, alma mater), the risk of associating that data with them goes up.
Thinking about re-identification risks
There are various factors that can increase or decrease re-identification risks and these factors can shift over time as data changes. In this blog post, we present a way to reason about these risks using a systematic and measurable approach.
Let’s say you want to share data with an analytics team and you want to ensure lower risk of re-identification; there are two main types of identifiers to consider:
- Direct identifiers - These are identifiers that directly link to and identify an individual. For example, a phone number, email address, or social security number usually qualify as direct identifiers since they are typically associated with a single individual.
- Quasi-identifiers - These are identifiers that do not uniquely identify an individual in most cases but can in some instances or when combined with other quasi-identifiers. For example, data like someone’s job title may not identify most users in a population since many people might share these job title. But some values like “CEO” or “Vice President” may only be present for a small group or single individual.
When assessing re-identification risk you want to consider how to address both direct and quasi identifiers. For direct identifiers you can consider options like redaction or replacement with a pseudonym or token. To identify risk in quasi-identifiers, one approach is to measure the statistical distribution to find any unique values. For example, take the data point “age 27”. How many people in your dataset are age 27? If there are very few people of “age 27” in your data set, there’s a higher potential risk of re-identification, whereas if there are a lot of people aged 27, the risk is reduced.
Understanding k-anonymity
K-anonymity is a property that indicates how many individuals share the same value or set of values. Continuing with the example above, imagine you have 1M rows of data including a column of ages, and in that 1M rows only one person has the age=27. In that case, the “age” column has a k value of 1. If there are at least 10 people for every age, then you have a k value of 10. You can measure this property across a single column, like age, or across multiple columns like age+zip-code. If there is only one person age 27 in zip code 94043 then that group (27, 94043) has a k value of 1.
Understanding the lowest k value for a set of columns is important, but you also want to know the distribution of those k values. That is, does 10% of your data have a low k value or does 90% of your data have a low k value? In other words, can you simply drop the rows that have low k values or do you need to fix it another way? A technique called generalization can be helpful here by allowing you to retain more rows at the cost of revealing less information per row; for example, “bucketing” ages into five-year spans would replace age=27 with age=”26-30”, allowing you to retain utility in the data but make it less distinguishing.

Understanding how much of your data is below a certain k threshold, and whether you drop the data or “generalize” the data, are all forms of measuring the re-identification risk vs. the data loss and utility value in the data. In this trade off you are asking questions like:
- What k threshold is acceptable for this use case?
- Am I okay to drop the percentage of data that is below that threshold?
- Does generalization allow me to retain more data value compared to dropping rows?
Let’s walk through one more example
Imagine you have a database that contains users’ age and zip code and you want to ensure that no combination of age + zip is identifying below a certain threshold (like k=10). You can use Cloud DLP to measure this distribution and use Cloud Data Studio to visualize it (how-to guide here). Below is what this looks like on our sample dataset:
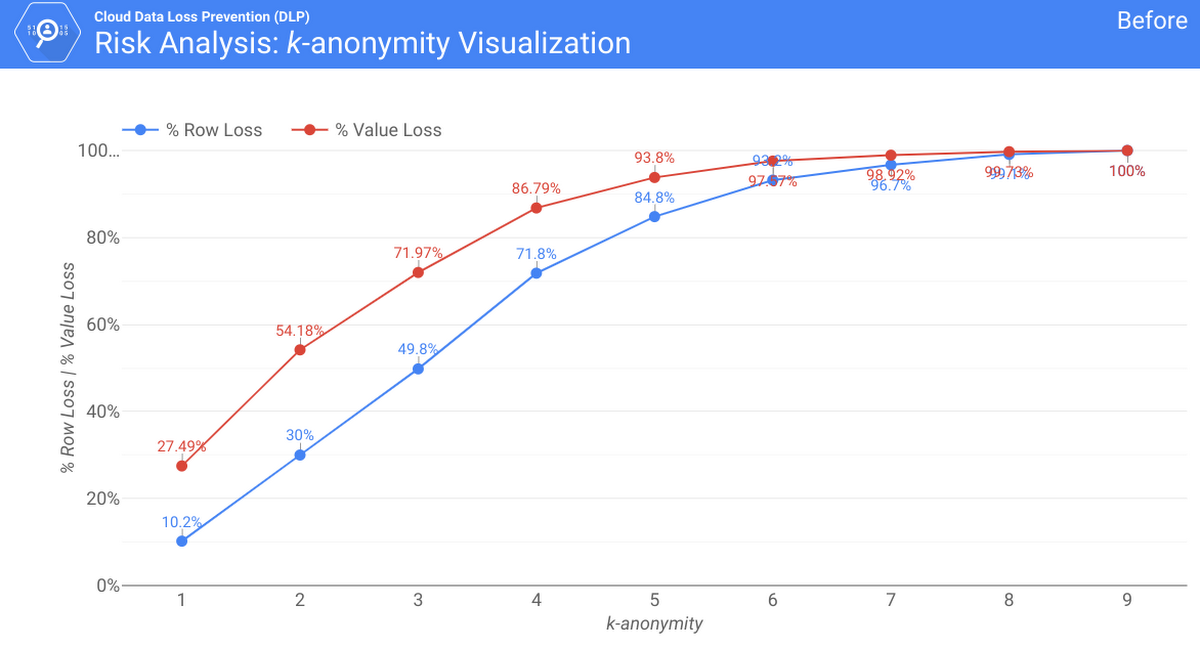
This shows the percentage of rows (blue) and unique values (red) that correlate to a k-value. In the example above, we see that 100% of the data maps to fewer than 10 people. To fix this, without dropping 100% of rows, we applied generalization to convert ages to age ranges. Here is the graph after the transform:
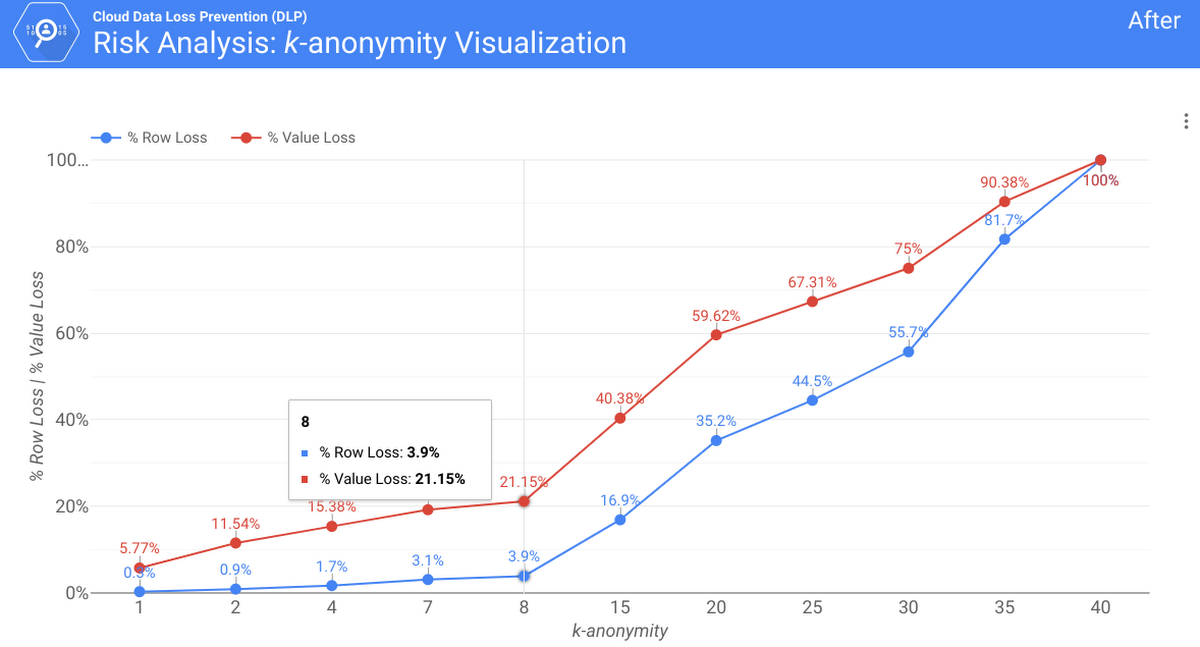
Now only 3.9% of the rows and 21.15% of the unique values fall below the k=10 threshold. So as a result, we reduced the re-identifiability while preserving much of the data utility, dropping only 3.9% of rows.
All hands on deck to prevent data loss
Of course, k-anonymity is just one way to assess quasi-identifiers and your risk of re-identification. Cloud DLP, for example, lets you assess other properties like l-diversity, k-map, and delta-presence. To learn more, check out this resource.
In addition, we plan to present a research paper on Estimating Reidentifiability and Joinability of Large Data at Scale at the IEEE conference in May, covering techniques for doing this kind of analysis at incredibly large scale. We also explore how these techniques can be used to understand additional use cases around join-ability and data flow. These techniques are very useful for data owners who want to have a risk-based approach towards anonymization, while gaining insights into their data. Hope to see you there!