How to connect Stackdriver to external monitoring
Valentin Hamburger
GDC-V Product Manager
Google Stackdriver lets you track your cloud-powered applications with monitoring, logging and diagnostics. Using Stackdriver to monitor Google Cloud Platform (GCP) or Amazon Web Services (AWS) projects has many advantages—you get detailed performance data and can set up tailored alerts. However, we know from our customers that many businesses are bridging cloud and on-premises environments. In these hybrid situations, it’s often necessary to also connect Stackdriver to an on-prem monitoring system. This is especially important if there is already a monitoring process in place that involves classic IT Business Management (ITBM) tasks, like opening and closing tickets and incidents automatically.
Luckily, you can use Stackdriver for these circumstances by enabling the alerting policies via webhooks. We’ll explain how in this blog post, using the example of monitoring the uptime of a web server. Setting up the monitoring condition and alerting policy is really where Stackdriver shines, since it auto-detects GCP instances and can analyze log files. This differs depending on the customer environment. (You can also find more here about alerting and incident management in Stackdriver.)
Get started with server and firewall policies to external monitoring
To keep it simple, we’ll start with explaining how to do an HTTP check on a freshly installed web server (nginx). This is called an uptime check in Stackdriver.First, let’s set up the server and firewall policy. In order for the check to be successful, make sure you’ve created a firewall rule in the GCP console that allows HTTP traffic to the public IP of the web server. The best way to do that is to create a tag-based firewall rule that allows all IP addresses (0.0.0.0/0) on the tag “http.” You can now add that tag to your newly created web server instance. (We created ours by creating a micro instance using Ubuntu image, then installing nginx using apt-get).
If you prefer containers, you can use Kubernetes to spin up an nginx container.
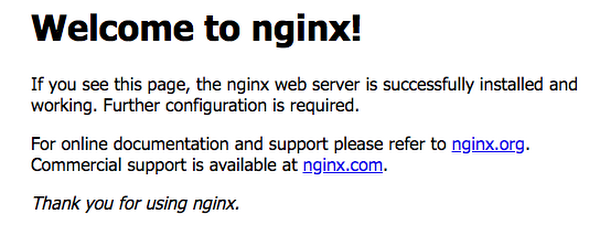
Make sure to check the firewall rule by manually adding your public IP in a browser. If all is configured correctly, you should see the nginx greeting page:
Setting up the uptime check
Now let’s set up the website uptime check. Open the Stackdriver monitoring menu in your GCP cloud console.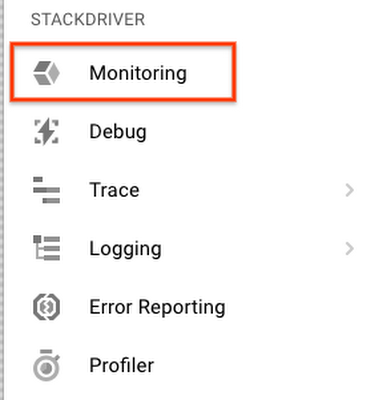
In this case, we created a little web server instance with a public IP address. We want to monitor this public IP address to check the web server’s uptime. To set this up, select “Uptime Checks” from the right-side menu of the Stackdriver monitoring page.
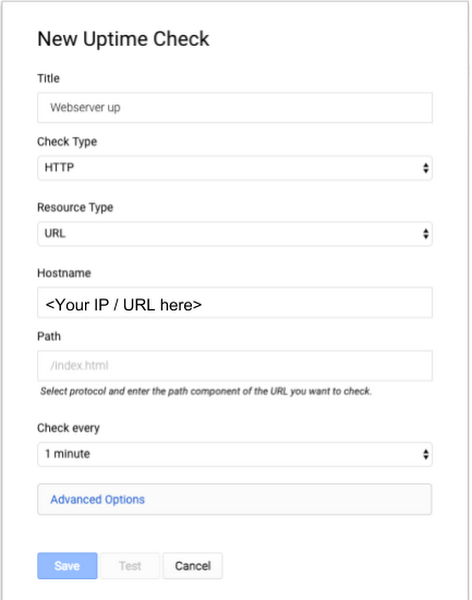
Remember: This is a test case, so we set the check interval to one minute. For real-world use cases, this value might change according to the service monitoring requirements.
Once you have set up the Uptime Check, you can now go ahead and set up an alerting policy. Click on “Create New Policy” in the following popup window (only appears the first time you create an Uptime Check). Or you can click on “Alerting” on the left-side Stackdriver menu to set it up. Click on “Create a Policy” in the popup menu.
Setting up the alert policy
Once you click on “Create a Policy,” you should see a new popup with four steps to complete.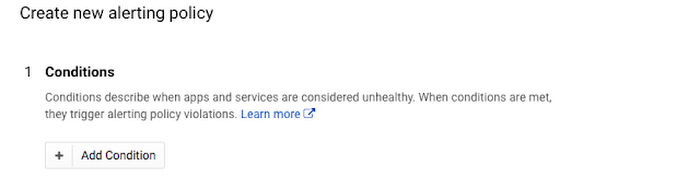
The first step will ask for a condition “when” to trigger the alert. This is where you have to make sure the Uptime Check is added. To do this, simply click on the “Add Condition” button.
A new window will appear from the right side:
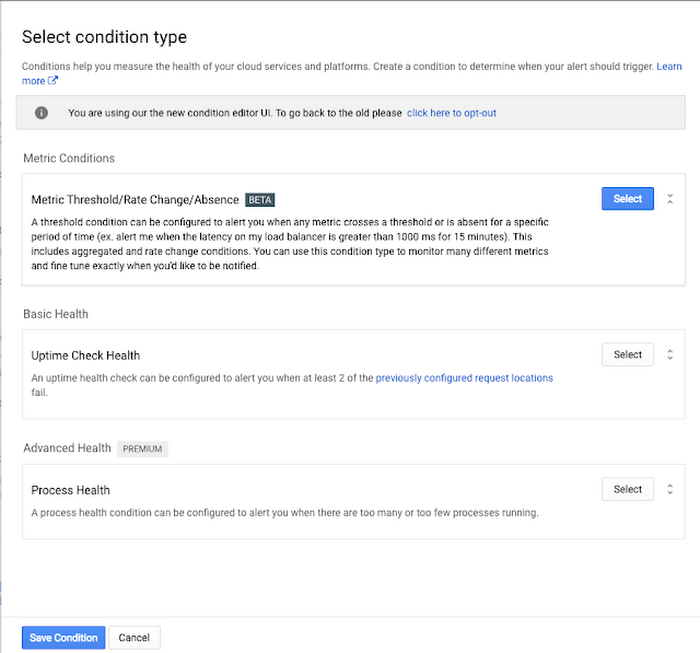
Specify the Uptime Check by clicking on Select under “Basic Health.”
This will bring up this window (also from the right side) to select the specific Uptime Check to alert on. Simply choose “URL” in the “Resource Type” field and the “IF UPTIME CHECK” section will appear automatically. Here, we select the previously created Uptime Check.
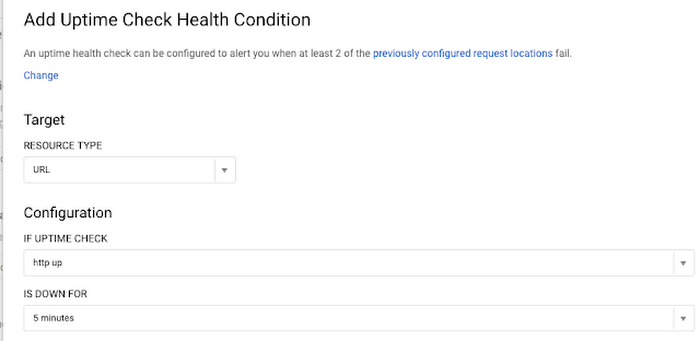
You can also set the duration of the service downtime to trigger an alert. In this case, we used the default of five minutes. Click “Save Condition” to continue with the Alert Policy setup.
This leads us to step two:

This is where things get interesting. In order to include an external monitoring system, you can use so-called webhooks. Those are typically callouts using an HTTP POST method to send JSON formatted messages to the external system. The on-prem or third-party monitoring system needs to understand this format in order to be used properly. Typically, there’s wide support in the monitoring system industry for receiving and using webhooks.
Setting up the alerts
Now you’ll set up the alerts. In this example, we’re configuring a webhook only. You can set up multiple ways to get alerted simultaneously. If you want to get an email and a webhook at the same time, just configure it that way by adding the second (or third) method. In this example, we’ll use a free webhook receiver to monitor if our setup works properly.Once the site has generated a webhook receiver for you, you’ll have a link you can use that will list all received tokens for you. Remember, this is for testing purposes only. Do not send in any user-specific data such as private IP addresses or service names.
Next you have to configure the notification to use a webhook so it’ll send a message over to our shiny new webhook receiver. Click on “Add Notification.”
By default a field will appear saying “Email”—click on the drop-down arrow to see the other options:
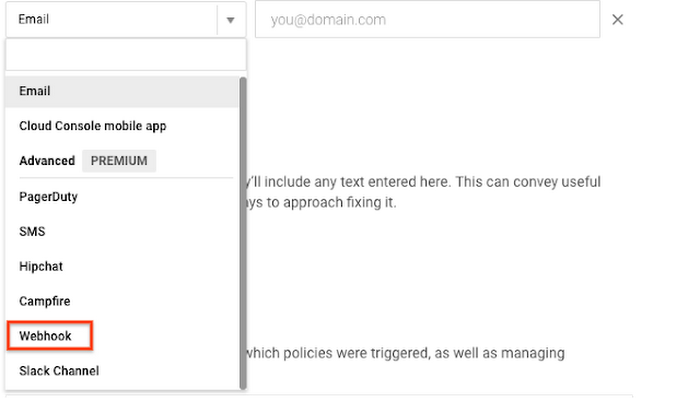
Select “Webhook” in the drop-down menu.
The system will most properly tell you that there is no webhook setup present. That’s because you haven’t specified any webhook receiver yet. Click on “Setup Webhook.”
(If you’ve already set up a webhook receiver, the system won’t offer you this option here.)
Therefore you need to go to the “select project” dropdown list (top left side, right next to the Stackdriver logo in the gray bar area). Click on the down arrow symbol (next to your project ID) and see at the bottom of the drop-down box the option “Account Settings.”
In the popup window, select “Notifications” (bottom of the left-side list under “Settings”) and then click on “Webhooks” at the top menu. Here you can add additional webhooks if needed.
Click on “Create webhook.”
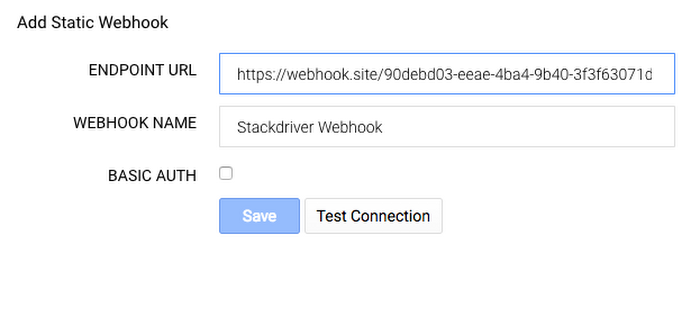
Remember to put in your webhook endpoint URL. In our test case, we do not need any authentication.
Click on “Test Connection” to verify and see your first webhook appearing on the test site!
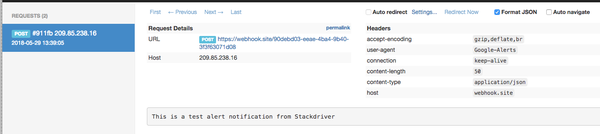
It should say “This is a test alert notification from Stackdriver.”
Now let’s continue with the Alerting Policy. Choose the newly created webhook by selecting “Webhook” as notification type and the webhook name (created earlier) as the target. If you want to have additional notification settings (like SMS, email, etc.), feel free to add those as well by clicking on “Add another notification.”
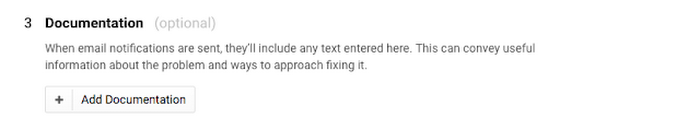
Once you add a notification, you can optionally add documentation by creating a so-called “Markdown document.” Learn more here about the Markdown language.
Last but not least, give the Alert Policy a descriptive name:
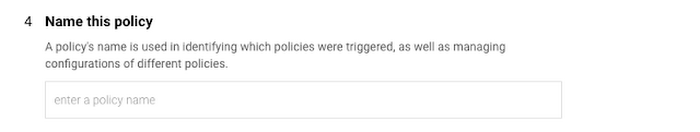
We decided to go super creative and call it “HTTP - uptime alert.” Once you have done this, click “Save Policy” at the bottom of the page.
Done! You just created your first policy. including a webhook to trigger alerts on incidents.
The policy should be green and the uptime check should report your service being healthy. If not, check your firewall rules.
Test your alerting
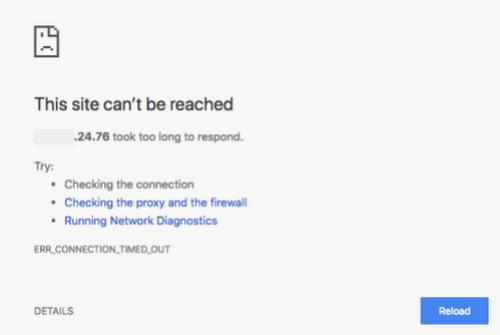
If everything is normal and works as expected, it is time to try your alerting policy. In order to do that, simply delete the “allow-http” firewall rule created earlier. This should result in a “service unavailable” condition for our Uptime Check. Remember to give it a little while. The Uptime Check will wait 10 seconds per region and overall one minute until it declares the service down (remember, we configured that here).Now you’ll see that you can’t reach the nginx web server instance anymore:
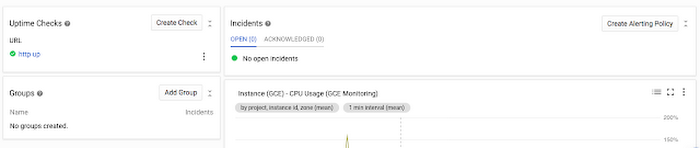
Now let’s go to the Stackdriver overview page to see if we can find the incident. Click on “Monitoring Overview” in the left-side menu at the very top:
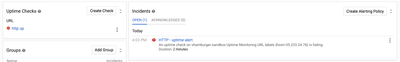
Indeed, the Uptime Check comes back red, telling us the service is down. Also, our Alerting Policy has created an incident saying that the “HTTP - uptime alert” has been triggered and the service has been unavailable for a couple of minutes now.
Let’s check the test receiver site to see if we got the webhook to trigger there:
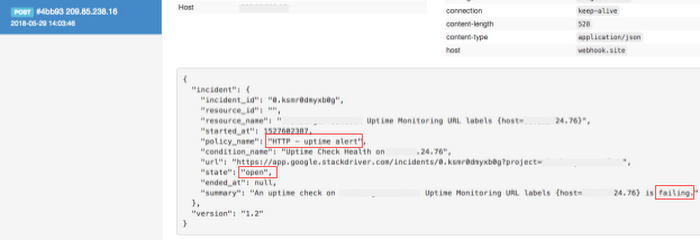
You can see we got the webhook alert with the same information regarding the incident. This information is passed on using the JSON format for easy parsing at the receiving end. You will see the policy name that was triggered (first red rectangle), the state “open,” as well as the “started at” timestamp in Unix time format (seconds passed since 1970). Also, it will tell you that the service is failing in the “summary” field. If you had configured any optional documentation, you’d see it using the JSON format (HTTP post).
Bring the service back
Now, recreate the firewall rule to see if we get an “incident resolved” message.Let’s check the overview screen again (remember to give it five or six minutes after the rule to react)
You can see that service is back up. Stackdriver automatically resolves open incidents once the condition restores. So in our case, the formerly open incident is now restored, since the Uptime Check comes back as “healthy” again. This information is also passed on using the alerting policy. Let’s see if we got a “condition restored” webhook message as well.
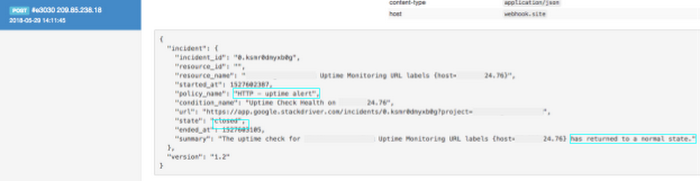
By the power of webhooks, it also told our test monitoring system that this incident is closed now, including useful details such as the ending time (Unix timestamp format) and a summary telling us that the service has returned to a normal state.
If you need to connect Stackdriver to a third-party monitoring system, webhooks is one extremely flexible way of doing this. It will let your operations team continue using their familiar go-to resources on-premises, while using all advantages of Stackdriver in a GCP (or AWS) environment. Furthermore, existing monitoring processes can be reused to bridge into the Google Cloud world.
Remember that Stackdriver can do far more than Uptime Checks, including log monitoring over source code monitoring, debugging and tracing user interactions with your application. Whether it’s alerting policy functionality, using the webhook messaging or other checks you could define in Stackdriver, all can be forwarded to a third-party monitoring tool. Even better, you can close incidents automatically once they have been resolved.
Have fun monitoring your cloud services!
Related content:
New ways to manage and automate your Stackdriver alerting policiesHow to export logs from Stackdriver Logging: new solution documentation
Monitor your GCP environment with Cloud Security Command Center