Our heads are in the clouds at the Museum of Borgmon Modern Art
Salim Virji
Site Reliability Engineer
Accelerate State of DevOps Report
Get a comprehensive view of the DevOps industry, providing actionable guidance for organizations of all sizes.
DownloadAs humans, we look to nature for inspiration, and much of our appreciation of beauty comes from natural forms. Who among us hasn’t lain on a hillside, looking for familiar shapes in the clouds?
As engineers, many of our interactions take place with a built environment that is entirely separate from nature. Still, we have deep connections with nature, and we might find images in unexpected places—even in the midst of a grim outage. To celebrate this, we are pleased to share with you a selection of images from Google’s ‘Museum of Borgmon Abstract Art.’
Borgmon, as you’ll recall from Chapter 10 of the SRE Book, is a system for alerting based on time-series data. For over a decade, it has provided Google SRE teams insight into system behavior and trends. It has also brought art and joy amidst our travails.
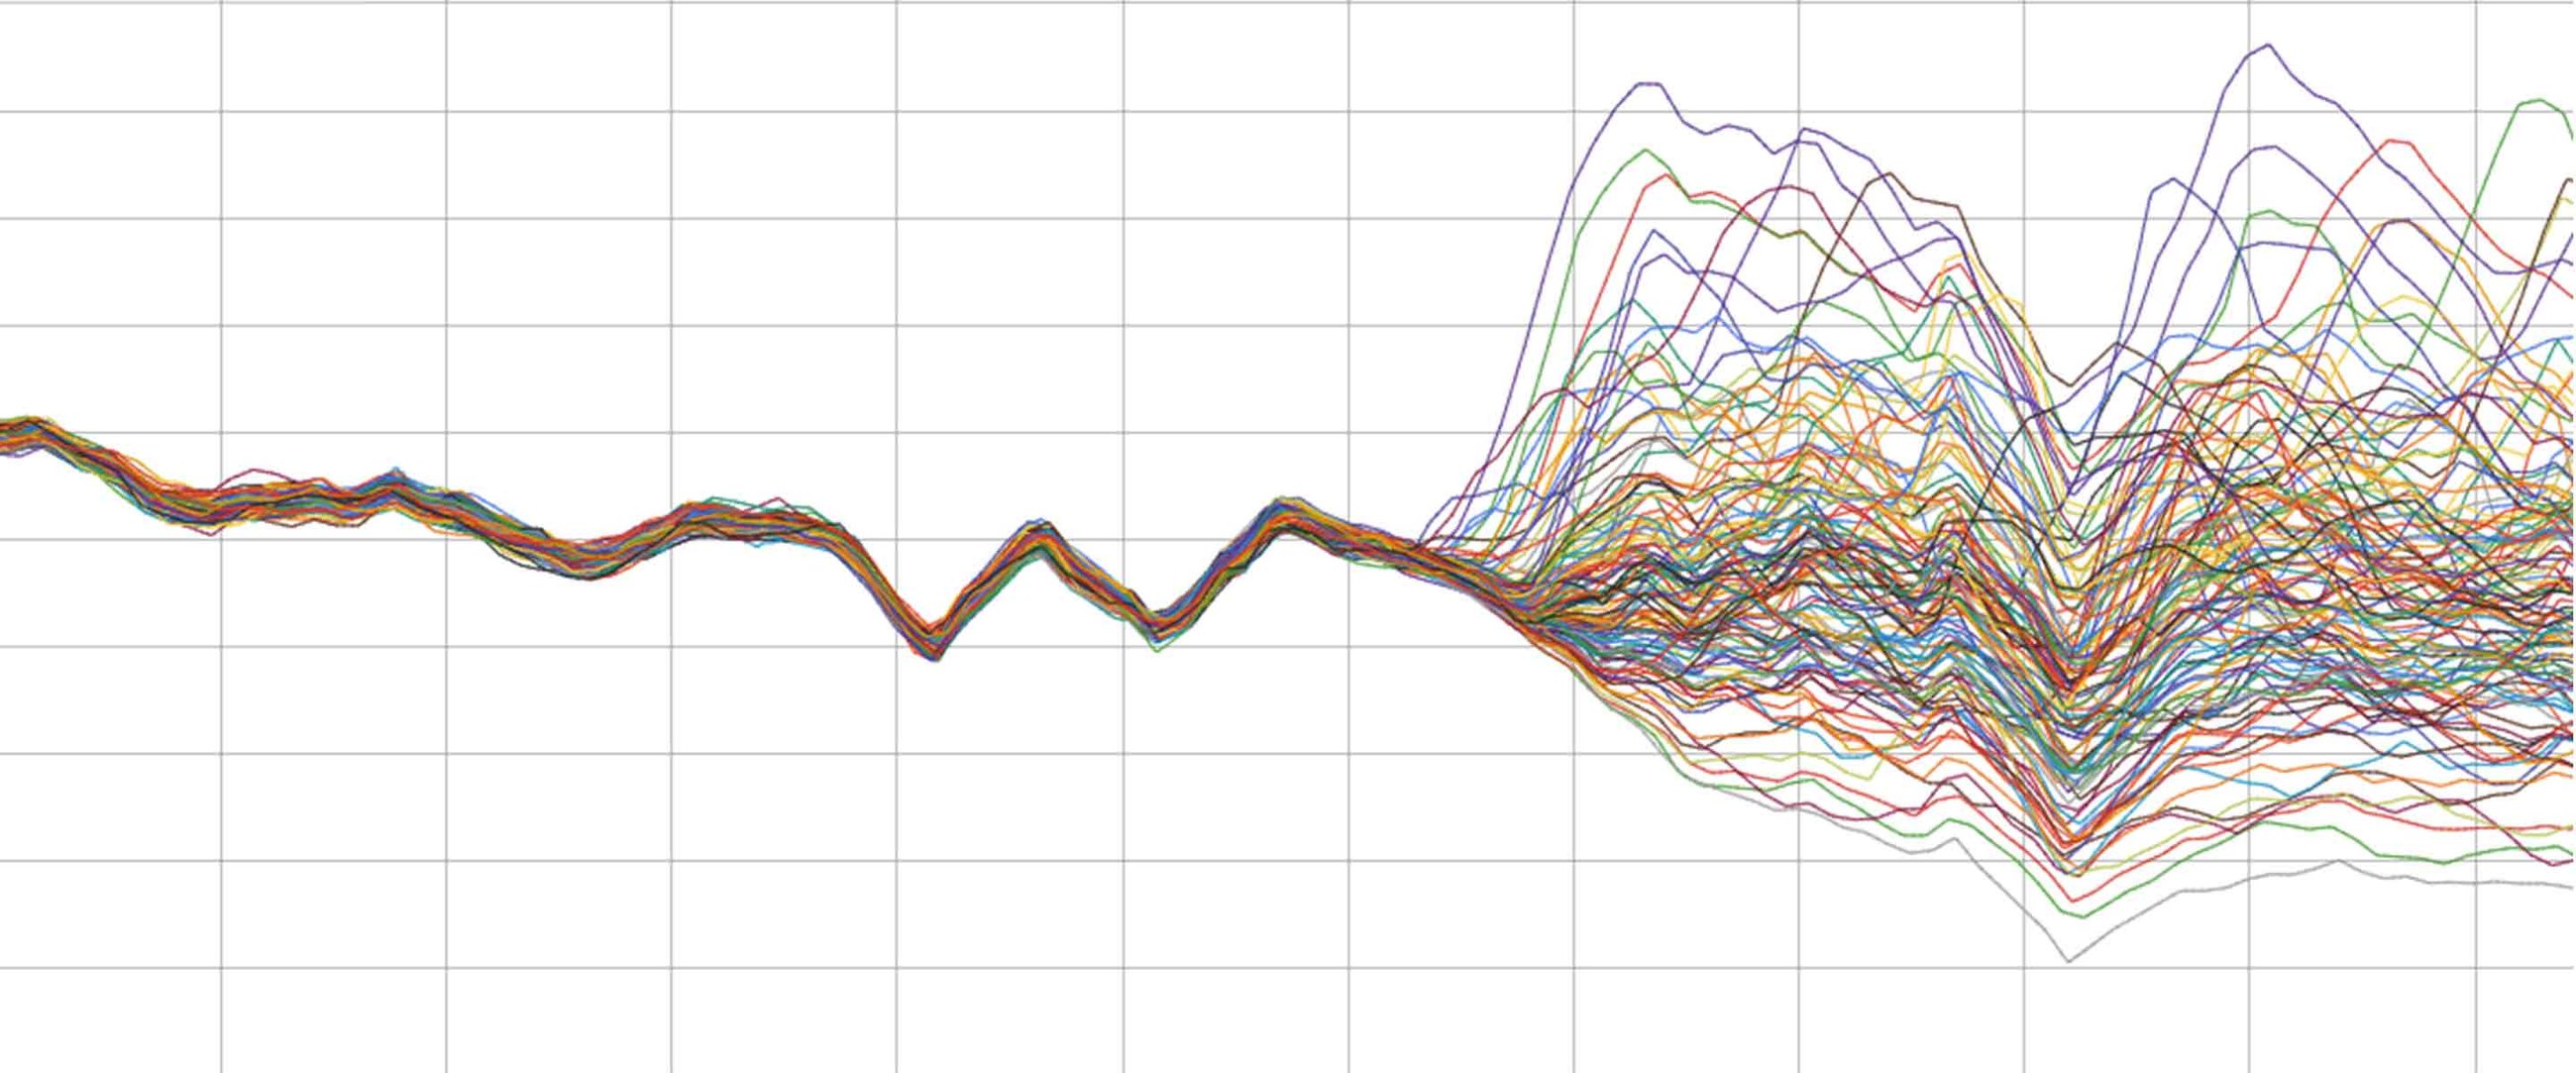
To wit, consider these images that we have found in our very monitoring systems:
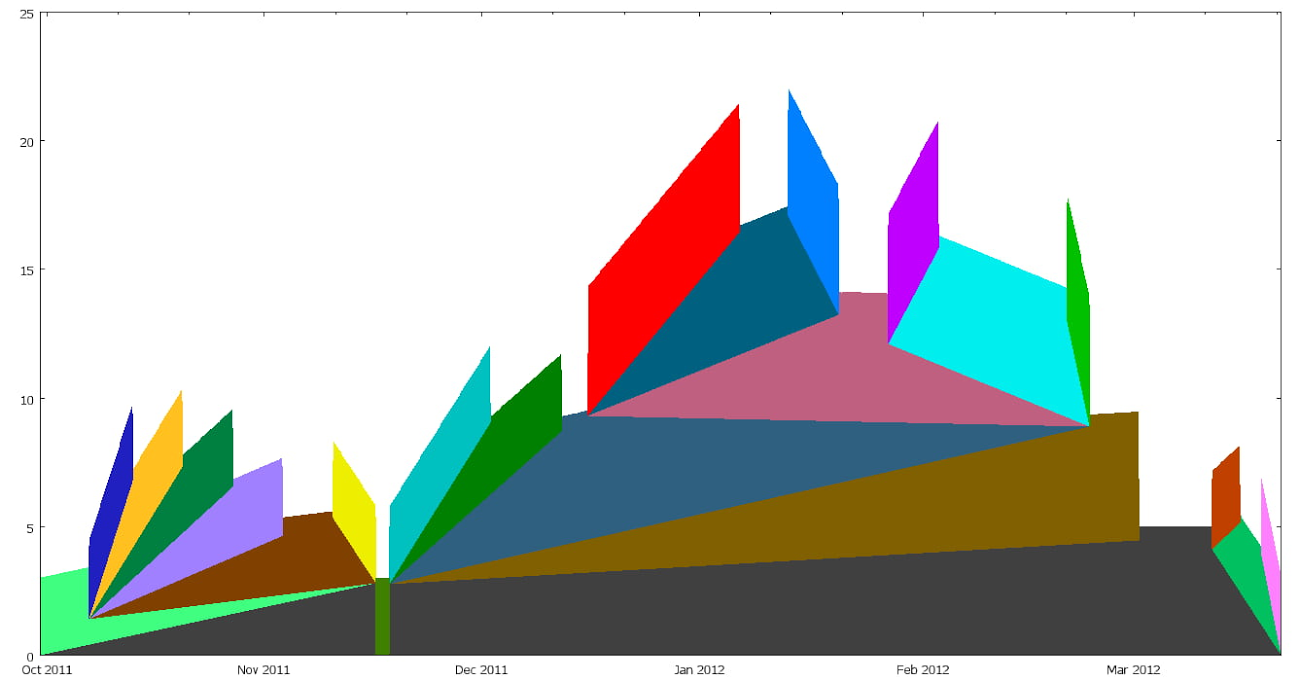
Fig. 1: Three-dimensional books
These bring us delight:
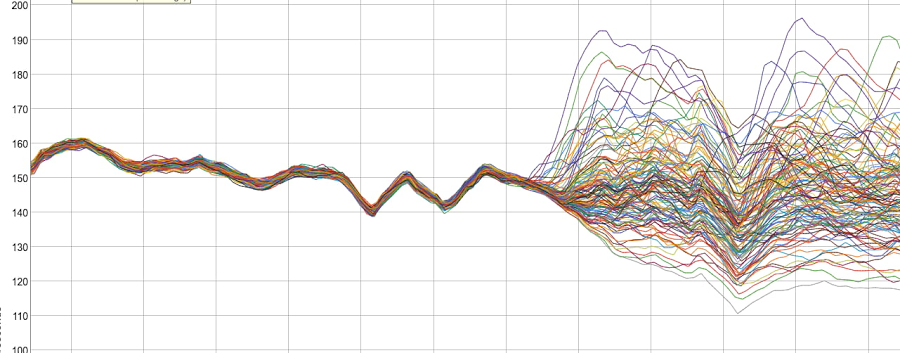
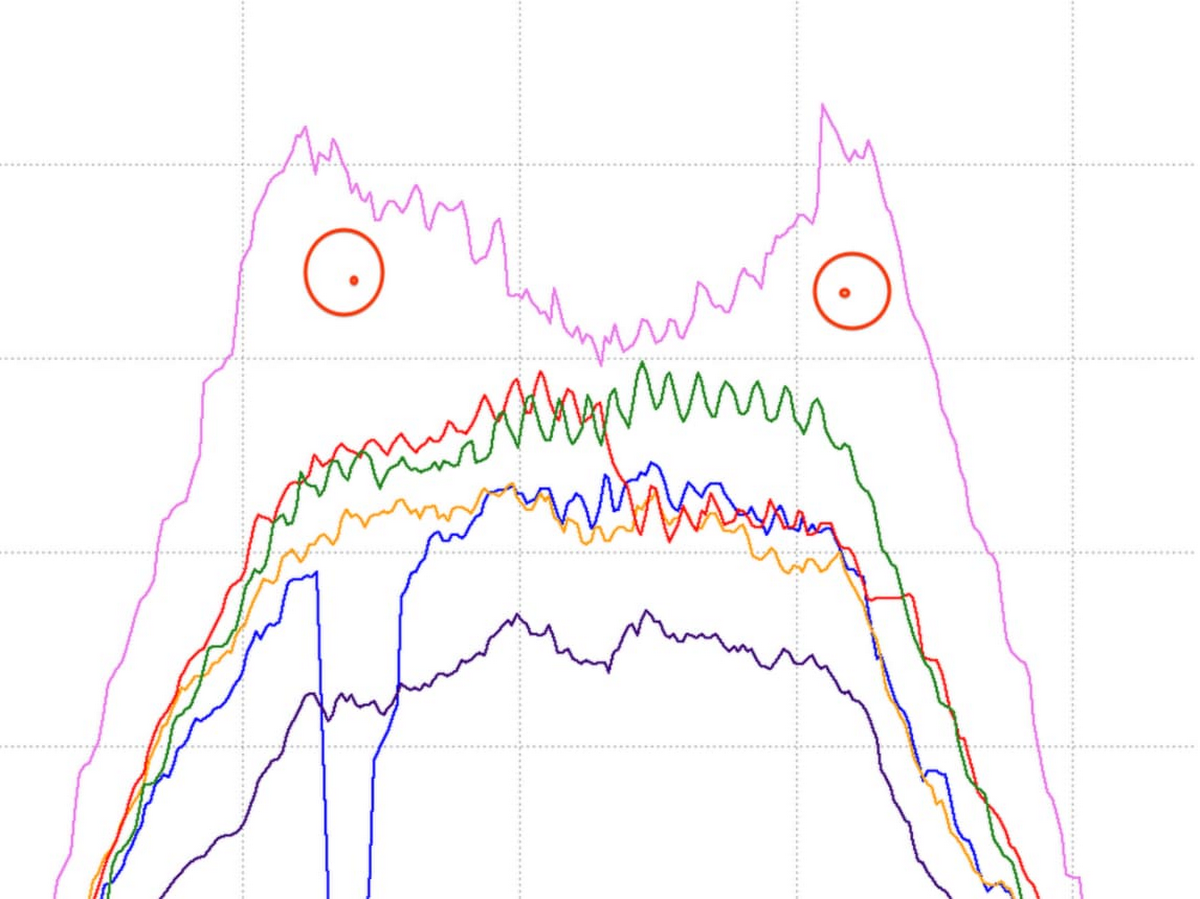
and, with the aid of our imagination, even some amusement:
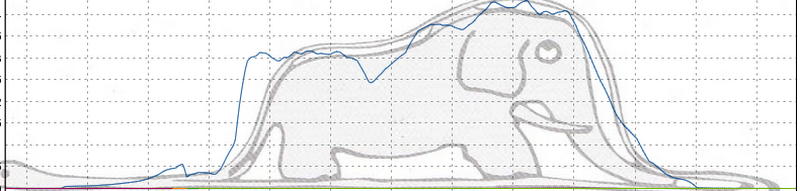
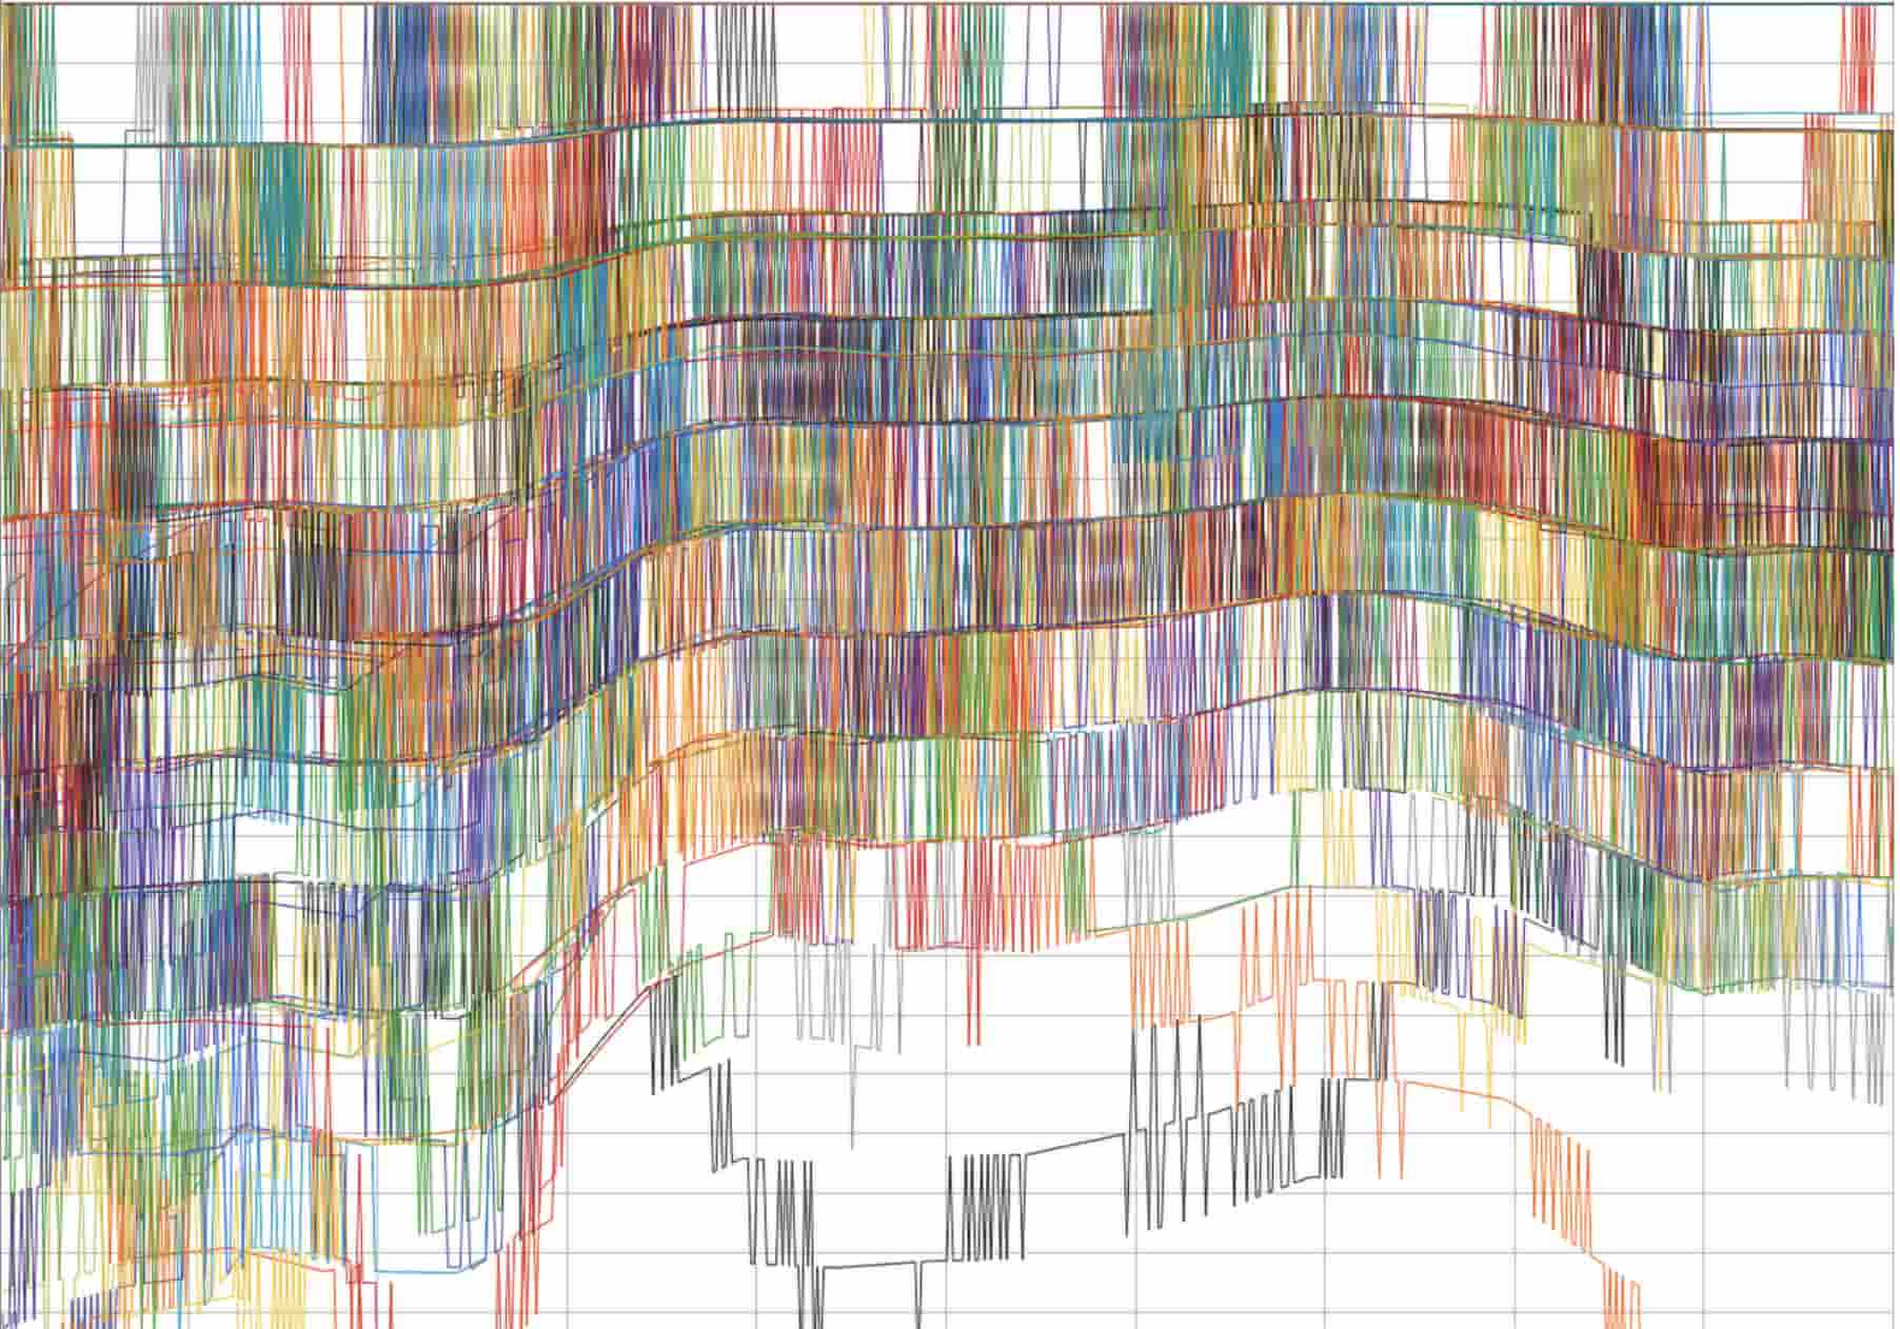
Fig. 4: A tapestry formed of per-task request rates
and—with a little added flourish—invent some creatures. With this, we present to you… the Borgmonster:
We like this alot.
You can see our gallery online at sre.google/mobaa.
When you come back to earth, read more about monitoring and observability in the Monitoring Distributed Systems chapter of the SRE Book and in the Monitoring chapter of the SRE Workbook. Then, ask yourself: What do the shapes, color palettes, and patterns of your monitoring say to you? Share them with @googlesre on Twitter using #SREArt.
Visit sre.google to learn more about SRE and industry-leading practices for service reliability.