How The Home Depot gets a single pane of glass for metrics across 2,200 stores
Ashish Kumar
Director, Site Reliability & Production Engineering, The Home Depot
Try Google Cloud
Start building on Google Cloud with $300 in free credits and 20+ always free products.
Free trial“Are we making it easier for customers to buy hammers or are we stuck on toil?” At The Home Depot, part of SRE’s responsibility is to keep our developers focused on building the technologies that make it easier for our customers to buy home improvement goods and services. So we like to use the hammer question as a barometer of whether a process or technology needs to be automated/outsourced, or whether it is something that deserves our attention as engineers.
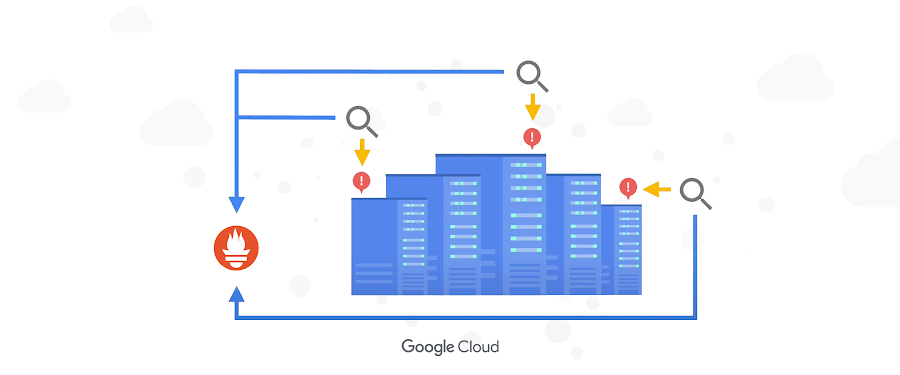
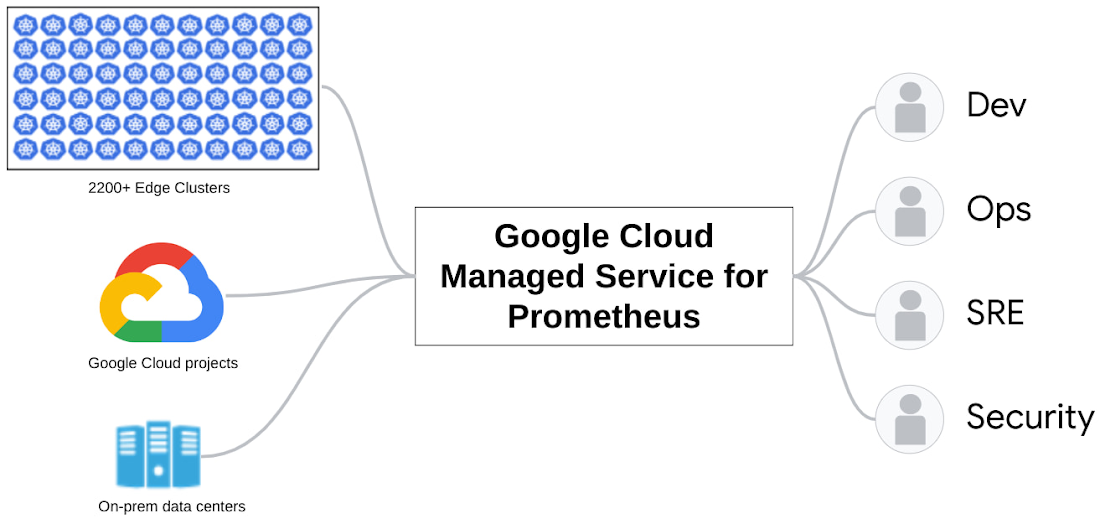
We run a highly distributed, hybrid- and multi-cloud IT environment at The Home Depot which connects our stores to our cloud and datacenters. You can read about the transformation that occurred when we switched to BigQuery, making sales forecasting, inventory management, and performance scorecards more effective. However, to collect that data for advanced analytics, our systems need to be up and running. Monitoring the infrastructure and applications that run across all of our environments used to be a complex process. Google Cloud Managed Service for Prometheus helped us pull together metrics, a key component of our observability stack, so we now have a single pane of glass view for our developers, operators, SRE, and security teams.
Monitoring more than 2,200 stores running bare metal Kubernetes
We run our applications in on-prem data centers, the cloud, and at the edge in our stores with a mix of managed and self-managed Kubernetes. In fact, we have bare-metal Kubernetes running at each of our store locations — over 2,200 of them. You could imagine the large number of metrics that we’re dealing with; to give you some sense, if we don’t compress data, egress from each of our stores can run in the 20-30 MBPS range. Managing these metrics quickly became a huge operational burden. In particular, we struggled with:
Storage federation: Open-source Prometheus is not built for scale. By default it runs on one machine and stores metrics locally on that machine. As your applications grow, you will quickly exceed the ability for that single machine to scrape and store the metrics. To deal with this you can start federating your Prometheus metrics, which means aggregating from multiple machines and storing them. We initially tried using Thanos, which is an open source solution to aggregate and store metrics, but it took a lot of engineering resources to maintain.
Uptime: As your federation becomes more complex, you need to maintain an ever-increasing infrastructure footprint and be ready to deal with changes to metrics that break the federation structure. Eventually, you have a team that is really good at running a metrics scraping, storage, and querying service. Going back to the question above: as an SRE manager, is running this metrics operation making it easier for customers to buy hammers, or is this operational toil that we need to consider outsourcing?
For us, the right answer was to simply use a service for all of this and we chose Google Cloud Managed Service for Prometheus. It allows us to keep everything we love about Prometheus including the ecosystem and the flexibility — we can monitor applications, infrastructure, and literally anything else that emits Prometheus-format metrics — while offloading the heavy operational burden of scaling it.
Creating a “single pane of glass” for observability at The Home Depot
Part of what I do as an SRE director is make the developers and operators on my team more effective by providing them processes and tools they can use to make better applications. Our observability stack provides a comprehensive view of logs, metrics, and traces that are connected in such a way that gives us visibility across our IT footprint and the data we need for root cause analysis.
Logs: We generate a huge amount of logs across our applications and infrastructure and we use BigQuery to store and query them. The powerful search capability of BigQuery makes it easy to pull up stack traces whenever we encounter an exception in our code workflows.
Metrics: We can keep an eye on what is happening in real time across our applications and infrastructure. In addition to the metrics we all are used to, I want to call out exemplars as particularly useful elements of our observability strategy. Exemplars add data, such as a traceID, to metrics that an application is producing. Without exemplars you have to investigate issues such as latency through guesswork across different UIs. It is inefficient and less precise to review a particular timeframe in the metrics, then review the same timeframe in your traces and draw the conclusion that some event happened.
Traces: We use OpenTelemetry and OpenTracing to provide visibility into traces and spans so we can create service and application dependency graphs.
What’s next for The Home Depot
We are working closely with the Google Cloud team to get even more features incorporated into Managed Service for Prometheus to help us round out our single-pane-of-glass goals. Support for exemplars in the managed collector is about to be added by the Google Cloud team and we will incorporate that as soon as it’s ready. Further, they are working to expand PromQL support throughout their Cloud operations suite so that their built-in alerting can use PromQL.
I am always looking for people who are passionate about Site Reliability Engineering and DevOps, so please take a look at our Home Depot jobs board. And if you want to get more in-depth on this topic, check out the podcast I did with the Google Cloud team.