Introducing lock insights and transaction insights for Spanner: troubleshoot lock contentions with pre-built dashboards
Mohit Gulati
Senior Product Manager
As a developer, DevOps engineer or a database administrator, you have to typically deal with database lock issues. Often, rows locked by queries cause lags and can slow down applications resulting in poor user experience. Today, we are excited to announce the launch of lock insights and transaction insights for Cloud Spanner that provide a set of new visualization tools for developers and database administrators to quickly diagnose lock contention issues on Spanner.
If you observe application slowness, a common issue could be lock contentions, which happen when multiple transactions are trying to modify the same row. Debugging lock contentions is not easy as it requires identifying the row ranges and columns on which transactions are contending for locks. This process can be tedious and time consuming without a visual interface. Today, we are solving this problem for customers.
Lock insights and transaction insights provide pre-built dashboards that make it easy to detect row ranges with the highest lock wait time, find transactions reading or writing on these row ranges, and identify the transactions with highest latencies causing these lock conflicts.
Earlier this year, we launched query insights for debugging query performance issues. Together with lock insights and transaction insights, these capabilities provide developers easy-to-use observability tools to troubleshoot issues and optimize the performance of their Spanner databases.Lock insights and transaction insights are available at no additional cost.
"Lock insights will be very helpful to debug lock contention which typically takes hours.” said Dominick Anggara, MSc., Staff Software Engineer at Kohl’s. “It allows the user to see the big picture, and make it easy to make correlations, and then narrow down to specific transactions. That’s what makes it powerful. Really looking forward to using this in production".
Why do lock issues happen?
Most databases take locks on data to prohibit other transactions from concurrently changing the data to preserve data integrity. When you access data with the intent to change it, a lock prohibits other transactions from accessing the data while it is being modified. But when the data is locked, it can negatively impact application performance as other tasks wait to access the data.
Cloud Spanner, Google Cloud’s fully managed horizontally scalable relational database service, offers the strictest concurrency-control guarantees, so that you can focus on the logic of the transaction without worrying about data integrity. To give you this peace of mind, and to ensure consistency of multiple concurrent transactions, Spanner uses a combination of shared locks and exclusive locks at the table cell level (granularity of row-and-column) and not at the whole row level. You can learn more about different types of Lock modes for Spanner in our documentation.
Follow a visual journey with pre-built dashboards
With lock insights and transaction insights, developers can smoothly move from detection of latency issues to diagnosis of lock contentions, and ultimately identification of transactions that are contending for locks. Once the transactions causing the lock conflicts are identified, you can then try to identify issues in each transaction that are contributing to the problem.
You could do this by following a simple journey where you can quickly confirm if the application slowness is due to lock contentions, correlate row ranges and columns which have the highest lock wait time with the transactions taking locks on these row ranges, identify the transactions with the highest latencies, and analyze these transactions which are contending on locks. Let's walk through an example scenario.
Diagnose application slowness
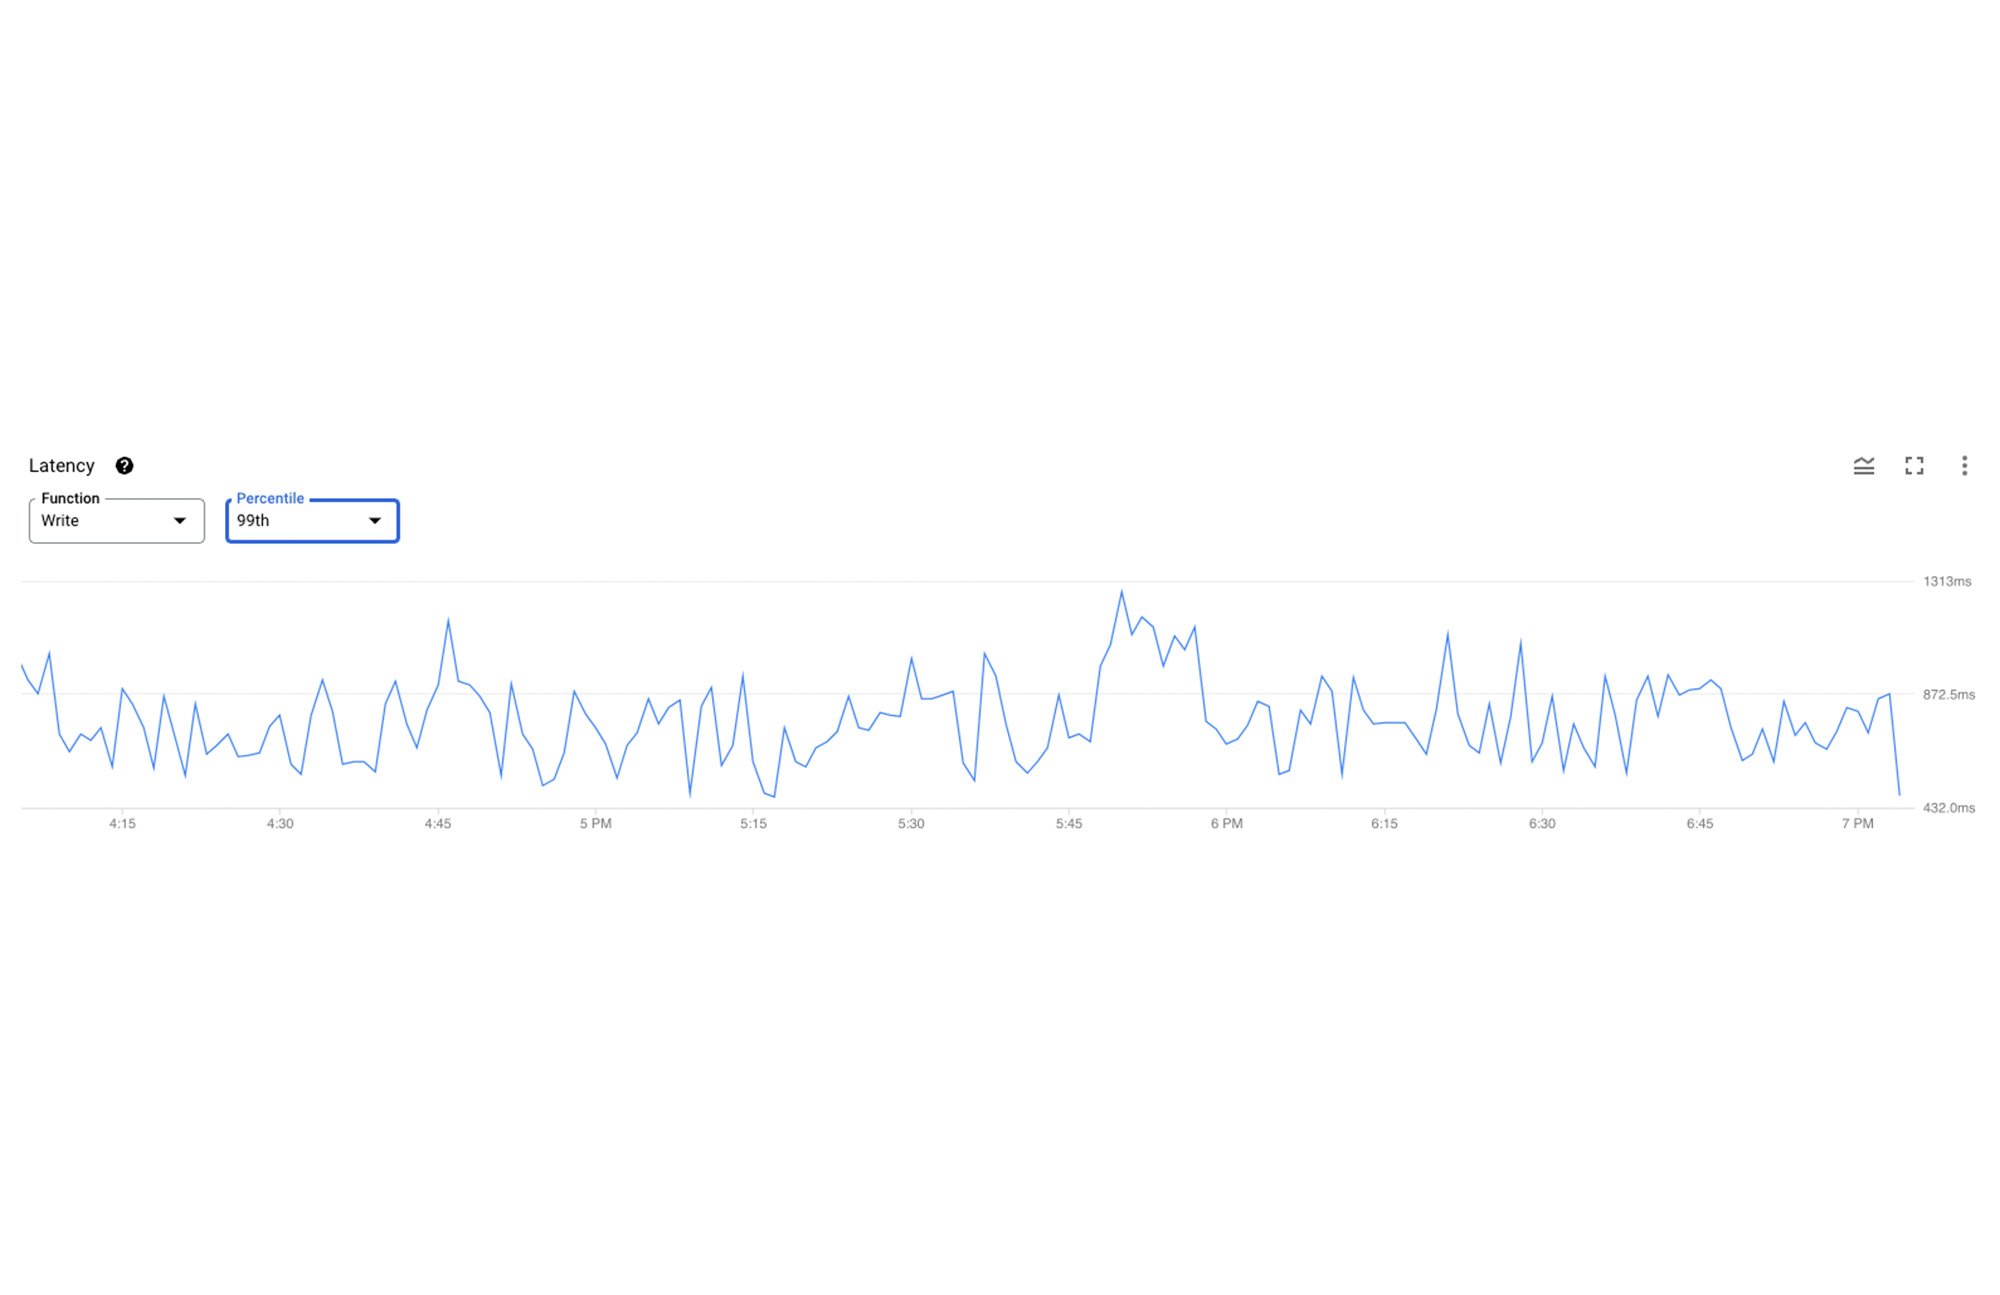
This journey will start by setting up an alert on Google Cloud Monitoring for latency (api/request_latencies) going above a certain threshold. The alert could be configured in a way that if this threshold is crossed, you will be notified with an email alert, with a link to the “Monitoring” dashboard.
Once you receive this alert, you would click on the link in the email, and navigate to the “Monitoring” dashboard. If you observe a spike in read/write latency, no observable spike in CPU utilization, and a dip in Throughput and/or Operations per second, a possible root cause could be lock contentions. A combination of these patterns in these metrics could be a strong signal that the system is locking due to the transactions contending on the same cells, even though the workload remains the same. Below, you can observe a spike between 5:45 PM and 6:00 PM. This could be due to new application code deployment which might have introduced a new access pattern.
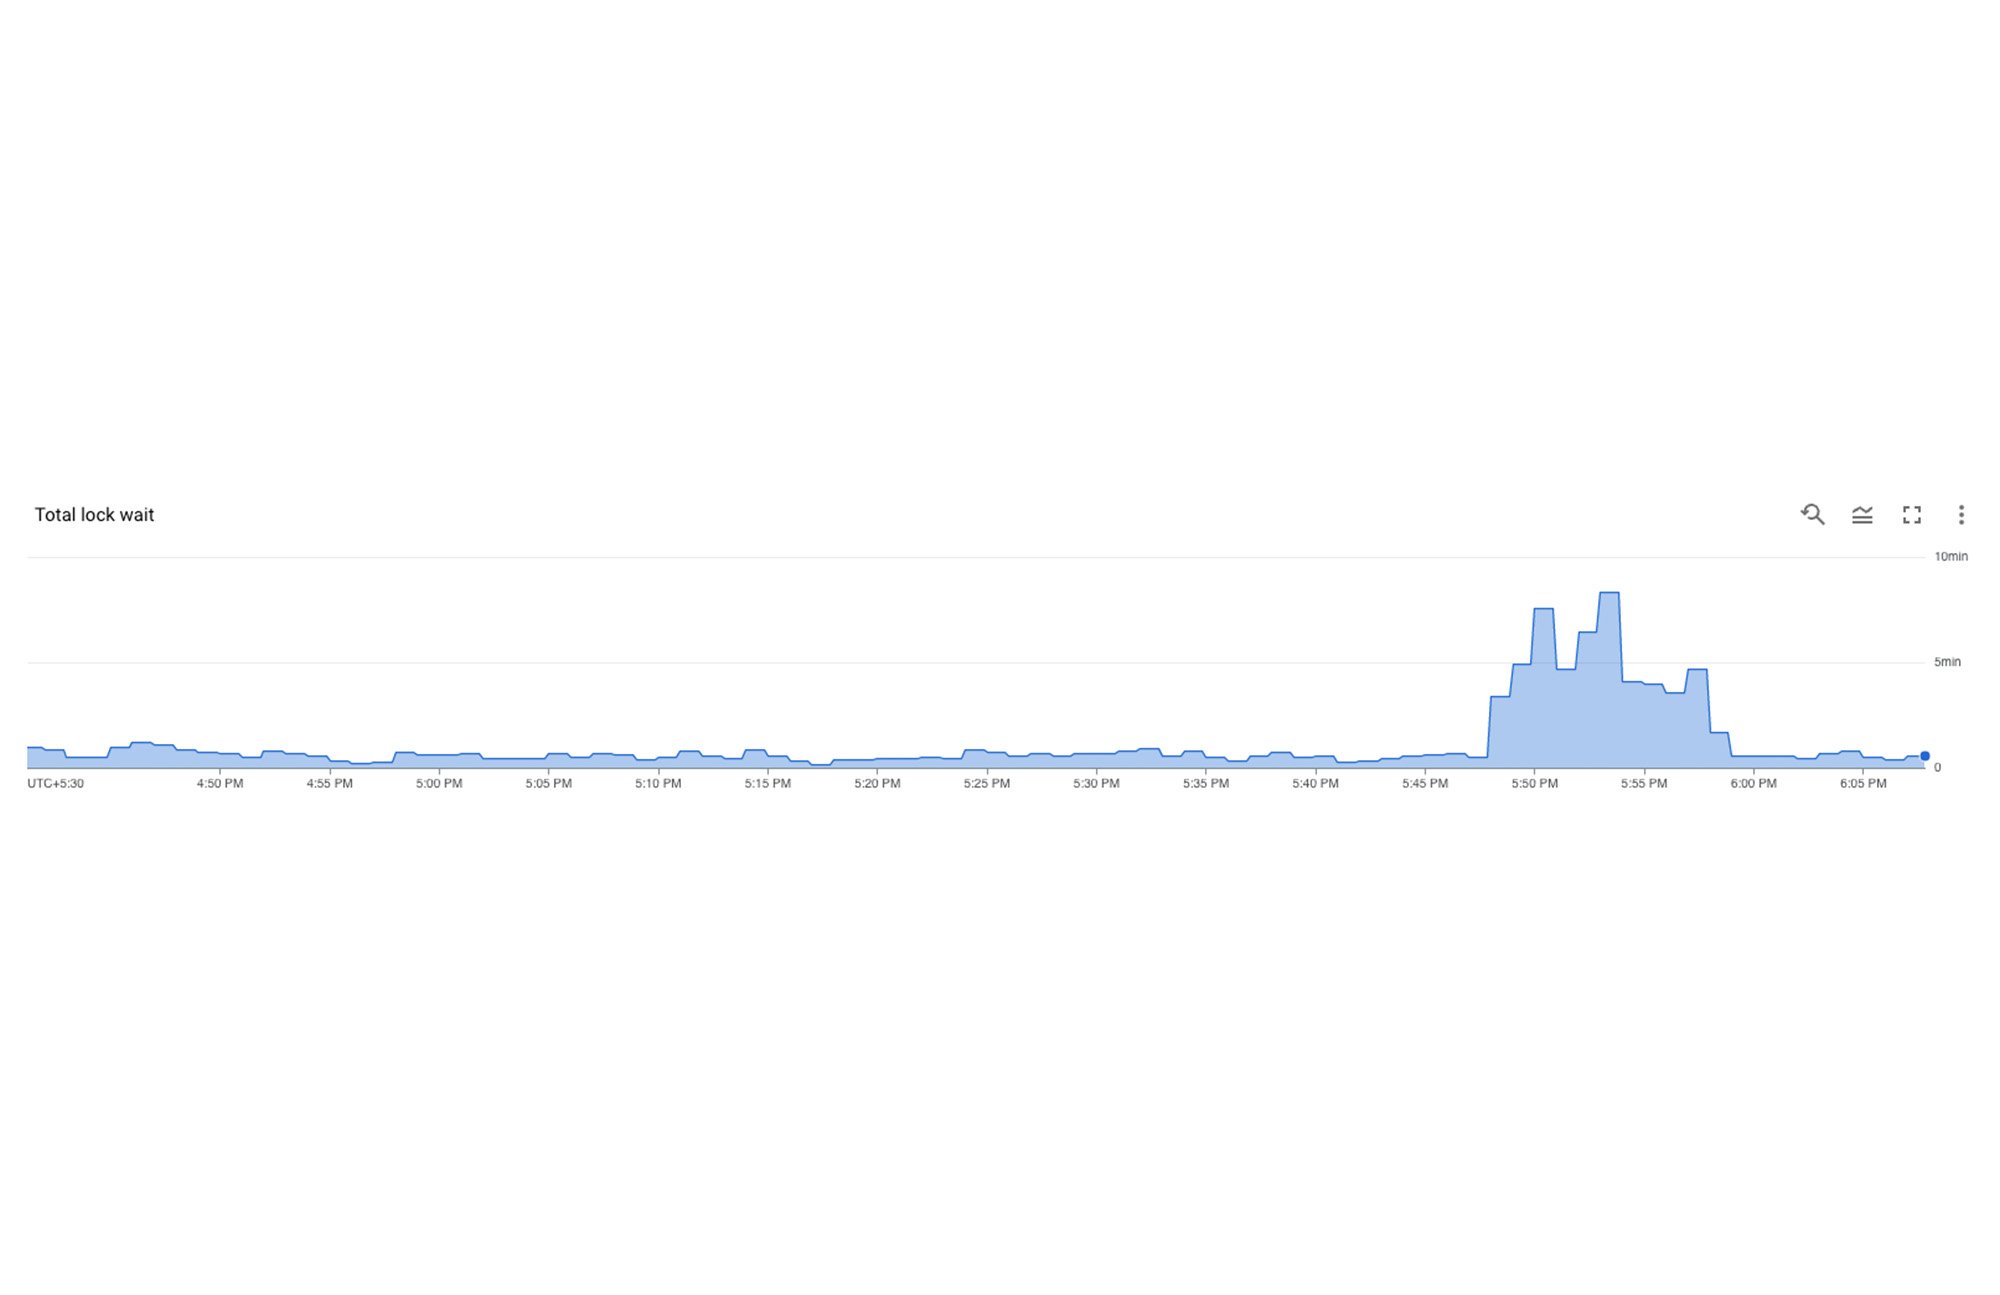
The next step is to confirm that this application slowness is indeed due to the lock contentions. This is where lock insights comes in. You can get to this tool by clicking on “Lock insights” in the left navigation of the Spanner Instance view in your Cloud Console. Here, the first graph that you see will be for Total lock wait time. If you observe a corresponding spike on this graph in the corresponding time window, this would confirm that the application's slowness is due to lock contentions.
Co-relating row ranges, columns and transactions
Now you can select the database which is seeing the spike in total lock wait time, and drill down to see the row ranges with the highest lock wait times. When a user clicks on a row-range which has the highest lock wait times, a right panel will open up. This will show sample lock requests for that row range which includes the columns which were read from or written to, the type of lock which was acquired on this row-column combination (database cell), and links to view the transactions which were contending for these locks. This helps co-relate row ranges, columns and transactions makes this journey seamless to switch between lock insights and transaction insights as explained in the next section.
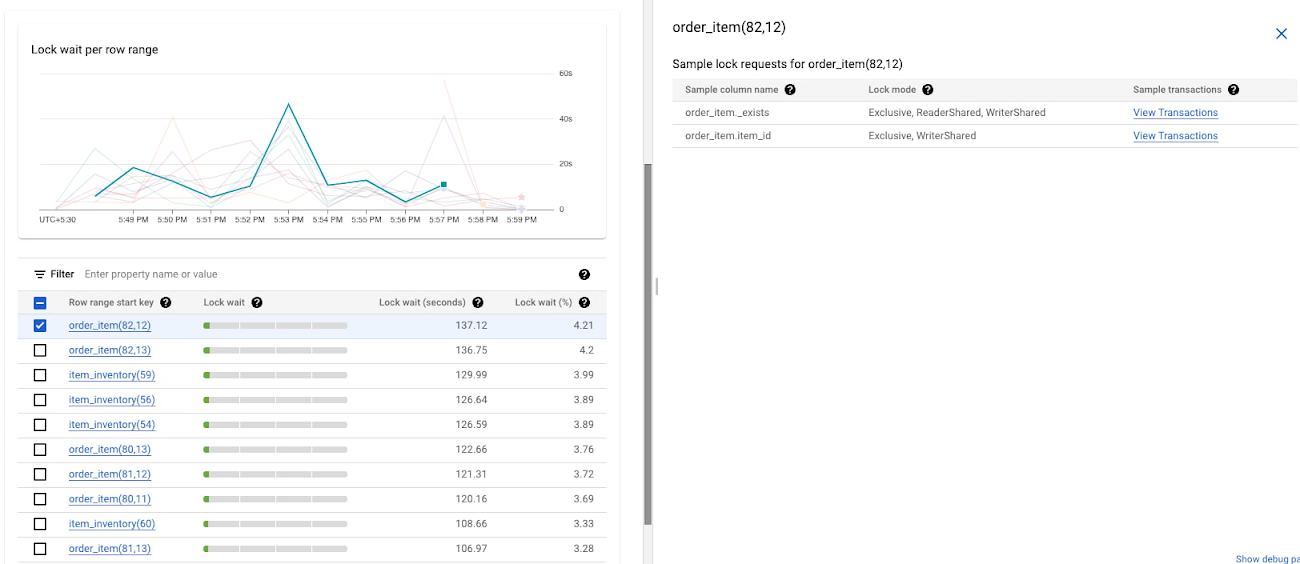
In the above screenshot, we can see that at 5:53 PM, the first row range in the table (order_item(82,12)) is showing the highest lock wait times. You can investigate further by looking at the transactions which were acting on the sample lock columns.
Identifying transactions with highest write latencies causing locks
When you click on “View transactions” on the lock insights page, you will navigate to the transaction insights page with the topN transactions table (by latency) filtered on the Sample lock Columns from the previous page (lock insights), so you will view the topN transactions in the context of the locks (and row ranges) which were identified earlier in the journey.
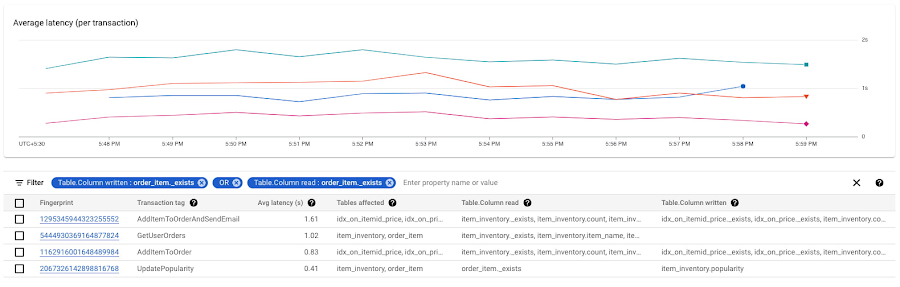
In this example we can see that the first transaction reading from and writing to columns item_inventory._exists, item_inventory.count has the highest latencies and could be one of the transactions causing lock contentions. We can also see that the second transaction in the table is also trying to read from the same column, and could be waiting on locks since the average latency is high. We should drill deep and investigate both these transactions.
Analyzing transactions to fix lock contentions
Once you have identified the transactions causing the locks, you can drill down into these transaction shapes to analyze the root cause of lock contentions.
You can do this by clicking on the Fingerprint ID for the specific transactions from the topN table, and navigating to the Transaction Details page where you will be able to see a list of metrics (Latency, CPU Utilization, Execution count, Rows Scanned / Rows Returned) over a time series for that specific transaction.
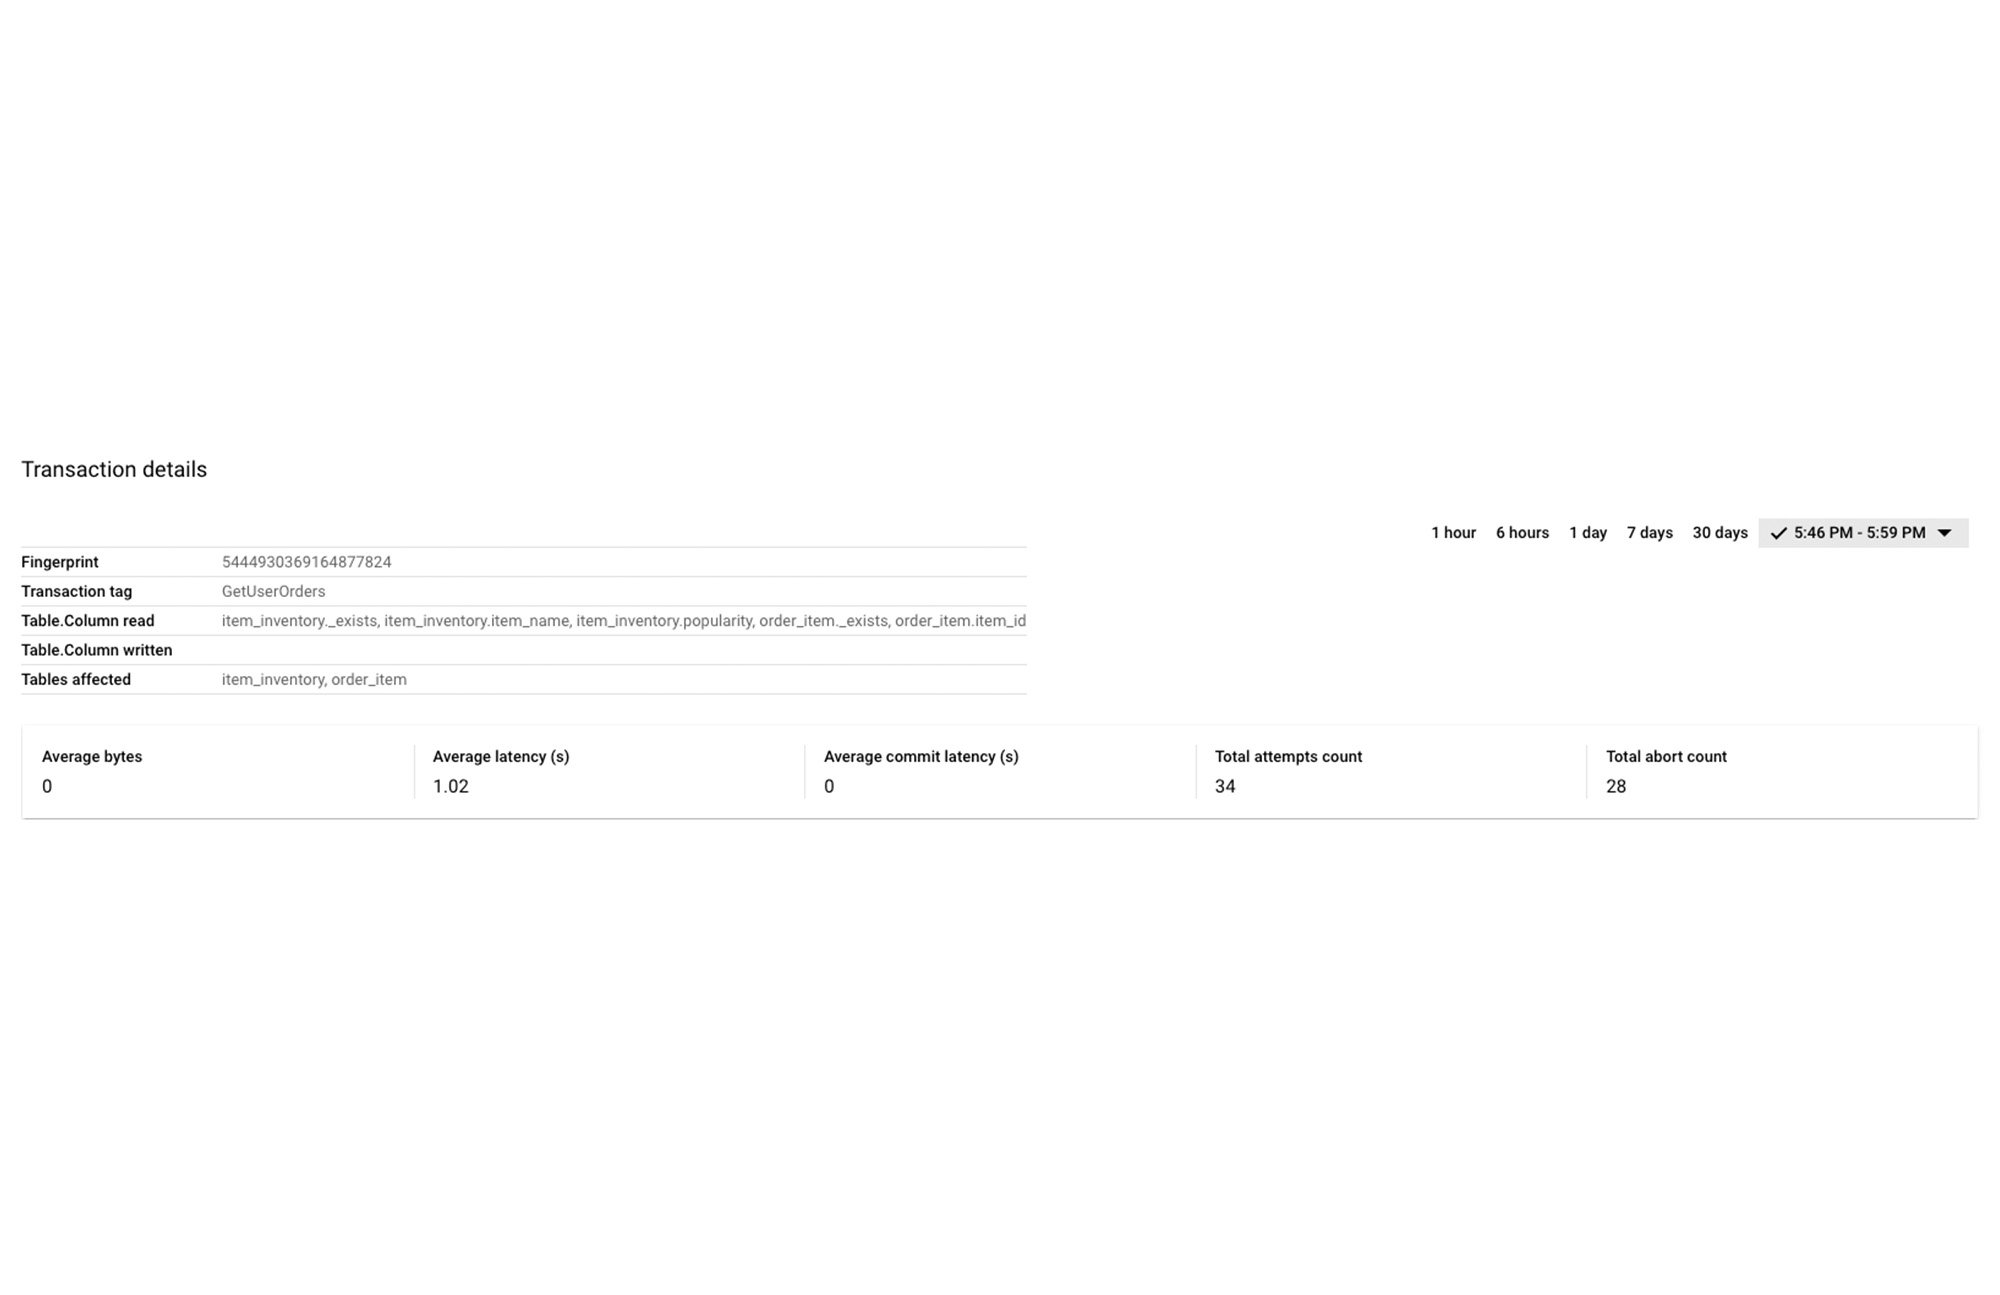
In this example, we notice that when we drill down into the second transaction, this transaction is only attempting to read and not write. By definition, the topN transactions table (on the previous page) only shows read-write transactions which take locks. We can also see that the abort count / total attempt count ratio (28/34) is very high, which means that most of the attempts are getting aborted.
Fixing the issue
To fix the problem in this scenario, you can convert this transaction from a read-write transaction to a read-only transaction, which would prevent it from taking locks on the cell, and thereby reducing lock contention and reducing write latencies.
By following this simple visual journey, you can easily detect, diagnose and fix lock contention issues on Spanner.
When looking at potential issues in your application, or even when designing your application, consider these best practices to reduce the number of lock conflicts in your database.
Get started with lock insights and transaction insights today
To learn more about lock insights and transaction insights, review the documentation here, and watch the explainer video here.
Lock insights and transaction insights are enabled by default. In the Spanner console, you can click on “Lock insights” and “Transaction insights” in the left navigation and start visualizing lock issues and transaction performance metrics!
New to Spanner? Create a 90-day Spanner free trial instance. Try Spanner for free.