Introducing Query plan samples for Cloud Spanner: get performance insights from query execution plans
Mohit Gulati
Senior Product Manager
Varun Gupta
Software Engineer
Cloud Spanner is a fully managed relational database that offers near unlimited scale, strong consistency, and industry leading high availability of up to 99.999%. Cloud Spanner also supports both GoogleSQL and PostgreSQL dialects. Providing an excellent troubleshooting experience is one of the most important focus areas for Cloud Spanner. Last year, we launched Query insights, which provides an easy way for developers and database administrators to quickly identify top Queries and DML statements queries (by CPU utilization) and then analyze the queries in detail by observing metrics related to these expensive queries. But what if you want to compare query execution plans for the same query?
Today, we are excited to announce the Preview of Query plan samples, a powerful visual tool that lets developers and DBAs visualize query execution plans for historical query executions. Query plan samples not only lets users quickly visualize the execution plan for samples of the selected query, but it also makes it easy for users to compare and contrast execution plans for instances of the same query. It helps answer the question most developers have — why did my query latency change?
Integration with Query insights
The Query insights dashboard helps users identify expensive queries, and users can then drill down into specific query performance by clicking on the fingerprint of the top N queries and navigating to Query details. Query plan samples is a new graph that we have added to the Query details page. Queries that consume high CPU are sampled, and these samples are represented as dots on the graph with time on the x-axis and latency of these samples on the y-axis. The user can select a dot, and visualize the query plan for that sample within the same screen. This makes it very easy for users to pinpoint the query execution samples that they want to compare, based on different latencies of different samples of the same query.
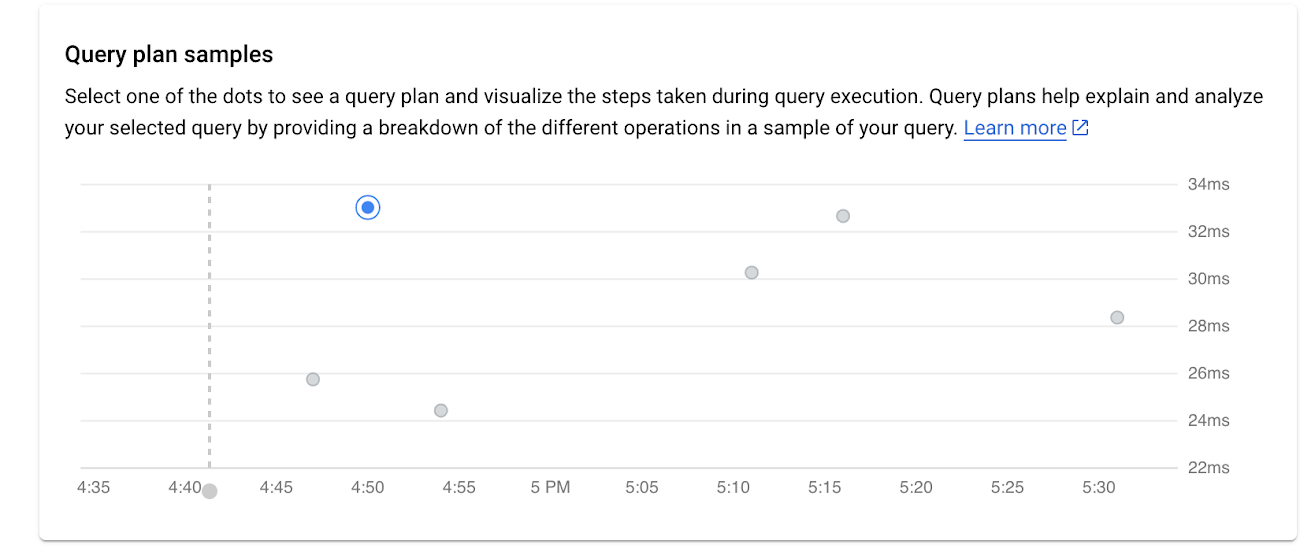
The Query plan samples graph shows all the query plans running at particular times and the amount of time each plan took to run. The sampling rate for the query plans is fixed to at most five samples per minute per database. Please note that sampling is only done for the top (by highest CPU utilization) queries and DML statements.
By default, the panel on the right shows the graphical representation of the latest query plan. To see the details for another sample query plan, you can select the respective dot on the graph. Expanded details show a model of all the operators in the query plan. When you select an operator, you can drill down to the details related to the operator. Also, in the Query plan, you’ll be able to see high level metrics like Total elapsed time, CPU time, Rows returned and Rows scanned for the query.
Use cases
You can use Query plan samples to observe different latencies due to query plan changes. Query plans could change due to the following reasons:
Changes to the schema by the user, for example, adding or removing an index
Change in query optimizer version
Updates to optimizer statistics package
Let’s walk through an example of how query plan samples help you understand a sudden increase in latency, which could be explained due to a schema change.
The user has found a query to be expensive in the the topN queries on Query insights, and navigates to the Query details page for that query.
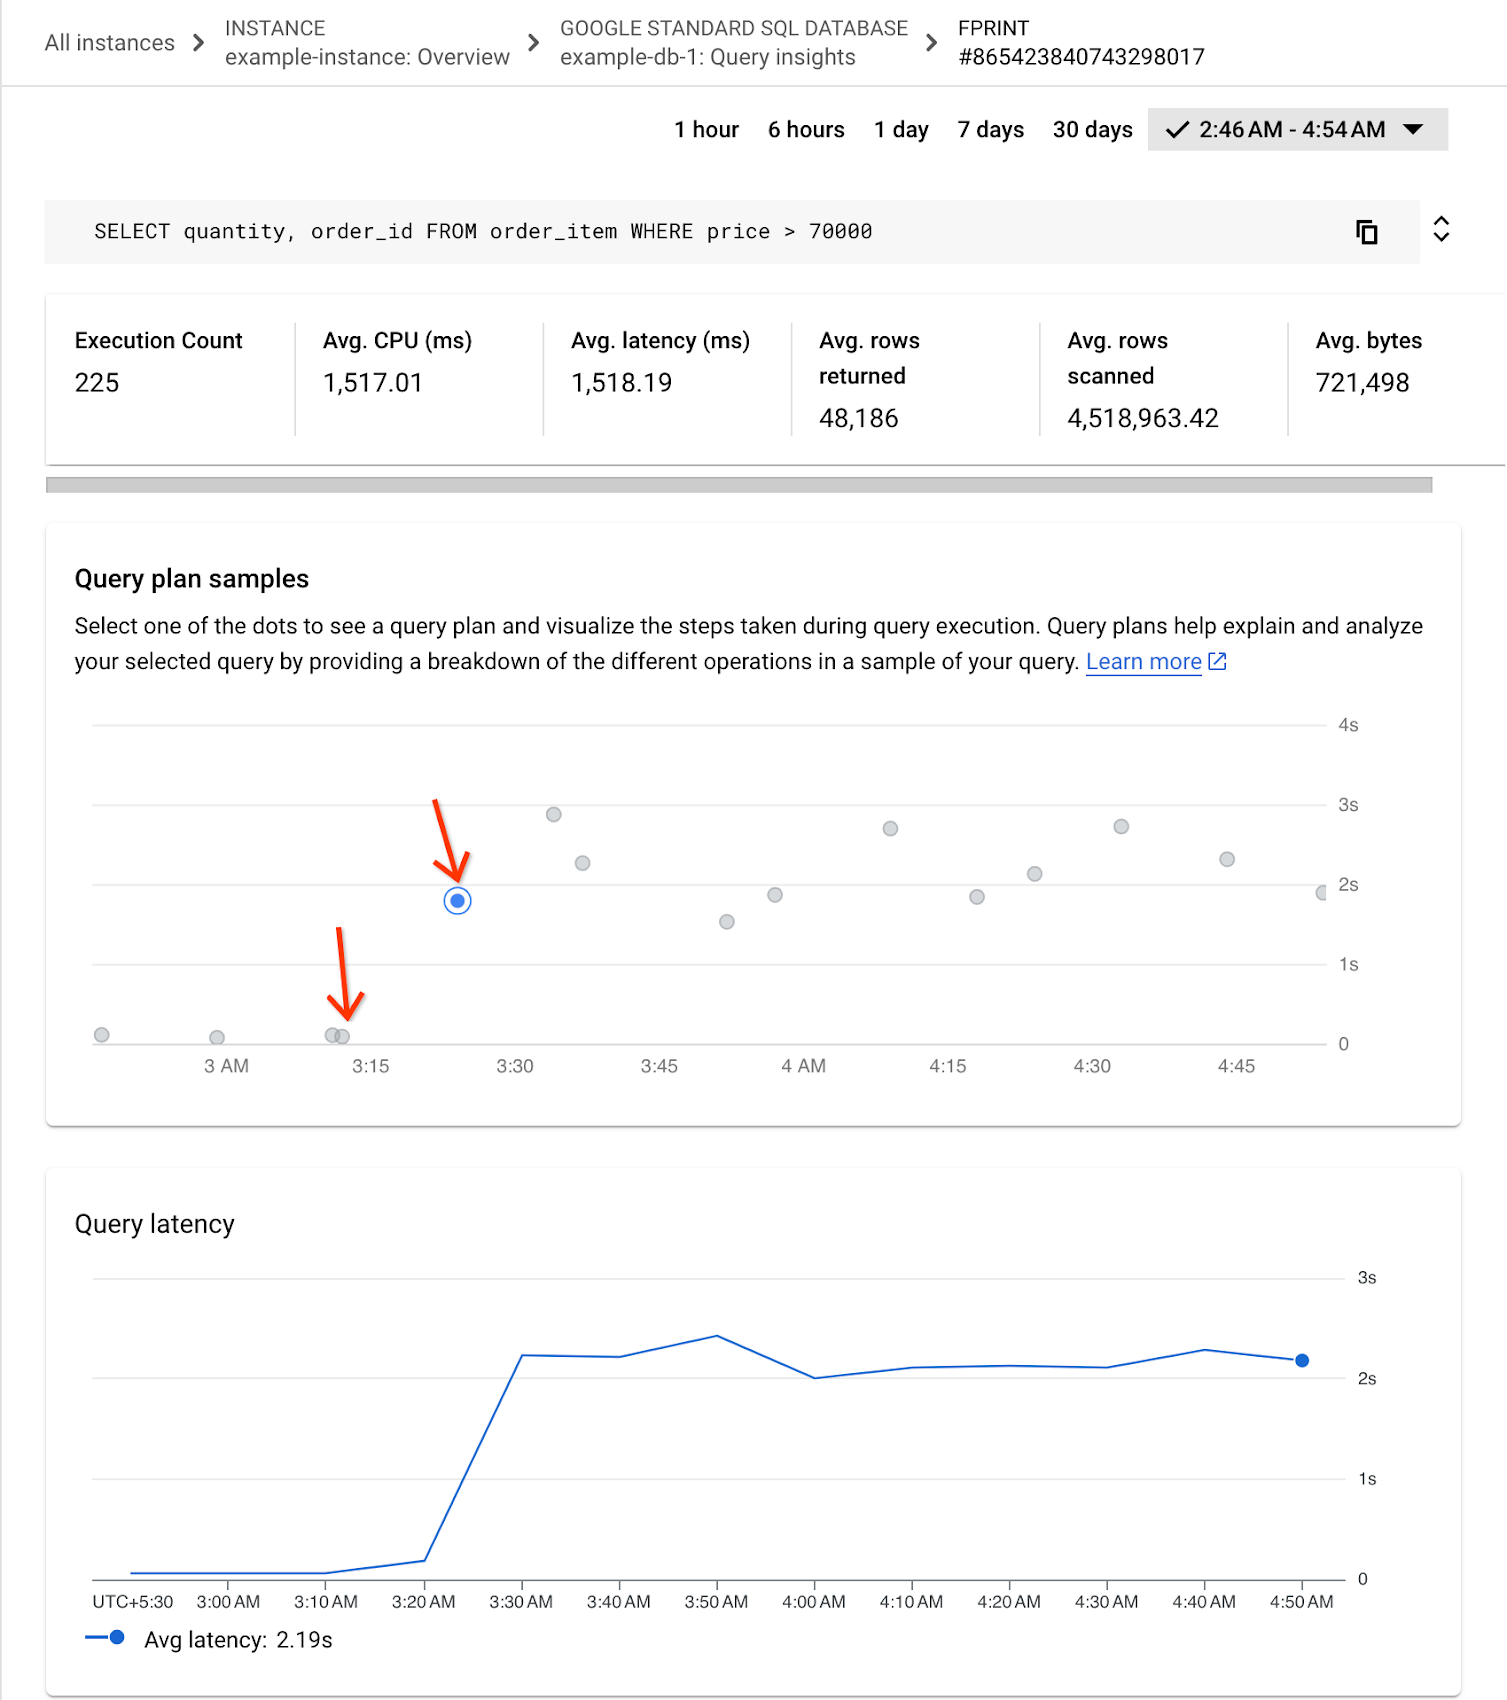
They can now observe two query plan samples in the first graph; one much slower (3:24 AM) than the other (3:12 AM) and correlate it to the sudden increase in average query latency, at 3:20 AM in the graph below.
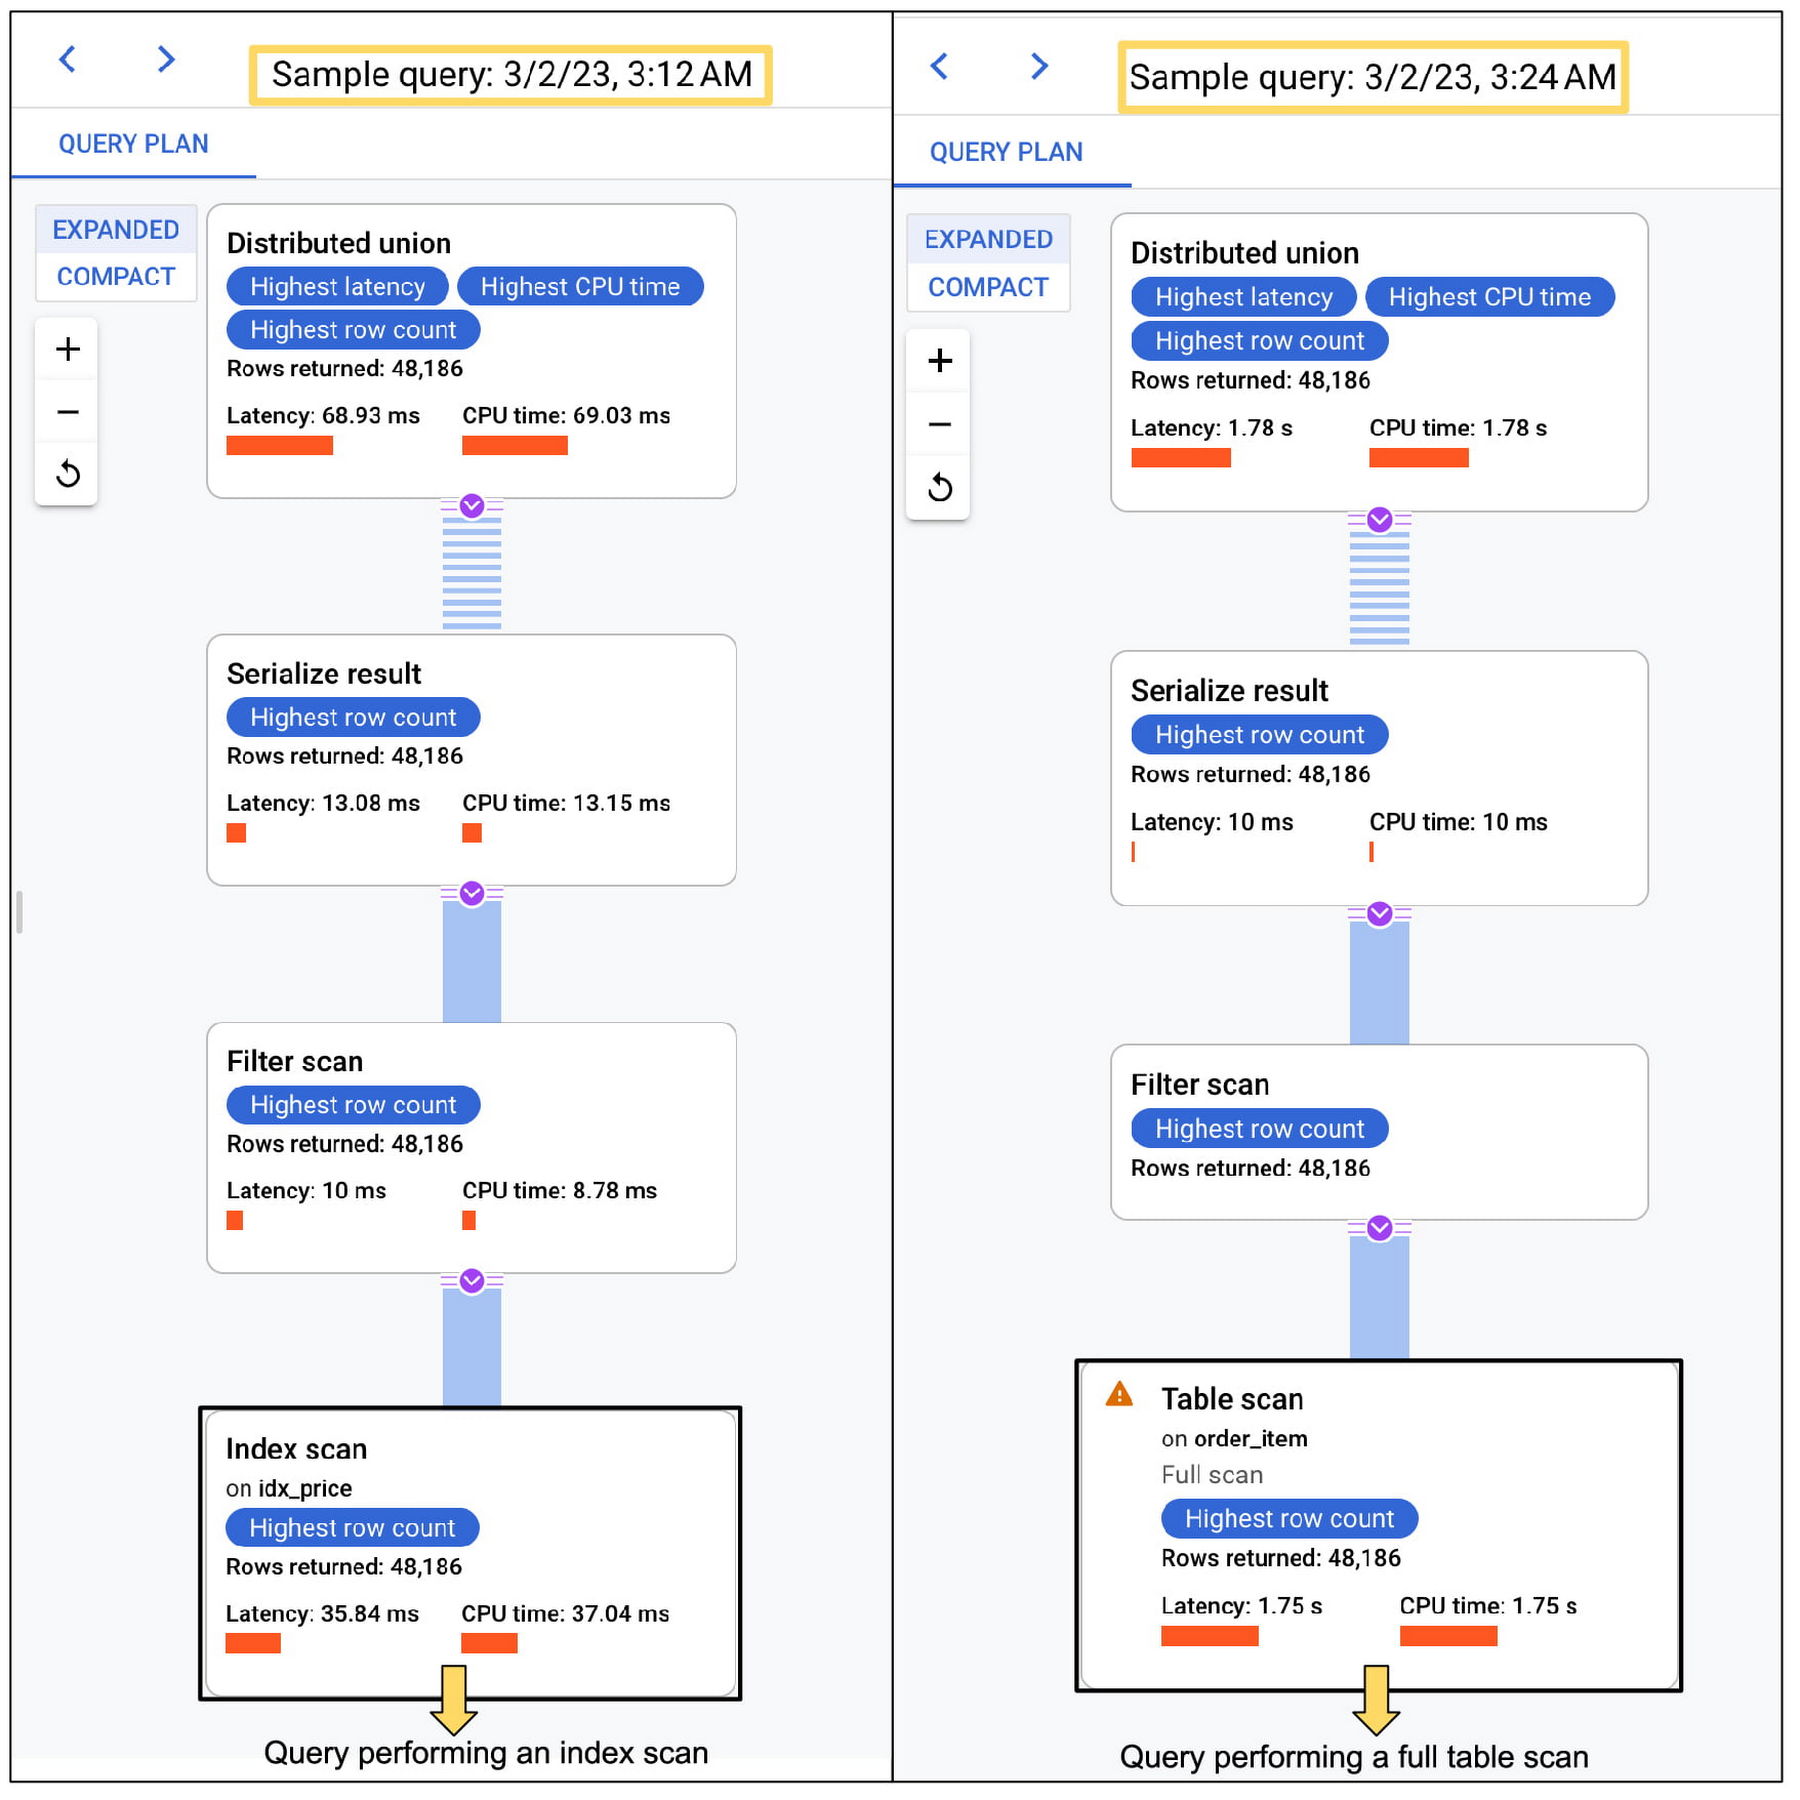
The query plan on the left shows that it is performing an index only scan via the index idx_price. This means that Spanner is only looking at the rows in the table that match the index. This is a fast operation, and the latency is around 68.93ms.
The query plan on the right shows that the database is performing a full table scan on the order_item table. This means that database is looking at every row in the table, regardless of whether they match the WHERE clause or not. This is a slow operation, and the latency is 1.78 seconds.
As you can see in the table below, the latencies of the query are taking 25 times longer to run after 3:20 AM than it did before 3:20 AM. This is likely due to the fact that the user dropped the index idx_price during the interval where the query regressed. This means that Spanner is no longer able to use the index to quickly find the rows that match the query criteria. Instead, it has to perform a full table scan, which is a much slower operation.
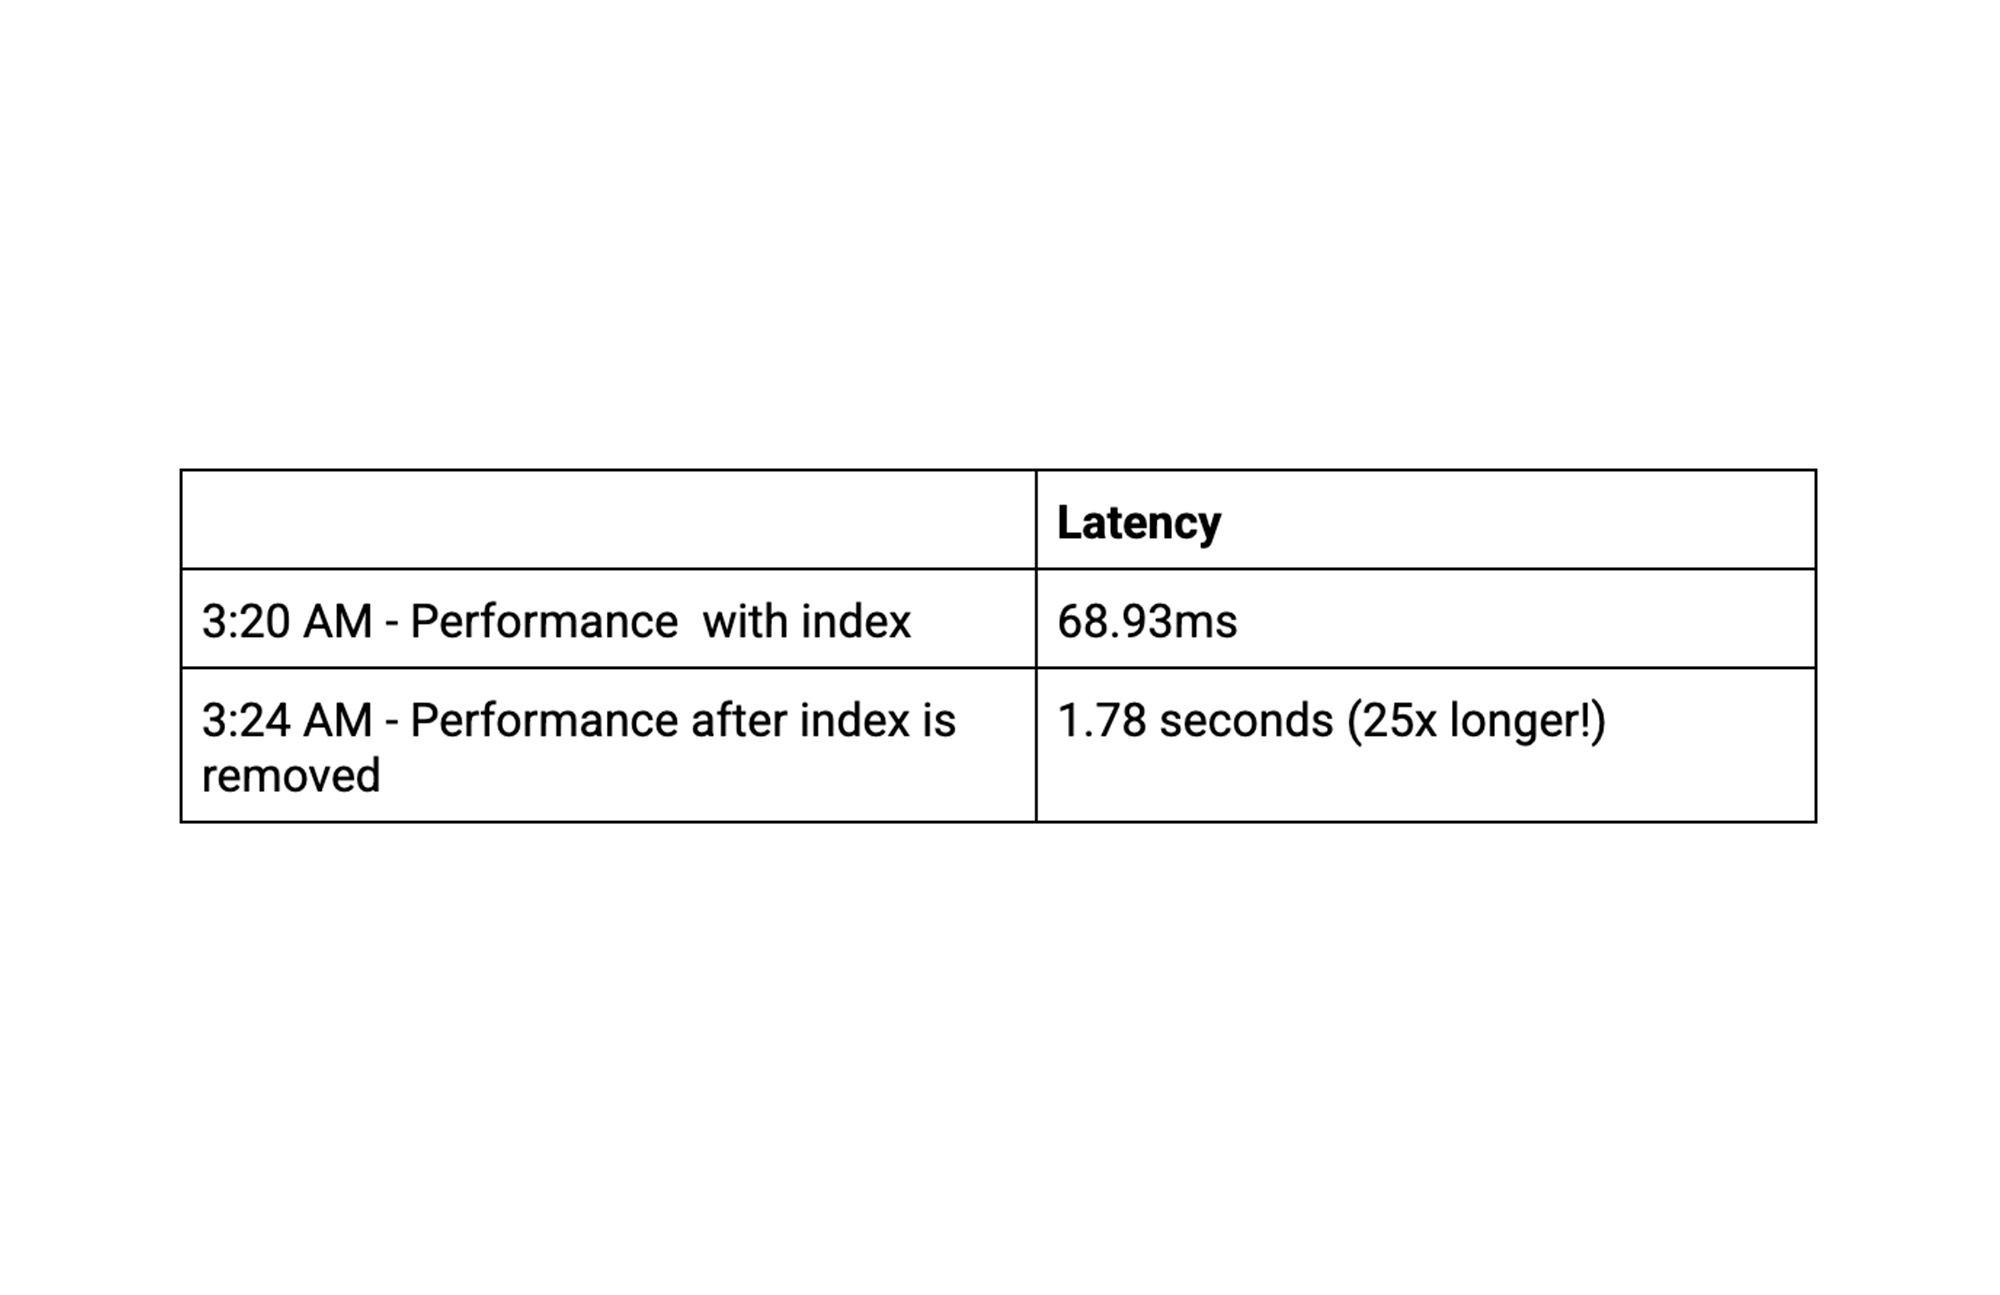
To fix this performance issue, the user can add the index idx_price back to the table. This will allow Spanner to use the index to quickly find the rows that match the query criteria, and the query will run much faster.
Users can also download the query execution plan in JSON format and share them with Google Cloud Support if and when they need assistance with debugging performance.
In summary, we can see that query plan samples is a powerful tool for developers to diagnose query performance issues and troubleshoot sudden change in query latencies.
Get started with Query plan samples today
Query plan samples are enabled by default, and are available at no extra cost. To learn more about Query plan samples, review the documentation here. Sampling is done with almost negligible performance impact, and it reduces the time developers and DBAs spend debugging performance issues. All metrics are protected by Google Cloud’s enterprise-class security, privacy and compliance.
New to Spanner? Create a 90-day Spanner free trial instance. Try Spanner for free!