Introducing Dataflow template to stream data to Splunk
Roy Arsan
Cloud Solutions Architect, Google
Sameer Abhyankar
Strategic Cloud Engineer
Editor's Note: To get started, follow our tutorial on deploying production-ready log exports to Splunk using Dataflow, and take advantage of associated Terraform scripts to automate deployment. To learn about latest feature enhancements since this announcement blog below, see What’s new with Splunk Dataflow template.
At Google Cloud, we’re focused on solving customer problems and meeting them where they are. Many of you use third-party monitoring solutions from Splunk to keep a tab on both on-prem and cloud environments. These use cases include IT ops, security, application development, and business analytics.
In this blog post, we’ll show you how to set up a streaming pipeline to natively push your Google Cloud data to your Splunk Cloud or Splunk Enterprise instance using the recently released Pub/Sub to Splunk Dataflow template. Using this Dataflow template, you can export data from Pub/Sub to Splunk. So, any message that can be delivered to a Pub/Sub topic can now be forwarded to Splunk. That includes logs from Cloud Logging (formerly Stackdriver Logging), messages from IoT devices, or events such as security findings from Cloud Security Command Center.
We hear that customers are using this template to meet the variety, velocity and volume of valuable data coming out of Google Cloud. “Google Cloud’s Pub/Sub to Splunk Dataflow template has been helpful for enabling Spotify Security to ingest highly variable log types into Splunk,” says Andy Gu, Security Engineer at Spotify. “Thanks to their efforts, we can leverage both Google's Pub/Sub model and Splunk's query capabilities to simplify the management of our detection and response infrastructure and process over eight million daily events.”
The step-by-step walkthrough covers the entire setup, from configuring the originating log sinks in Cloud Logging to the final Splunk destination—the Splunk HTTP Event Collector (HEC) endpoint.
Streaming vs. polling data
Traditionally, Splunk users have the option to pull logs from Google Cloud using Splunk Add-on for Google Cloud Platform as a data collector. Specifically, this add-on runs a Splunk modular input that periodically pulls logs from a Pub/Sub topic that’s configured as a log sink export. This documented solution works well, but it does include tradeoffs that need to be taken into account:
Requires managing one or more data collectors (a.k.a., Splunk-heavy forwarders) with added operational complexity for high availability and scale-out with increased log volume
Requires external resource access to Google Cloud by giving permissions to aforementioned data collectors to establish subscription and pull data from Pub/Sub topic(s)
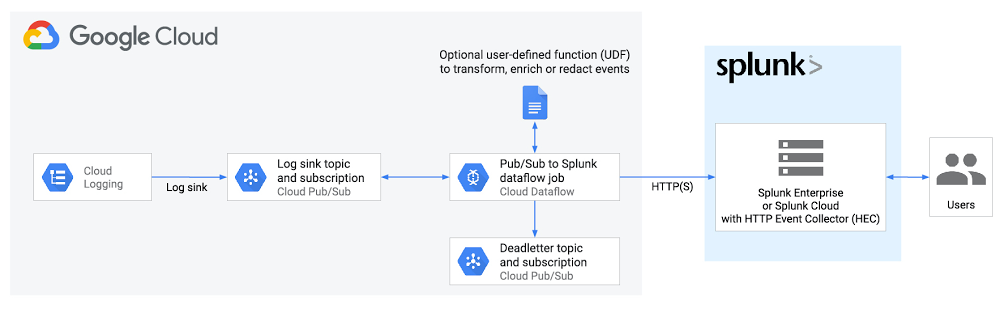
We’ve heard from you that you need a more cloud-native approach that streams logs directly to a Splunk HTTP(S) endpoint, or Splunk HEC, without the need to manage an intermediary fleet of data collectors. This is where the managed Cloud Dataflow service comes into play: A Dataflow job can automatically pull logs from a Pub/Sub topic, parse and convert payloads into the Splunk HEC event format, apply an optional user-defined function (UDF) to transform or redact the logs, then finally forward to Splunk HEC. To facilitate this setup, Google released the Pub/Sub to Splunk Dataflow template with built-in capabilities like retry with exponential backoff (for resiliency to network failures or in case Splunk is down) and batch events and/or parallelize requests (for higher throughput) as detailed below.
Set up logging export to Splunk
This is how the end-to-end logging export looks:
Below are the steps that we’ll walk through:
- Set up Pub/Sub topics and subscriptions
- Set up a log sink
- Set IAM policy for Pub/Sub topic
- Set up Splunk HEC endpoint
- Set up and deploy Pub/Sub to the Splunk Dataflow template
Set up Pub/Sub topics and subscriptions
First, set up a Pub/Sub topic that will receive your exported logs, and a Pub/Sub subscription that the Dataflow job can later pull logs from. You can do so via the Cloud Console or via CLI using gcloud. For example, using gcloud looks like this:
Note: It is important to create the subscription before setting up the Cloud Logging sink to avoid losing any data added to the topic prior to the subscription getting created.
Repeat the same steps for the Pub/Sub deadletter topic that holds any undeliverable message to Splunk HEC, due to misconfigurations such as an incorrect HEC token or any processing errors during execution of the optional UDF function (see more below) by Dataflow:
Set up a Cloud Logging sink
Create a log sink with the previously created Pub/Sub topic as destination. Again, you can do so via the Logs Viewer, or via CLI using gcloud logging. For example, to capture all logs in your current Google Cloud project (replace [MY_PROJECT]), use this code:
Note: The Dataflow pipeline that we’ll be deploying will itself generate logs in Cloud Monitoring that will get pushed into Splunk, further generating logs and creating an exponential cycle. That’s why the log filter above explicitly excludes logs from a job named “pubsub2splunk” which is the arbitrary name of the Dataflow job we’ll use later on. Another way to avoid that cycle is to set up the logging export in a separate dedicated “logging” project—generally a best practice.
Refer to sample queries for resource or service-specific logs to be used as the log-filter parameter value above. Similarly, refer to aggregated exports for examples of “gcloud logging sink” commands to export logs from all projects or folders in your Google Cloud organization, provided you have permissions. For example, you may choose to export the Cloud Audit Logs from all projects into one Pub/Sub topic to be later forwarded to Splunk.
The output of this last command is similar to this:
Take note of the service account [LOG_SINK_SERVICE_ACCOUNT] returned. It typically ends with @gcp-sa-logging.iam.gserviceaccount.com.
Set IAM policy for Pub/Sub topic
For the sink export to work, you need to grant the returned sink service account a Cloud IAM role so it has permission to publish logs to the Pub/Sub topic:
If you created the log sink using the Cloud Console, it will automatically grant the new service account permission to write to its export destinations, provided you own the destination. In this case, it’s Pub/Sub topic my-logs.
Set up the Splunk HEC endpoint
If you don’t already have an Splunk HEC endpoint, refer to the Splunk docs on how to configure Splunk HEC, whether it’s on your managed Splunk Cloud service or your own Splunk Enterprise instance. Take note of the newly created HEC token, which will be used below.
Note: For high availability and to scale with high-volume traffic, refer to Splunk docs on how to scale by distributing load to multiple HEC nodes fronted by an HTTP(S) load balancer.
Executing Pub/Sub to Splunk Dataflow template
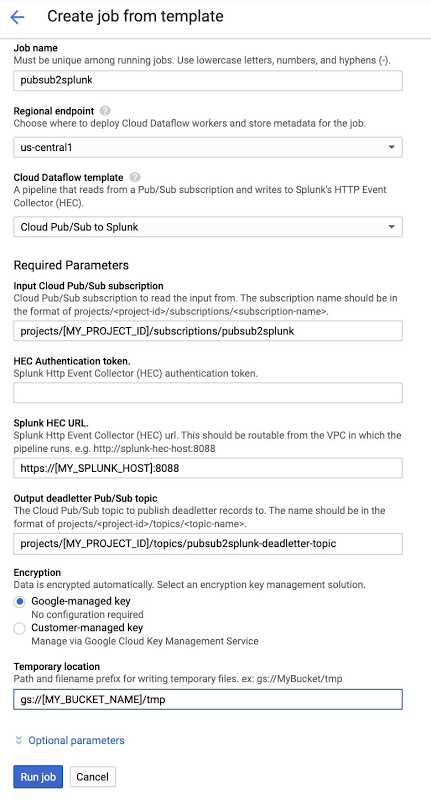
The Pub/Sub to Splunk pipeline can be executed from the UI, gcloud, or via a REST API call (more detail here). Below is an example form, populated in the Console after selecting “Cloud Pub/Sub to Splunk” template. Note the job name “pubsub2splunk” matches the name used in the log filter above, which excludes logs from this specific Dataflow job. Clicking on “Optional parameters” expands the form with more parameters to customize the pipeline, such as adding a user-defined function (UDF) to transform events (described in the next section), or configure the number of parallel requests or number of batched events per request. Refer to best practices below for more details on parameters related to scaling and sizing. Once parameters are set, click on “Run job” to deploy the continuous streaming pipeline.
Add a UDF function to transform events (optional)
As mentioned above, you can optionally specify a JavaScript UDF function to transform events before sending to Splunk. This is particularly helpful to enrich event data with additional fields, normalize or anonymize field values, or dynamically set event metadata like index, time, source, or sourcetype on an event basis.
Here’s a JavaScript UDF function example that sets an additional new field inputSubscription to track the originating Pub/Sub subscription (in our case pubsub2splunk) and sets the event’s source to the value of logName from incoming log entry, and event sourcetype to payload or resource type programmatically, depending on incoming log entry:
For other UDF function examples, see Extend your Dataflow template with UDFs which includes best practices on testing UDFs before deployment.
In order to use a UDF, you need to upload it to a Cloud Storage bucket and specify it in the template parameters before you click “Run job” in the previous step. Copy the above sample code into a new file called my-udf.js, then upload to a Cloud Storage bucket (replace [MY_BUCKET]) using this code:
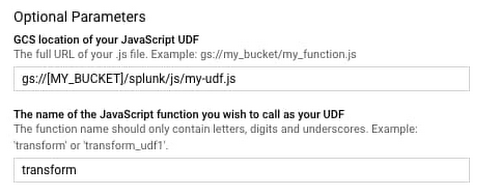
Go back to the template form in the Dataflow console, click and expand “Optional parameters,” and specify the two UDF parameters as follows:
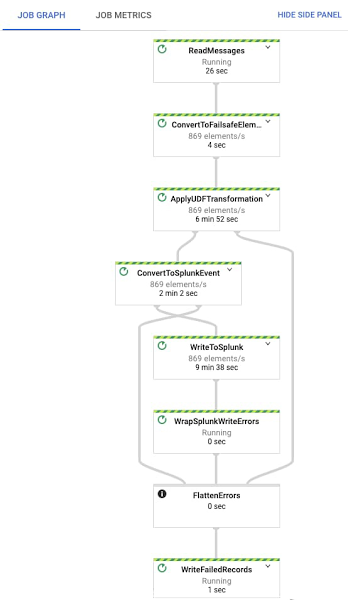
Once you click “Run job,” the pipeline starts streaming events to Splunk within minutes. You can visually check proper operation by clicking on the Dataflow job and selecting the “Job Graph” tab, which should look as below. In our test project, the Dataflow step WriteToSplunk is sending a little less than 1,000 elements/s to Splunk HEC, after applying the UDF function (via ApplyUDFTransformation step) and converting elements to Splunk HEC event format (via ConvertToSplunkEvent step). To make sure you are aware of any issues with the pipeline, we recommend setting up a Cloud Monitoring alert that will fire if the age of the oldest “unacknowledged”—or unprocessed—message in the input Pub/Sub subscription exceeds 10 minutes. An easy way to access graphs for this metric is in the Pub/Sub subscription details page in Pub/Sub’s Cloud Console UI.
View logs in Splunk
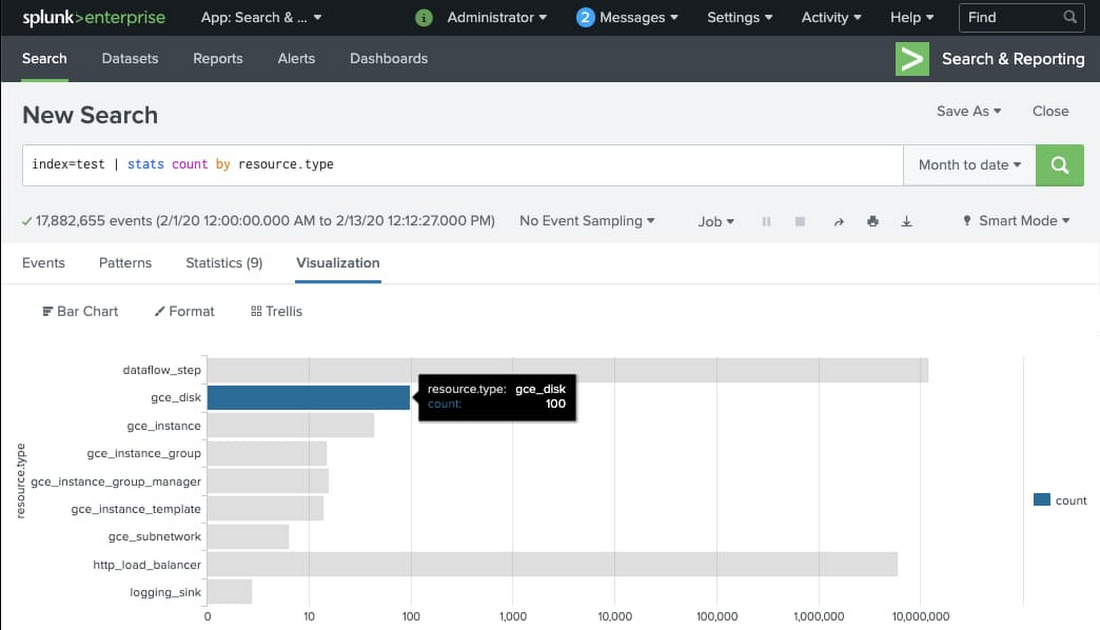
You can now search all Google Cloud logs and events from your Splunk Enterprise or Splunk Cloud search interface. Make sure to use the index you set when configuring your Splunk HEC token (we used index “test”). Here’s an example basic search to visualize the number of events per type of monitored resource:
Tips and tricks for using the Splunk Dataflow template
Populating Splunk event metadata
Splunk HEC allows event data to be enhanced with a number of metadata fields that can be used for filtering and visualizing the data in Splunk. As mentioned above, the Pub/Sub to Splunk Dataflow pipeline allows you to set these metadata fields using an optional UDF function written in JavaScript.
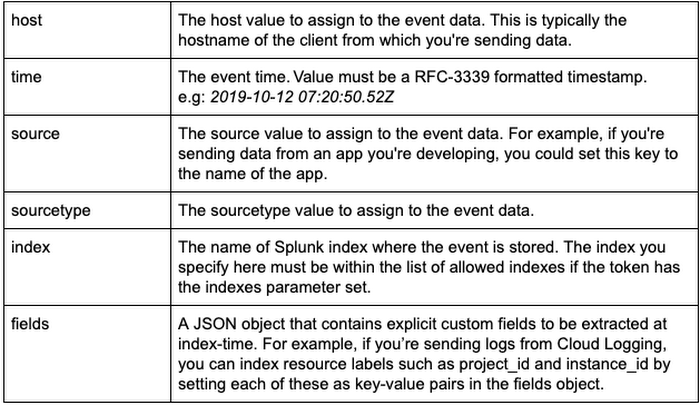
In order to enhance the event data with the additional metadata, the user-provided UDF can nest a JSON object tagged with the “_metadata” key in the event payload. This optional _metadata object is meant to pass along Splunk HEC metadata that will be automatically extracted and populated by the pipeline (see table below for supported fields and their formats):
The pipeline will also remove the “_metadata” field from the event data sent to Splunk. This is done to avoid duplication of data between the event payload and the event metadata.
The following metadata fields are supported for extraction at this time:
Note about event time: The pipeline will also attempt to extract time metadata from the event itself in case there is a field named “timestamp” in the data payload. This is done to automatically extract the time value from Cloud Logging’s standard LogEntry payload format. However, a time field present in the “_metadata” object will always override the value extracted from the data payload “timestamp” field.
SSL certificate validation
If the Splunk HEC endpoint is SSL-enabled (recommended!) but is using self-signed certificates, you may want to disable the certificate validation. The default setting is to validate the SSL certificate. This can be changed by setting disableCertificateValidation to true.
Batching writes to Splunk HEC
The Pub/Sub to Splunk pipeline lets you combine multiple events into a single request. This allows for increased throughput and reduces the number of write requests made to the Splunk HEC endpoint. The default setting for batch is 1 (no batching). This can be changed by specifying a batchCount value greater than 1.
Note about balancing throughput and latency: The cost of batching is a slight latency for individual messages, which are queued in memory before being forwarded to Splunk in batches. The pipeline attempts to enforce an upper limit (two seconds) to the amount of time an event remains in the pipeline before it gets pushed to Splunk. This is done to minimize that latency and avoid having events waiting in the pipeline for too long, in case the user provides a very high batchCount. For use cases that do not tolerate any added latency to individual events, batching should be turned off (default setting).
Increasing write parallelism
The Pub/Sub to Splunk pipeline allows you to increase the number of parallel requests that are made to Splunk HEC endpoint. The default setting is 1 (no parallelism). This can be changed by specifying a parallelism value greater than 1. Note that increased parallelism will lead to an increase in the number of requests sent to the Splunk HEC endpoint and might require scaling HEC downstream.
Autoscaling
In addition to setting parallelism, the Pub/Sub to Splunk pipeline is autoscaling enabled with a maximum of 5 workers (default). The user can override number of maximum workers via the UI or via the --max-workers flag when executing the pipeline via gcloud CLI.
Note about pipeline sizing: For latest guidance on pipeline capacity planning including determining rate-controlling parameters (parallelism and batchCount), refer to Deploying production-ready log exports to Splunk using Dataflow tutorial.
What’s next?
Refer to our solution guide and user docs for the latest reference material, and to get started with the Pub/Sub to Splunk Dataflow template. We’d like to hear your feedback and feature requests. You can create an issue directly in the corresponding GitHub repo, or create a support case directly from your Cloud Console, or ask questions in our Stack Overflow forum.
To get started with Splunk Enterprise on Google Cloud, check out the open-sourced Terraform scripts to deploy a cluster on Google Cloud within minutes. By default, the newly deployed Splunk Enterprise indexer cluster is distributed across multiple zones; it is pre-configured and ready to ingest data via both Splunk TCP and HEC inputs. The Terraform output returns an HEC token that you can readily use when creating your Dataflow job. Check out deploying Splunk Enterprise on GCP for general deployment guidelines.