How a green energy provider used Dataplex for its data governance and quality
João Caldas
Head for Analytics & Innovations, Casa Dos Ventos
Brazil is one of the world’s most promising renewables markets, in which Casa Dos Ventos is a leading pioneer and investor. With our innovation and investments we are leading the transition into a more competitive and sustainable future.
At Casa Dos Ventos, we lean into ‘big data’ to support critical decisions for our business. Most of our data is stored in BigQuery, a serverless enterprise data warehouse. We constantly use innovative tools and services from Google Cloud to speed up our business more efficiently, promoting decarbonization at scale in real-life.
For example, in wind farm operations, the data is used to quantify energy production, losses and efficiency. For meteorological masts (also known as metmasts), the sensor data and configurations are constantly ingested and analyzed for their health. In newer and green field projects, we use data to make decisions on our investments.
We need trusted data to make these decisions to avoid going wrong with our goals around uptime, efficiency, and investment returns! However, controlling data quality has been a challenge for us, frequently leading us to data firefighting.
Previously, we built homegrown solutions that could have worked for us better — like setting rules and alerts in BI tools,or writing custom Python scripts. These approaches were hard to scale, standardize, and often costly.
To solve these problems, we turned to Dataplex, an intelligent data fabric that unifies distributed data, to achieve better data governance in our organization and build trust in the data. With Dataplex, we now have a very streamlined way of organizing our data, securing, and monitoring data for data quality.
We started Dataplex implementation with three key goals:
Define a data governance framework for the organization.
Create reports that routinely measure adherence to the framework.
Create reports that routinely measure the quality of the data.
Let’s take a tour of how we do that today.
Define a data governance framework for the organization
We started by organizing the data in alignment with the business and then using Dataplex to set policies for this organization.
Dataplex abstracts away the underlying data storage systems by using the constructs like lake, data zone, and assets. We decided to map these constructs to our business with the following framework:
Lake - One lake per department in the company
Data Zone - Separate data in subareas using the zone
For example:
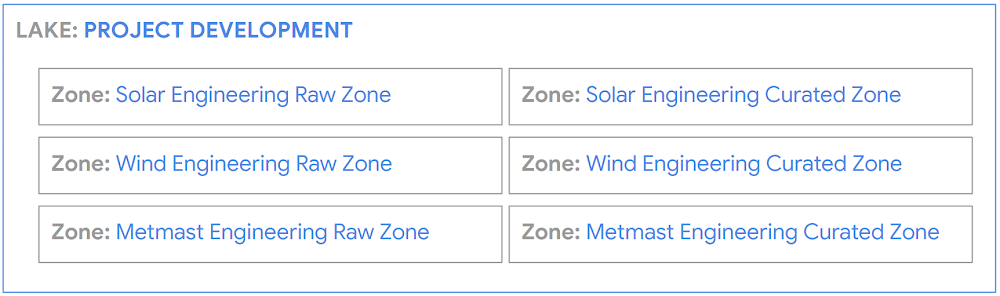
This allowed us to set data permissions at a Lake or a Zone level. Dataplex then propagates permissions to the Assets in a zone continuously.
Create reports for data assets and govern data assets
To monitor our data's governance stature, we have two reports that capture the current state.
The first report tracks the entire data estate. We used BigQuery APIs and developed Python scripts (scheduled by Composer) to extract the metadata of all BigQuery tables in the organization. It also measures critical aspects like # of documented tables and views.

Secondly, we also track our progress in continuously bringing our data estate into Dataplex governance. We followed the same process (API + Python code) to build the following dashboard. Currently, the datasets under Dataplex stand at 71.6% per this dashboard. Our goal is to get to 100% and then maintain that.
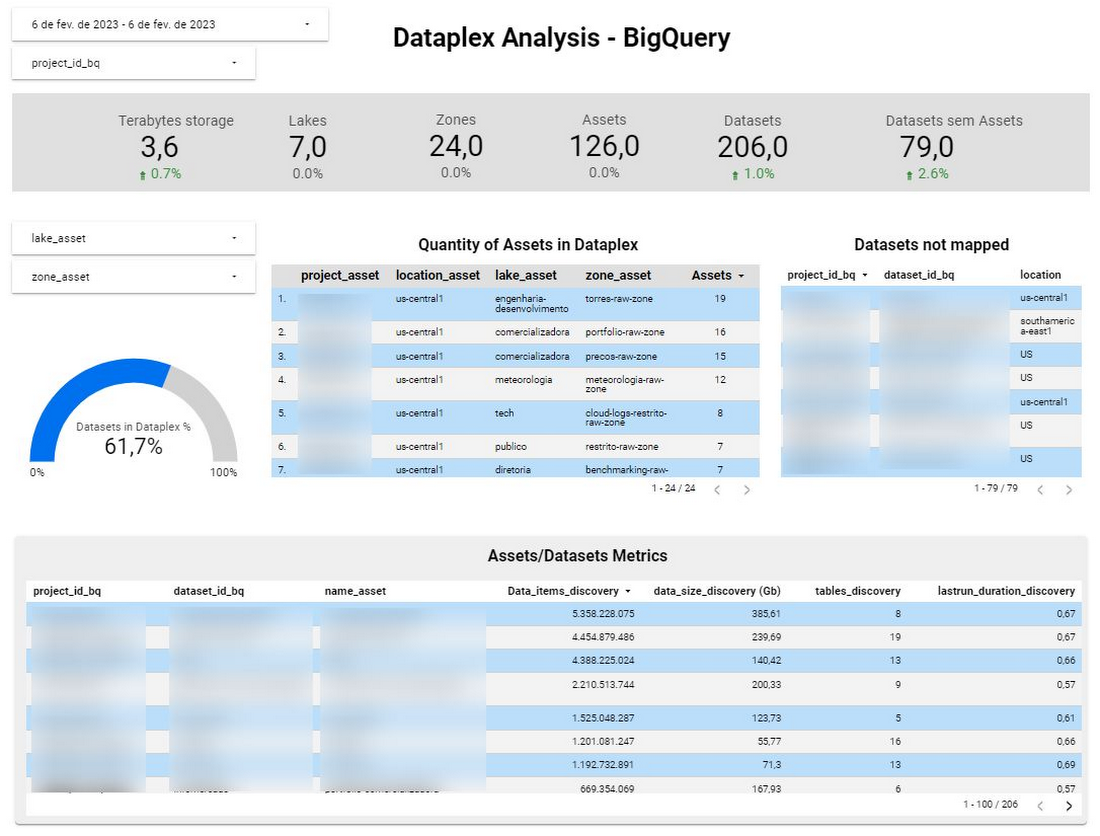
Dashboard Dataplex Analysis
Create data quality scans and reports
Once data is under management in Dataplex, we build data quality reports and a dashboard in Dataplex with a few simple clicks.
Multiple data quality scans run within Dataplex, one for each critical table.

To create rules we used the built-in rules but also created our own using custom SQL statements. For example, to make sure we do not ever have any rows that match a particular condition, we created a SQL rule that returns FALSE when we have even a single row matching the condition.
E.g., SQL rules
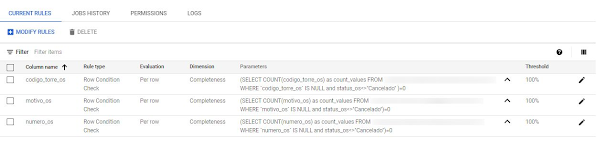
When these checks fail, we rely on the query shown by Dataplex AutoDQ to find the rows that failed.
To build a dashboard for data quality, we use the logs in Cloud Logging and set up a sink to BigQuery. Once the data lands in BigQuery, we create a view with following query:
Creating this view enables separating data quality scan results by lake and zones.
We then use Tableau to:
Create a dashboard and
Send notifications by email for responsible users using alerts in Tableau
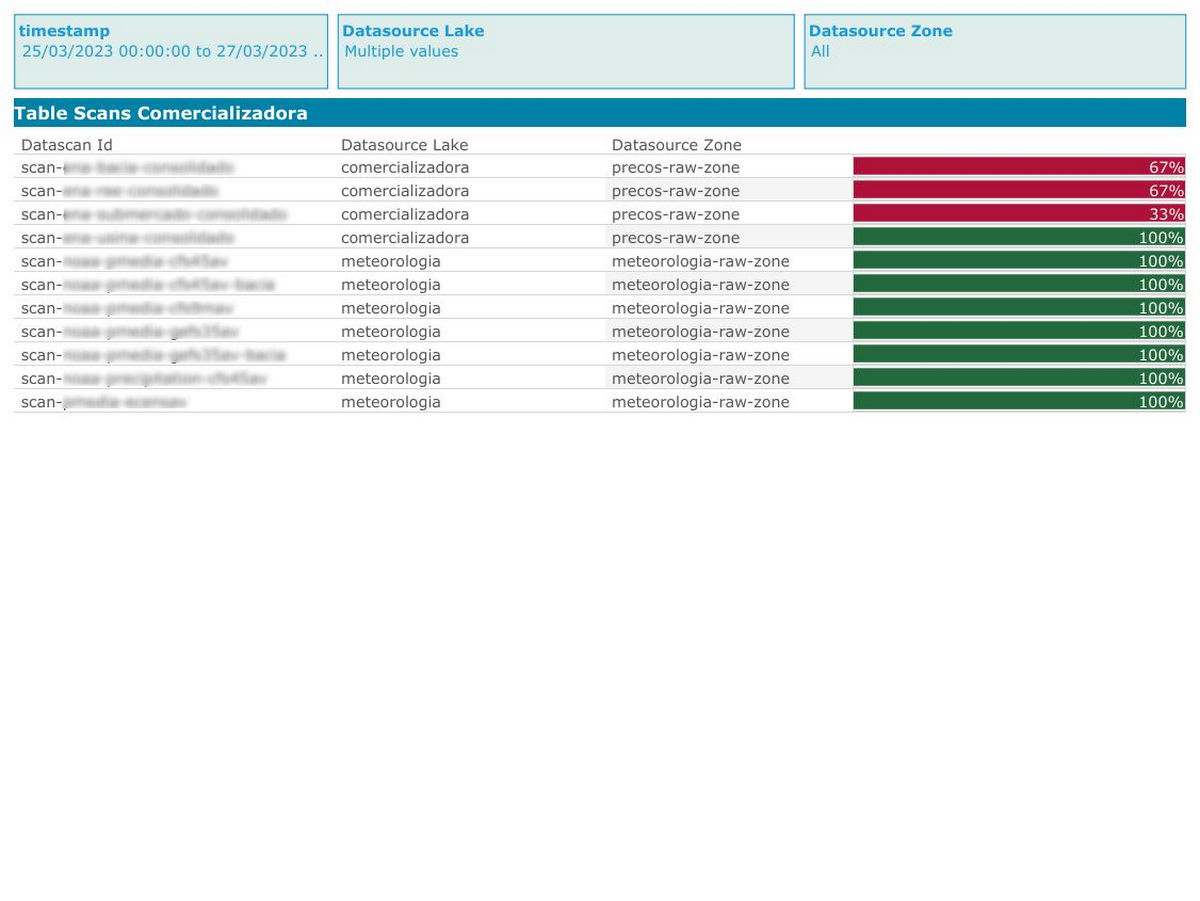
Here is our Tableau dashboard:
Looking ahead
While we have achieved a much better governance posture, we also look forward to expanding our usage of Dataplex further. We are starting to use the Lineage feature for BigQuery tables and learning how to integrate Data Quality with Lineage. This will enable us to check the dashboard and views impacted by data quality issues easily. We are also planning to manage SQL scripts in our Github account.
To get access to the scripts we referred to in this blog , visit: https://github.com/Casa-dos-Ventos/project_data_governance_casa_dos_ventos_google