5 GKE features to help you optimize your clusters
Anthony Bushong
Developer Relations Engineer
Try Google Cloud
Start building on Google Cloud with $300 in free credits and 20+ always free products.
Free trialIn this post, we'll be discussing 5 features in GKE you can use to optimize your clusters today. To get started with testing these in GKE, check out our interactive tutorials for getting started with standard and autopilot clusters.
If you find value from running workloads on Kubernetes clusters in your organization, chances are your footprint will grow - be it through larger clusters or more clusters.
Whichever your approach, one thing is certain: you'll have more resources that you pay for. And you know what they say - more resources, more problems. The more resources you have across clusters, the more critical it becomes to make sure you're using them efficiently.
Google Kubernetes Engine has numerous features built-in that you as a cluster admin can use to navigate this continuous journey of optimizing your use of resources in GKE.
Let's review five of them you can get started with today.
#1 - Cluster view cost optimization in the console
If you don't know where to start with optimizing your clusters, the best place to start is looking for a big problem that stands out. That's probably most visible by looking at a view that spans all of your clusters.
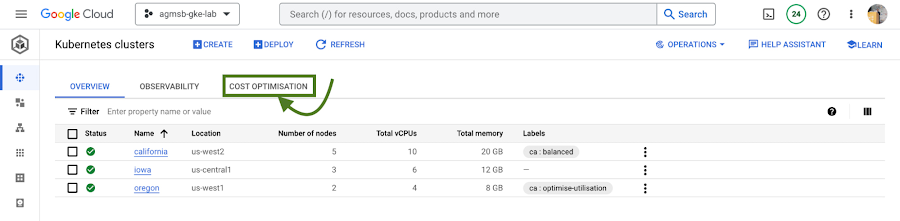
In GKE, we have a cluster-level cost optimization tab built into the console, rich with information that may be cumbersome to gather on your own otherwise.
You can find this as seen in the following image:
Once you navigate to this tab, you're greeted with a time series visualization.
For GKE standard clusters, this visualization is a time series representation that shows three key dimensions for CPU and Memory across all of your clusters in a project:
Total CPU/Memory allocatable- # of CPU or GB of memory that can be allocated to user workloadsTotal CPU/Memory request- # of CPU or GB of memory that has been requested by user workloadsTotal CPU/Memory usage- actual usage by # of CPU or GB of memory by user workloads
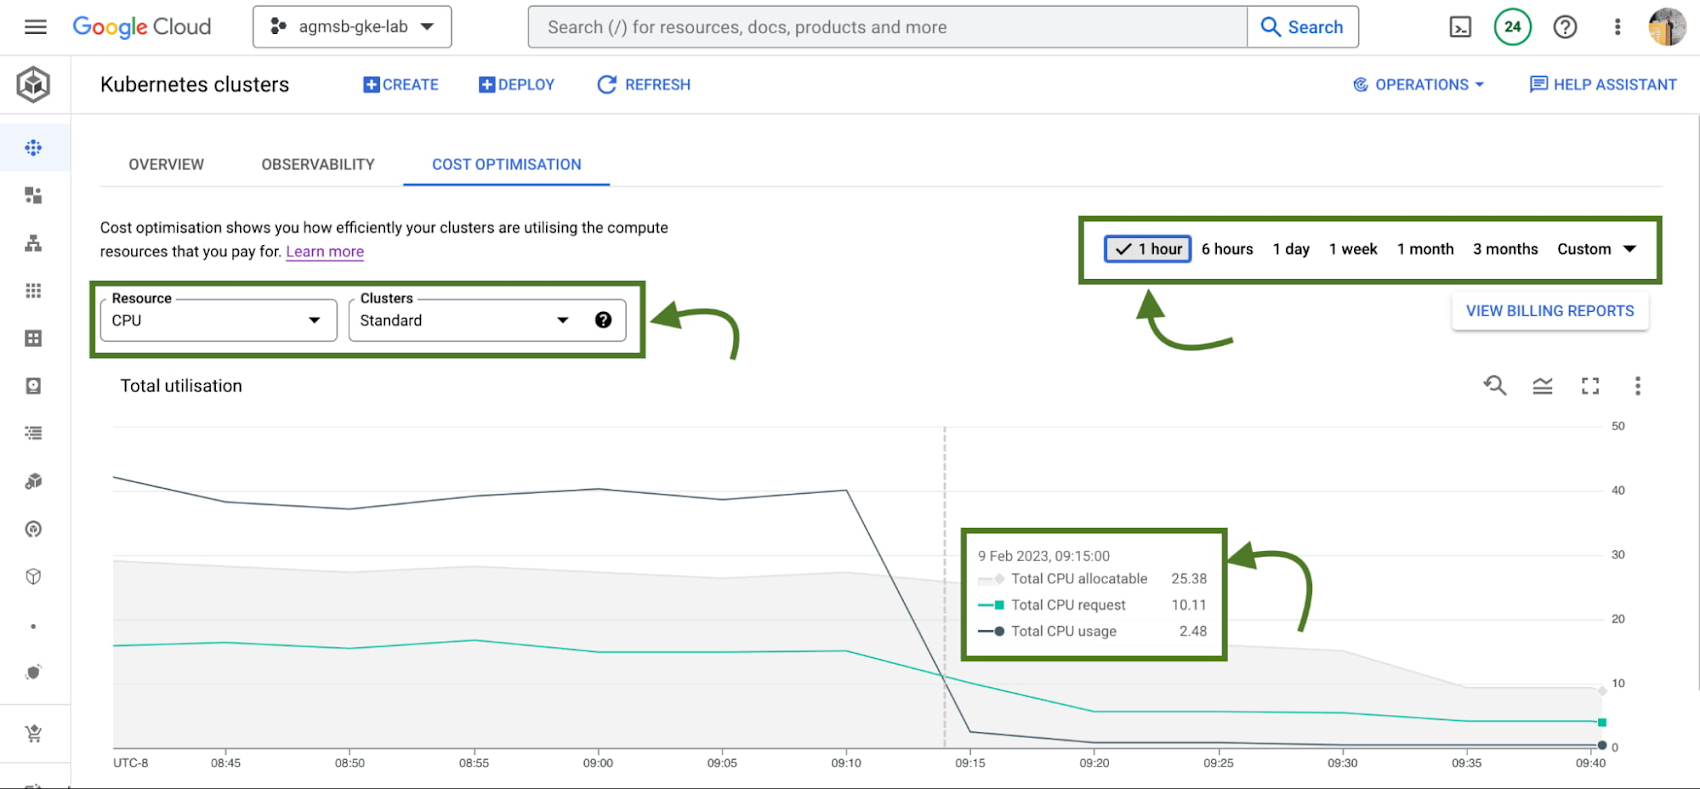
Analyzing these in relationship to one another can help identify answers to important optimization questions such as:
Do we have too much allocatable CPU and memory idle across our GKE standard clusters? If so, can we do things like re-evaluate the machine types we use in node pools? This can help us bin pack the cluster, by having a higher percentage of allocatable resources allocated to Pod requests.
Are workloads running in our GKE standard clusters requesting too much CPU and memory that goes unused? If so, can we do things like work with workload owners to adjust requests? This can help us workload right-size, by setting requests to more closely reflect expected usage.
If we're using GKE Autopilot, this time series visualization will look slightly different, as seen in the following image:
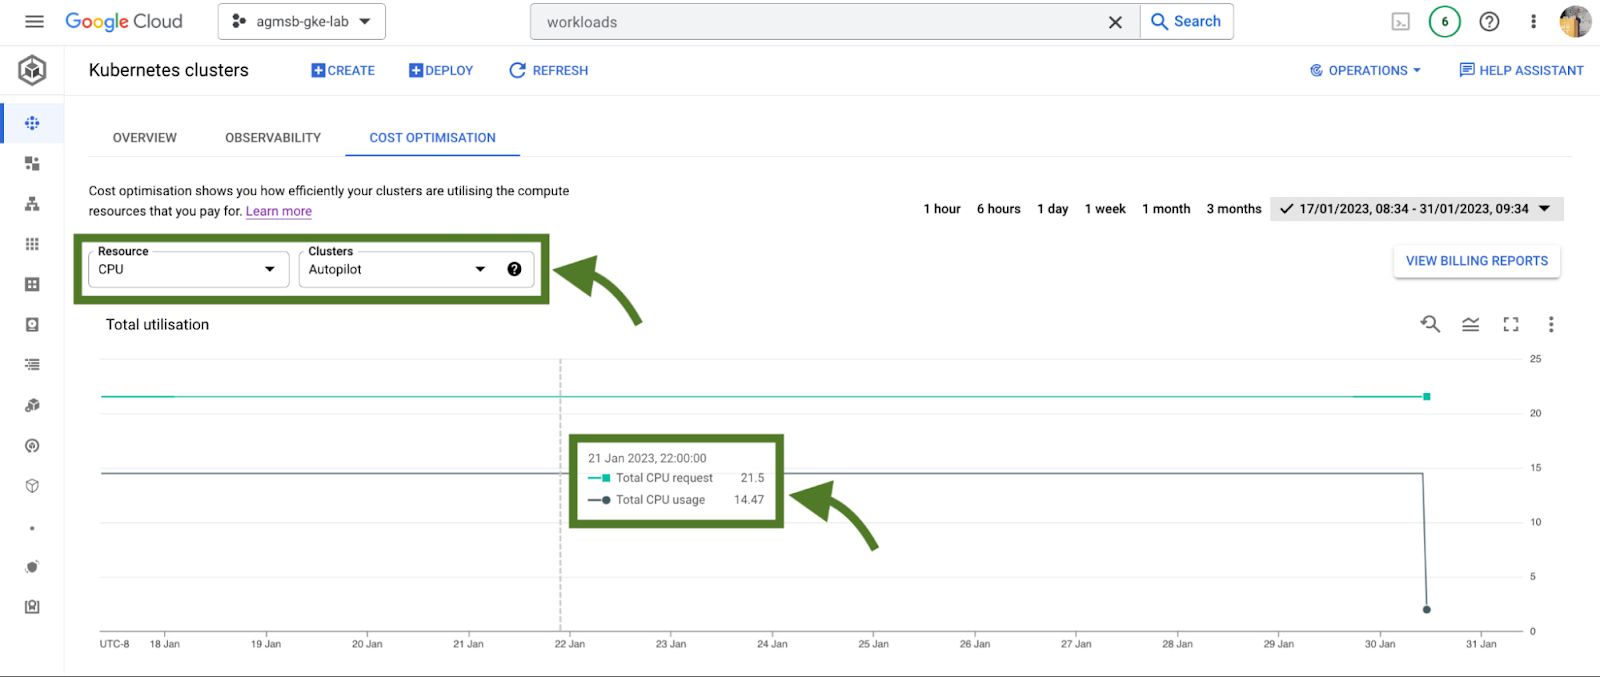
In the case of GKE Autopilot clusters, we're only able to view the Total CPU/Memory request and the Total CPU/Memory usage data. But nothing here is actually missing!
In Autopilot clusters, you only pay per Pod based on its requests; Autopilot automatically handles provisioning the infrastructure that gives us our allocatable resources based on whatever you set Pod requests to. When we trade in that ownership of node provisioning, we also trade in the control to optimize at that layer.
For a cluster administrator, this information can be a spark to spur actions such as diving into individual clusters or meeting with workload teams to work through their requests and limits that they set for workloads. In our research, this is perhaps the most impactful area many teams optimize. We'll dive into how GKE can enable this exercise a bit further in this blog.
When going down those paths, it helps to have financial data to quantify the impact of the optimization to the business. Gathering this info on your own can require a bit of work (for some, a lot of spreadsheets as well!), but luckily GKE has another native feature to help make this easily accessible to you.
#2 - GKE cost allocation
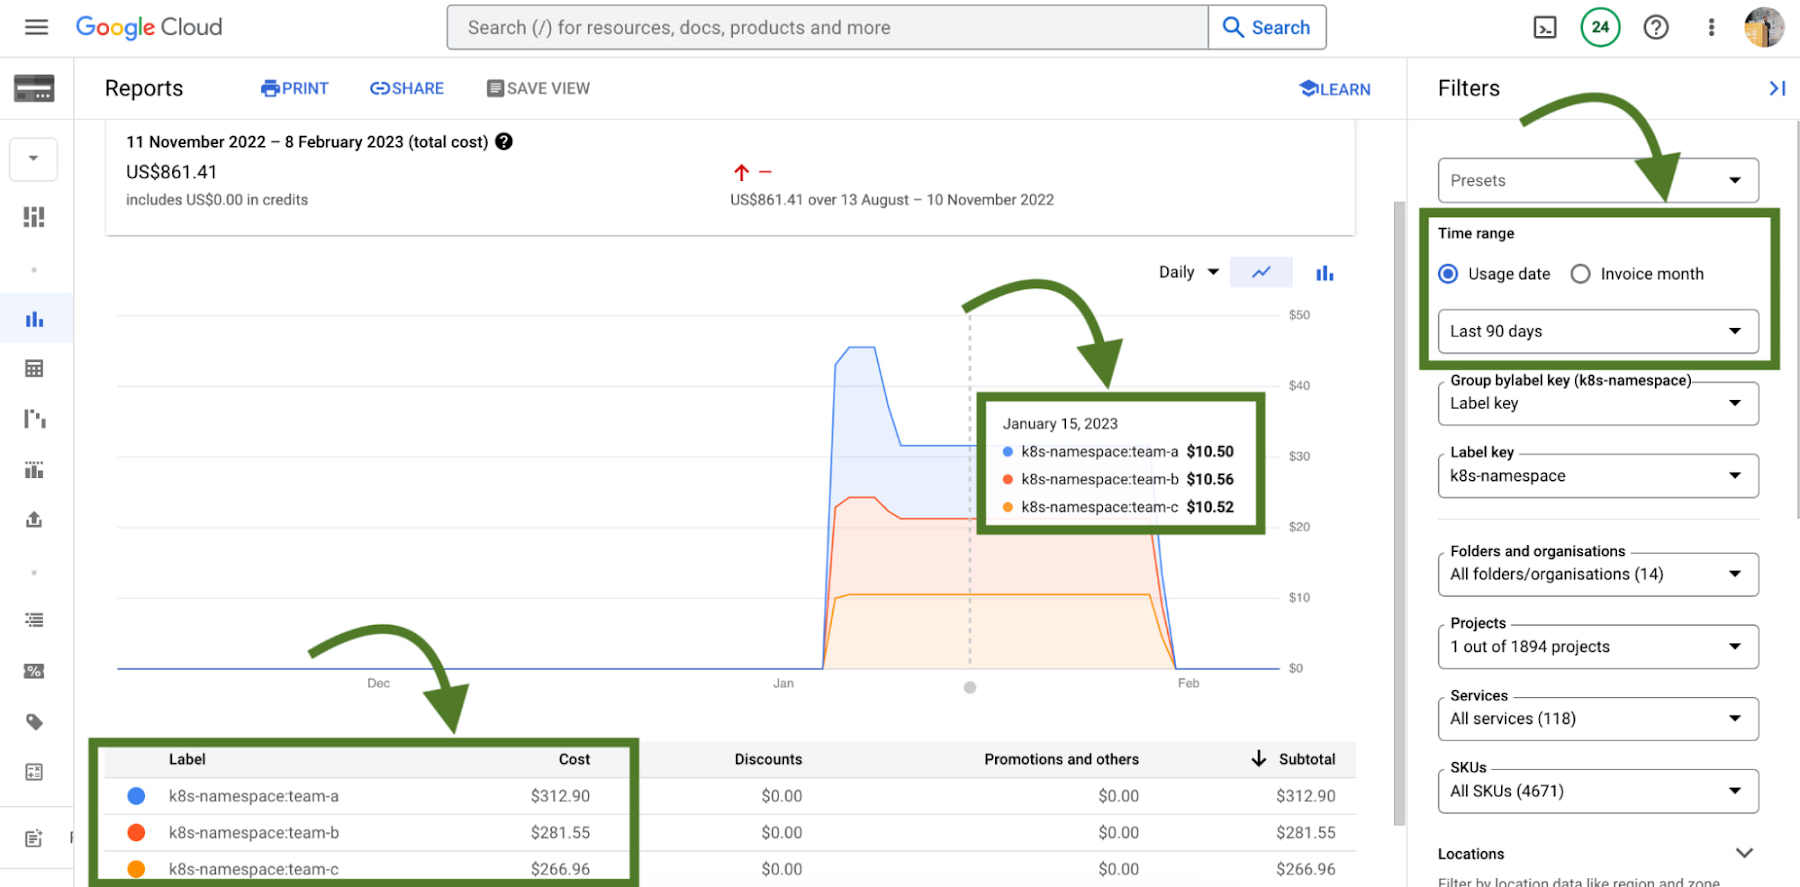
GKE cost allocation is a native GKE feature that integrates workload usage with Cloud Billing and its reports, allowing you to see and alert on billing not only on a per-cluster level, but on a per-Kubernetes namespace or per-Kubernetes label level.
It must be enabled on your cluster in order for it to function, so if you're working with an existing GKE cluster and want to enable it, use the following gcloud command once you have set your appropriate zone or region:
Without GKE cost allocation, the financial impact of a cluster and all of the different workloads it might run were a bit obfuscated. With the cluster as the deepest level of detail in billing, finding areas to optimize or even performing showback and chargeback was a challenge.
With Namespaces and Labels bubbling up into billing reports, you can now understand the cost of the CPU/Memory requests that workloads define in Kubernetes. A caveat - this works best when you are using Namespaces and Labels to logically define and organize teams and their workloads.
This integration also gives the bigger picture of optimization - in that GKE does not typically live on an island! In theory, workloads in a team's namespace could be using external backing services like Cloud Memorystore that are also a key part of its usage.
Because Cloud Billing data has all GCP services, we can now filter and query across namespaces and their corresponding backing services.
# 3 - Workload view cost optimization in the console
Once you have teams identified that you may want to work with, GKE provides a cost optimization tab at the workload level, where you can then begin to drill down and identify specific workloads that could be optimized through an exercise called "workload right-sizing". This is the act of making sure that Pod requests more closely reflect their expected usage.
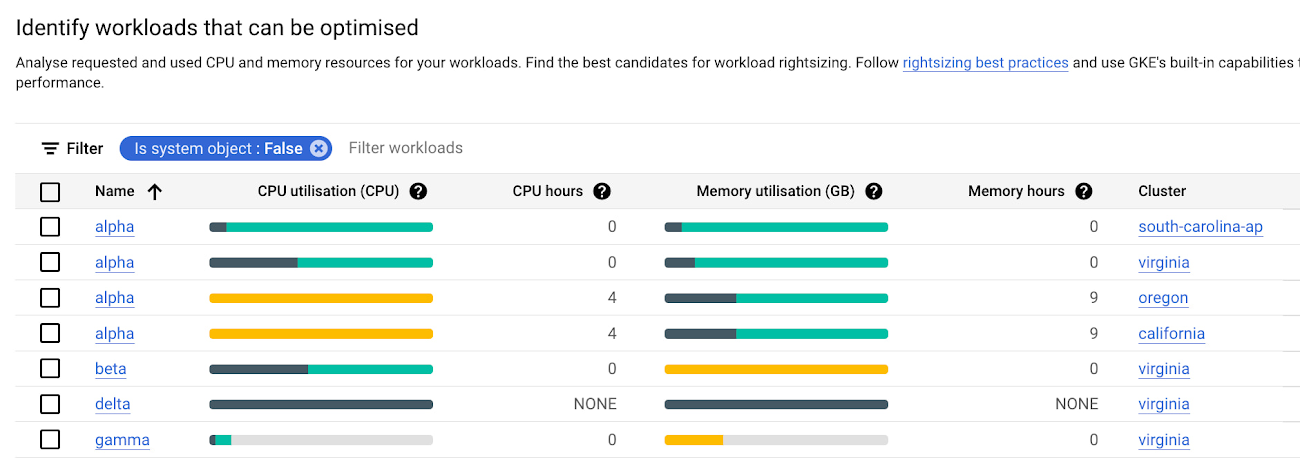
As you can see here, we're given bar charts to represent the relationship of usage, requests, and limits to one another.
Dark green: CPU/Memory usage
Light green: CPU/Memory requests
Grey: CPU/Memory Limits
Yellow: Scenarios in which CPU/Memory usage exceeds requests
You can also hover over each individual workload bar chart to reveal a small on-screen report of this data. Similar to the cluster view cost optimization tab, you can filter down to a custom time window; we recommend viewing this data in a window greater than an hour (IE a day, week, month) to potentially uncover diurnal or weekly patterns that would otherwise be obfuscated.
In the preceding screenshot of these charts, we can call out a few patterns that might stand out to you:
If we have too much light green stacked above dark green in a bar, we may have workloads that are over provisioned.
If we have a yellow bar, we have a workload where requests are not set high enough, which can be a stability/reliability risk - consuming additional resources on its node and potentially being throttled or OOMKilled if it hits its limits.
If we have a bar that is all dark green, this means that we don't have requests set for a workload - which is not best practice! Set those requests.
With this information, it becomes easier to quickly identify workloads that need requests and limits tuned for either cost optimization or stability and reliability.
# 4 - Recommendations for adjusting workload requests
In scenarios where we need to increase or reduce CPU/Memory requests, it is easier to know that it needs to be done than to know how it needs to be done. What should we set the requests to?
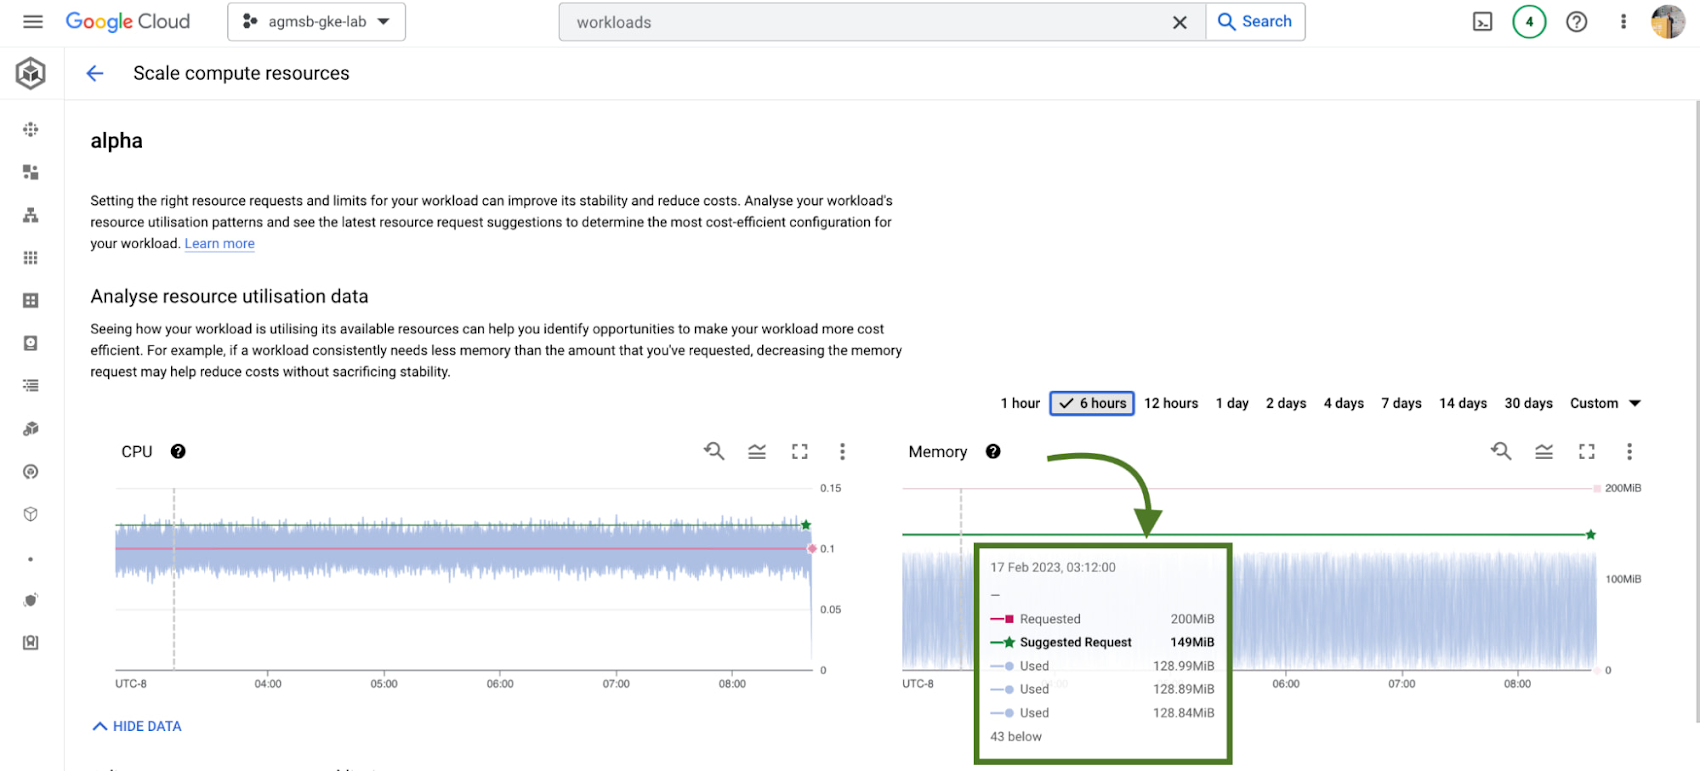
GKE integrates recommendations from the Kubernetes Vertical Pod Autoscaler (VPA) directly into its workload console, currently for all deployments in your clusters. You can find this by navigating to the Actions > Scale > Scale compute resources menu when viewing the page for a specific workload.
It's important to remember that these recommendations are just that - recommendations. They're based on historical usage data, so when viewing these values, it's important to work with workload owners to see if these suggestions make sense to incorporate into their respective Kubernetes manifests.
# 5 - Cost estimation and cluster creation setup guides
Finally, if you're just getting started with GKE and you want to get started on the right, optimized foot, we have tooling incorporated into the GKE cluster creation page.
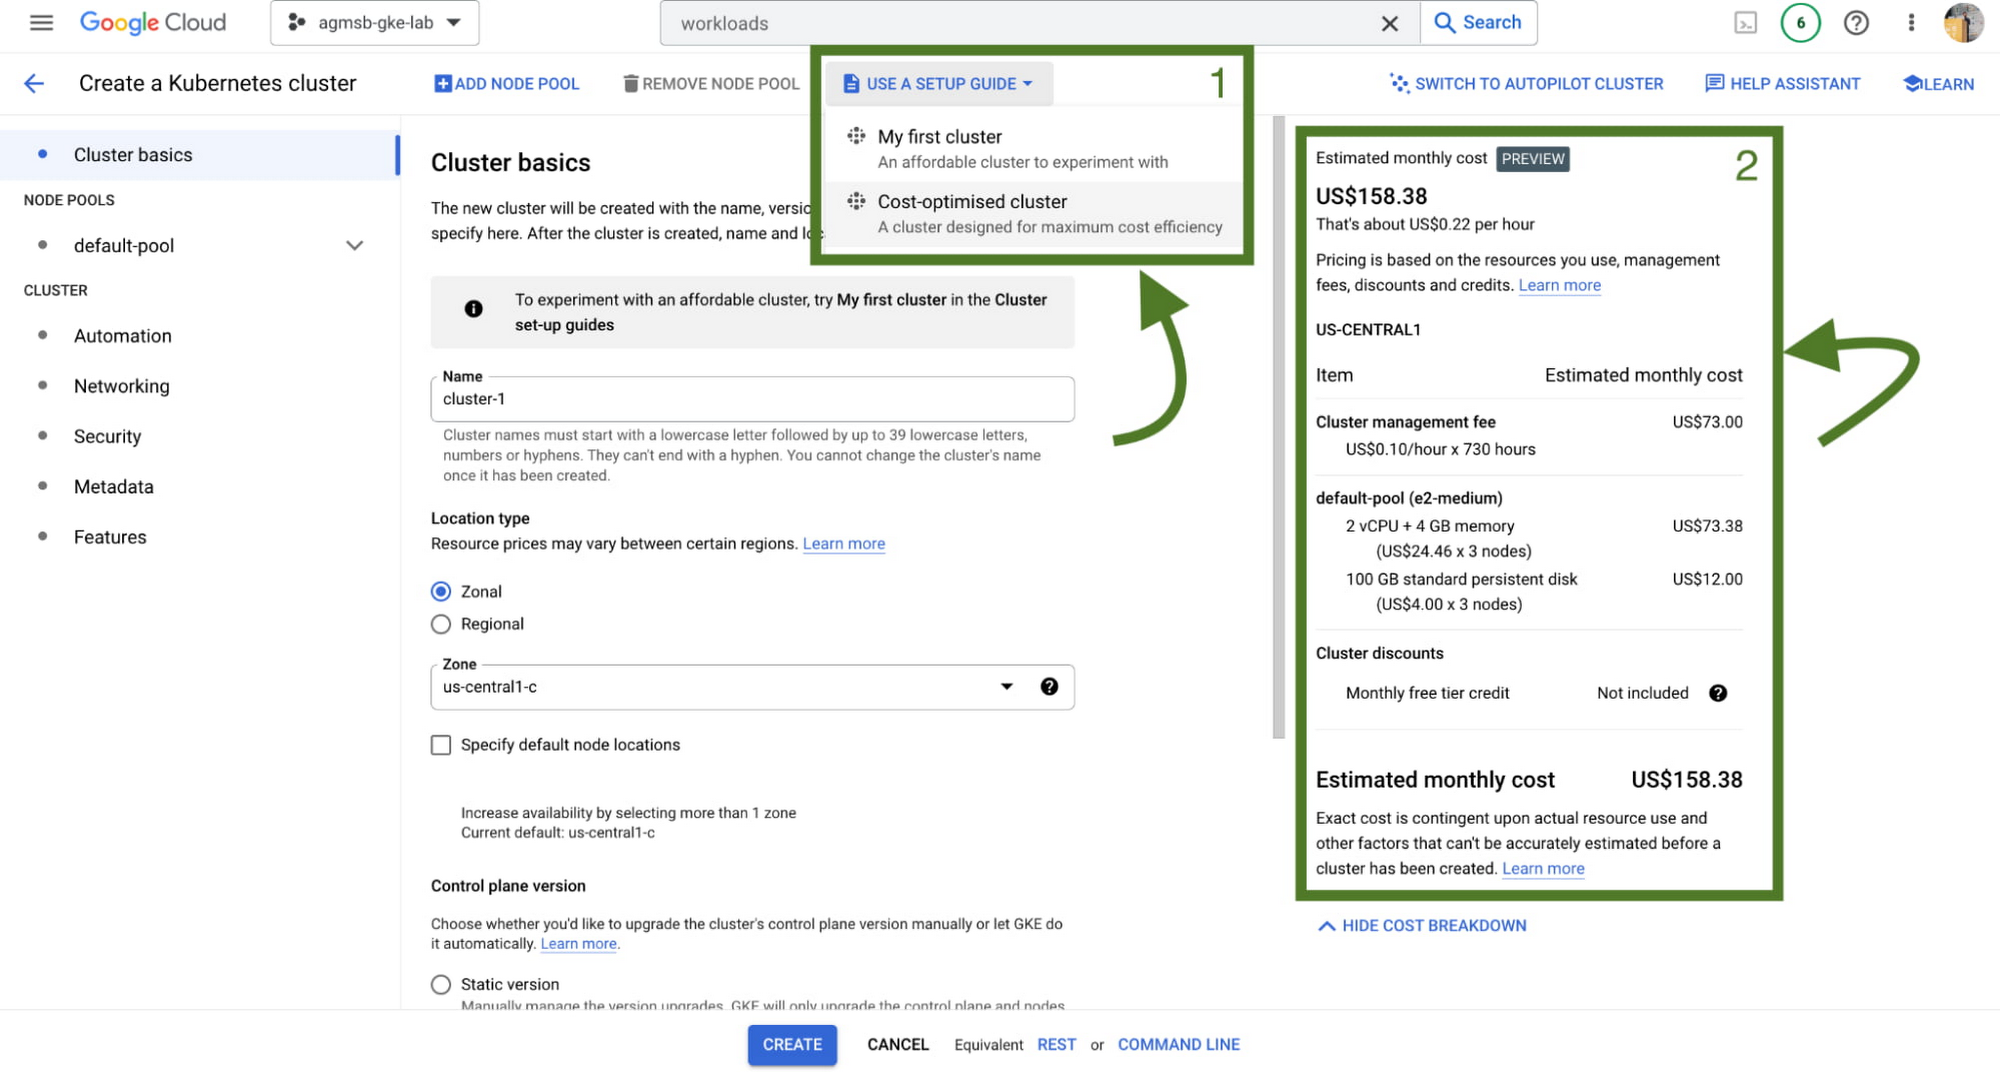
First, we have a setup guide that will help you create an opinionated GKE standard cluster with some things we discussed here already enabled, such as GKE cost allocation and Vertical Pod Autoscaler.
Second, we also have a cost estimation panel that, depending on the configuration of your GKE standard cluster, will show you an estimated monthly cost. This even helps you get a range of potential costs if you expect your cluster to scale up and down!
Now what?
Optimization across a set of GKE clusters can include a handful of areas to think about - and isn't a one time task! Instead, it's a continuous journey that cluster administrators, workload owners, and even billing managers all take part in. GKE provides the tooling to make this journey and process easier, with the right data and insights at your fingertips.
To familiarize yourself with these features in GKE, check out our interactive tutorials for getting started with standard and autopilot clusters.
You can also watch a demo showing most of these features in the following video:

A special thanks to Laurie White, Fernando Rubbo, and Bobby Allen for their review on this blog post.