How Google Cloud BigQuery enables big DevOps at JFrog
Mitali Bisht
Software Engineer, JFrog
Editor’s note: Today we’re hearing from Mitali Bisht, Software Engineer at JFrog on how BigQuery and Data Studio powers operational analytics on the JFrog DevOps Platform.
At JFrog, we know that keeping DevOps running smoothly requires knowing as much as you can about those operations. It’s a key principle of Artifactory, our artifact repository manager that powers the JFrog DevOps Platform. Information - in Artifactory’s case, artifact and build metadata - provides traceable paths through the complex systems we build every day. Data and the power to analyze it enables smart decisions by people and machines.
So to better serve our JFrog Cloud customers running their SaaS subscriptions on Google Cloud Platform (GCP), we needed to be able to collect and analyze operational data on hundreds of their deployments.
We wanted to gather statistics to serve metadata to users to make better decisions such as:
Who is actively using their JFrog accounts, by IP address?
Is there activity that suggests an attempted cyberattack?
Which modules or packages people use the most?
How efficiently are those resources being used?
On a single-user scale, we’ve provided some facilities for our self-hosted customers through our JFrog Platform Log Analytics integrations, to configure for themselves and view their high-availability deployment’s activity through analytics programs like Splunk and DataDog.
To monitor our SaaS operations on GCP, however, we needed to craft a solution that could extract and analyze this kind of data from multiple deployments on a much more massive scale.
Among the many GCP services available, we were able to make particular use of Cloud Logging, BigQuery, and Data Studio to collect, analyze, and visualize such vast quantities of operations data in real time.
Let’s dive into the architecture we used for this project at JFrog.
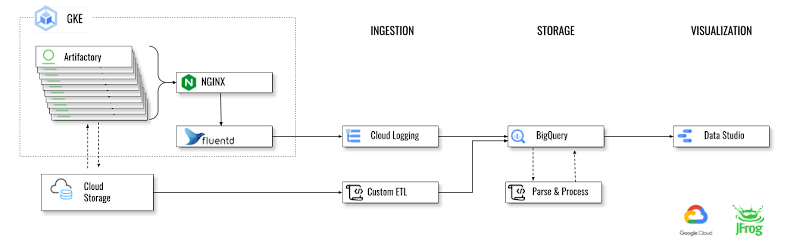
Stage 1: Ingesting Data from Logs
We had two sources of logs to ingest data from:
The nginx server serving our Artifactory SaaS instances
Logs streamed in from external cloud storage
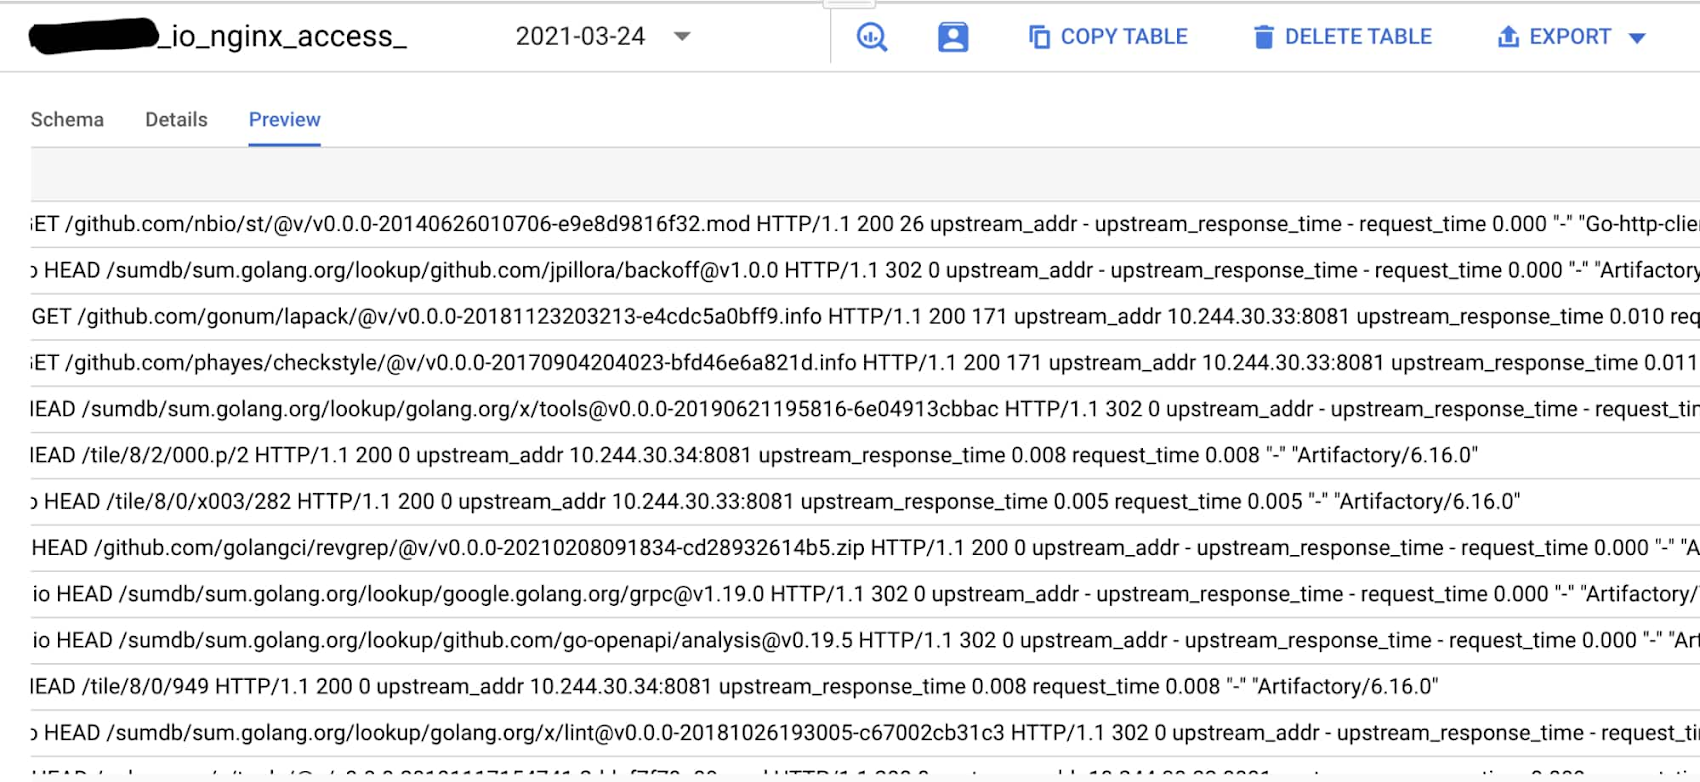
NGINX Access Logs
For the first, we already had the google-fluentd logging agent pod setup by default while setting up our Kubernetes cluster on GKE. The logging agent google-fluentd is a modified version of the fluentd log data collector. In its default configuration, the logging agent streams logs, as included in the list of default logs, to Cloud Logging. This default setup for nginx-access was sufficient; there was no need to customize the agent configuration to stream any additional logs.
In Cloud Logging, all logs, including audit logs, platform logs, and user logs, are sent to the Cloud Logging API where they pass through the Logs Router. The Logs Router checks each log entry against existing rules to determine which log entries to discard, which log entries to ingest (store) in Cloud Logging, and which log entries to route to supported destinations using log sinks. Here we created the log sinks to export the logs into the BigQuery partitioned table. The object `Sink` holds the inclusion/exclusion filter and destination. You can create/view sinks under the Logging-->Logs router section of your GCP project. For example, our inclusion filter reads:
External Cloud Storage Logs
In our external cloud storage, logs for multiple projects accumulate in the same bucket. To select only the logs related to our project, we created a custom Python script and scheduled it to run daily to perform these tasks:
Authenticate, read and select the data related to our project.
Process the data.
We used the BigQuery stream ingestion API to stream our log data directly into BigQuery. There is also BigQuery Data Transfer Service (DTS) which is a fully managed service to ingest data from Google SaaS apps such as Google Ads, external cloud storage providers such as Amazon S3 and transferring data from data warehouse technologies such as Teradata and Amazon Redshift. DTS automates data movement into BigQuery on a scheduled and managed basis.
Stage 2: Storage in BigQuery
BigQuery organizes data tables into units called datasets. These datasets are scoped to a GCP project. These multiple scopes — project, dataset, and table — help structure information logically. In order to refer to a table from the command line, in SQL queries, or in code, we refer to it by using the following construct: `project.dataset.table`.
BigQuery leverages the columnar storage format and compression algorithm to store data in Colossus, optimized for reading large amounts of structured data. Colossus also handles replication, recovery (when disks crash) and distributed management (so there is no single point of failure). Colossus enables BigQuery users to scale to dozens of petabytes of data stored seamlessly, without paying the penalty of attaching much more expensive compute resources as in traditional data warehouses.
Keeping data in BigQuery is a best practice if you’re looking to optimize both cost and performance. Another best practice is using BigQuery’s table partitioning and clustering features to structure the data to match common data access patterns.
When a table is clustered in BigQuery, the table data is automatically organized based on the contents of one or more columns in the table’s schema. The columns you specify are used to collocate related data. When new data is added to a table or a specific partition, BigQuery performs automatic re-clustering in the background to restore the sort property of the table or partition. Automatic reclustering is completely free and autonomous for users.
A partitioned table is a special table that is divided into segments, called partitions, that make it easier to manage and query your data. You can typically split large tables into many smaller partitions using data ingestion time or TIMESTAMP/DATE column or an INTEGER column. BigQuery supports the following ways of creating partitioned tables :
Ingestion time partitioned tables
DATE/TIMESTAMP column partitioned tables
INTEGER range partitioned tables
We used ingestion time partitioned BigQuery tables as our data storage. Ingestion time partitioned tables are:
Partitioned on the data’s ingestion time or arrival time.
BigQuery automatically loads data into daily, date based partitions reflecting the data’s ingestion or arrival time.
Partition management is key to fully maximizing BigQuery performance and cost when querying over a specific range — it results in scanning less data per query, and pruning is determined before query start time. While partitioning reduces cost and improves performance, it also prevents cost explosion due to users accidentally querying really large tables in entirety.
Stage 3: Parse and Process Data
Before we can analyze the raw log data we’ve stored in BigQuery, we need to process it so that it can be more easily queried.
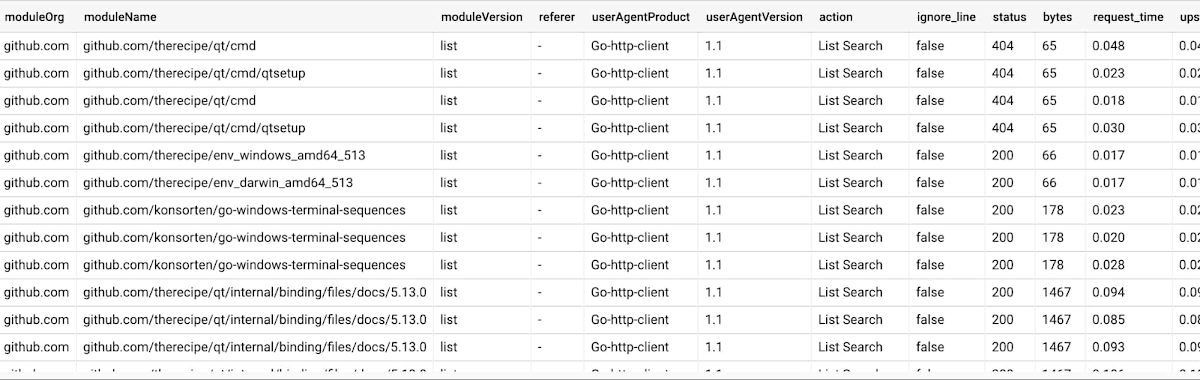
Parsing the Data
We used a Python script to massage the raw log data. Our script reads the raw logs we stored in BigQuery partitioned tables, parses them to break down the data, and then stores those refined results in a new BigQuery partitioned table store with more defined columns.
We also integrated with MaxMind IP geolocation services to perform IP reverse lookup, and better visualize usage by organization. There are client libraries available for most of the popular languages in order to make API calls to BigQuery.
Our Python script runs daily to process the ingested data and return it to BigQuery:
Analyzing the Data
BigQuery is highly efficient running multiple concurrent complex queries in very large datasets. The BigQuery compute engine is Dremel, a large multi-tenant cluster that executes SQL queries. Dremel dynamically apportions slots to queries on an as-needed basis, maintaining fairness for concurrent queries from multiple users. A single user can get thousands of slots to run their queries. In between storage and compute is ‘shuffle’, which takes advantage of Google’s Jupiter network to move data extremely rapidly from one place to another.
When we run queries in BigQuery, the result sets can be materialized to create new tables rather than storing in temp tables. In this way, we can join data from multiple tables and store in new ones with just one click and hand it over to anybody who does not have access to all those datasets tables by exporting it to GCS or exploring with Google Sheets or Data Studio.
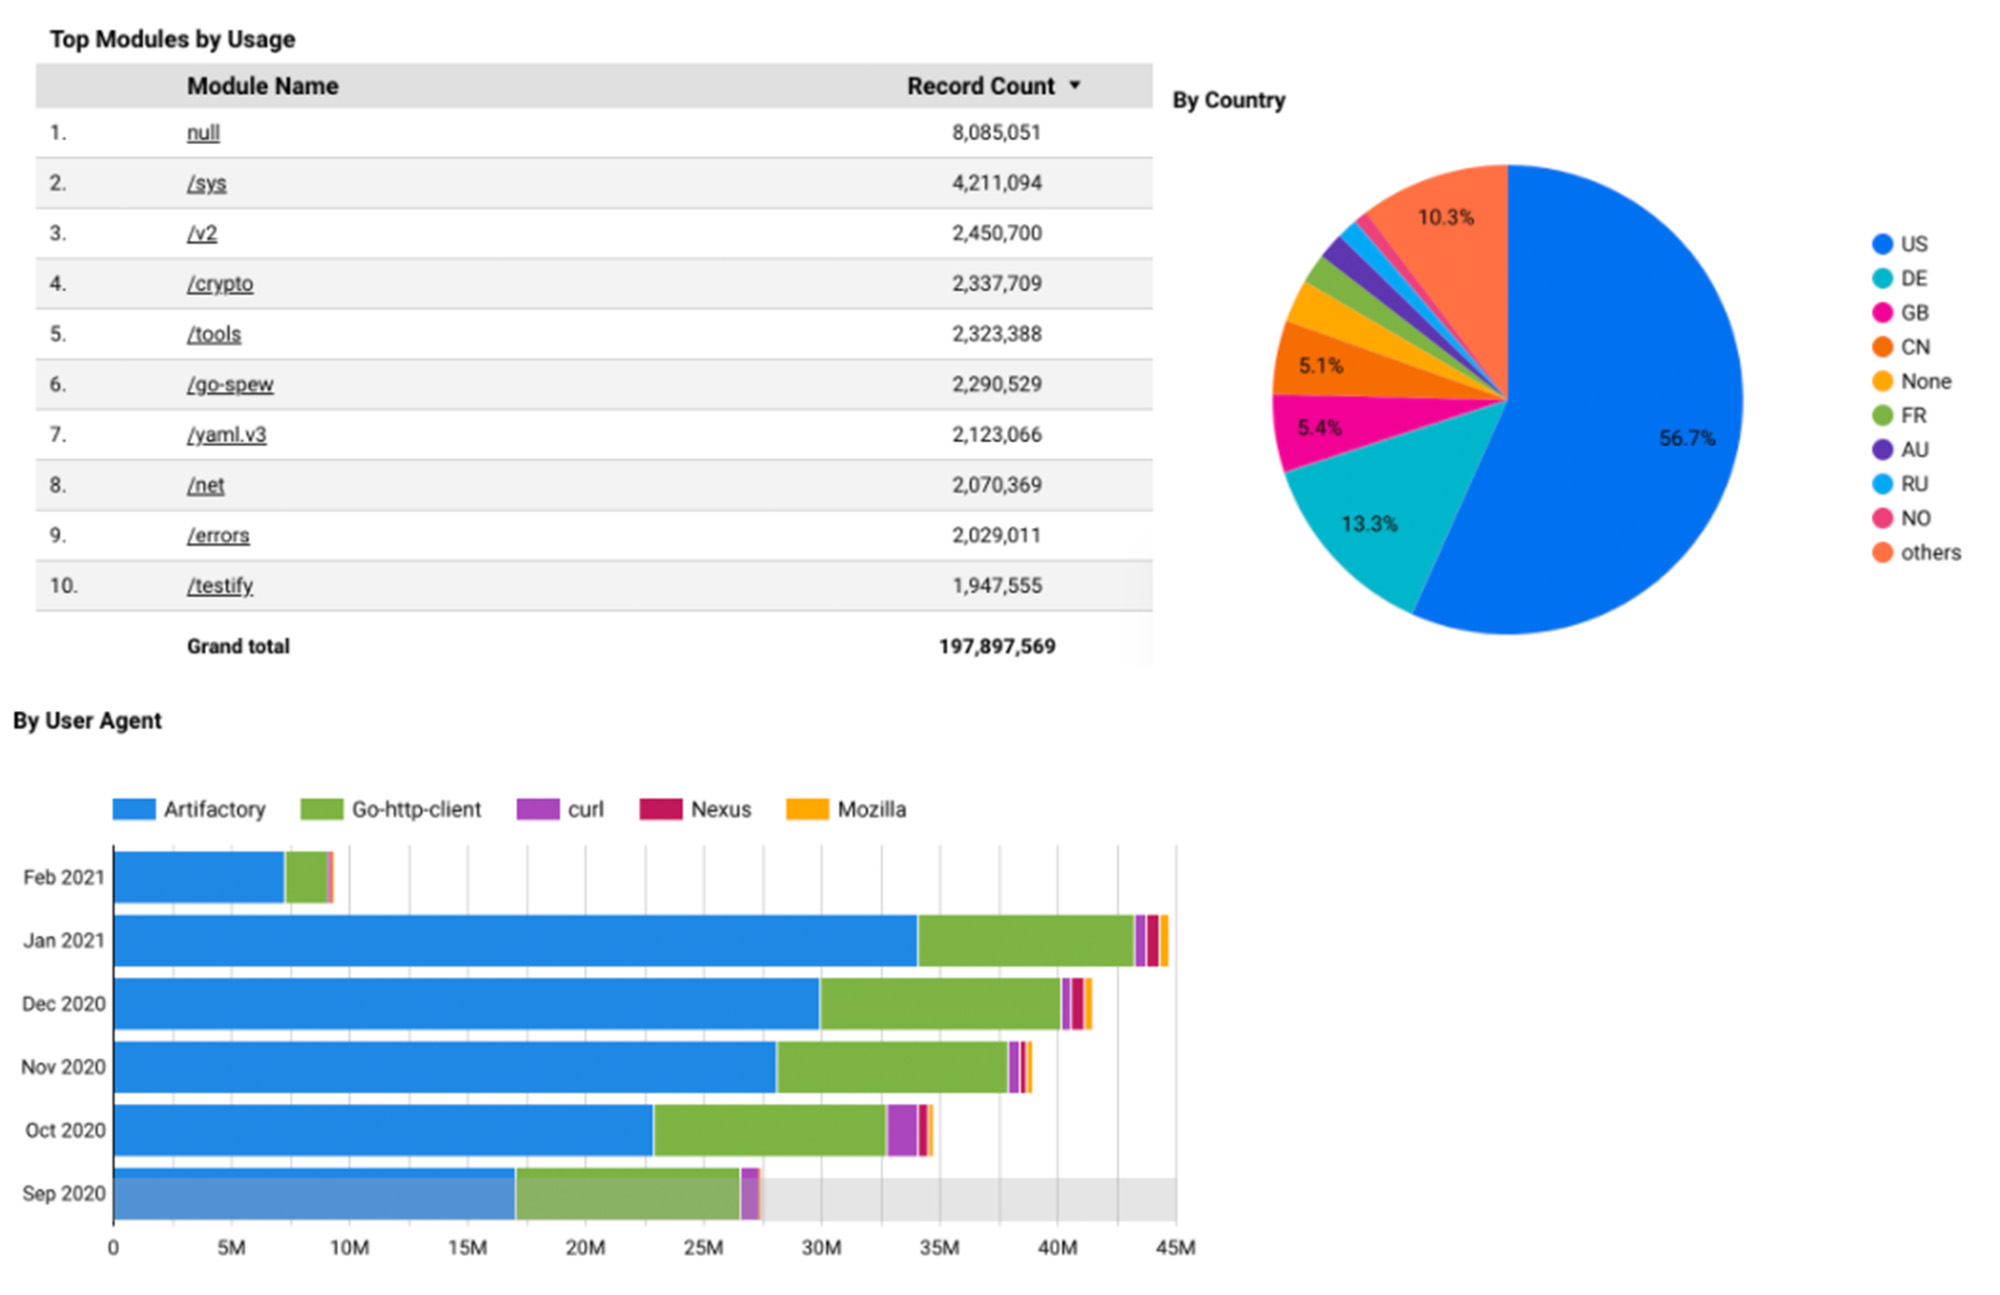
Stage 4: Visualize
To visualize this processed data, we used GCP Data Studio, a free service that has petabyte-scale processing power and end-to-end integration with the rest of Google Cloud Platform.
Data Studio supports 14 Google ecosystem connectors, including BigQuery. One of the unique and beneficial features of Google Data Studio is that it promotes collaboration with other Google Workspace apps. This made it a perfect choice for our BI tool.
We created a datasource by selecting the project, dataset, and table we want to visualize. Clicking Explore with Data Studio creates a new report page with options to add charts, filters, and metrics.
Big Data for Big DevOps
With the ability to collect, process, and visualize this huge amount of log data, our JFrog operations teams are better able to understand the evolving needs of our SaaS customers, and to keep their accounts running smoothly on Google Cloud Platform.
Through this, we’re even more keenly aware of how JFrog’s enterprise customers rely on the 100s of terabytes of artifact data that collectively pass through their artifact repositories each day to practice DevOps in the cloud. BigQuery’s ability to process this big data helps keep us -- and our customers -- running at peak efficiency.
To accelerate your releases and delivery at enterprise scale through cloud DevOps, check out an Enterprise+ Cloud subscription to the JFrog Platform on Google Cloud Marketplace.