Event Monitoring with explanations on the Google Cloud
Chanchal Chatterjee
Cloud AI Program Manager, Google Cloud
John Sipple
Staff Software Engineer for Enterprise AI, Google
Use Cases
We are describing a new production machine learning solution to monitor events in IT and industrial operations and explain their symptoms. This solution is used for a variety of industrial applications including proactively monitoring IT operations infrastructure, monitoring events in the Industrial Internet of Things (IoT) connected devices, and predictive monitoring to any IT operations management component such as hyperconverged, Clouds, virtual infrastructure, applications, networks and microservices.
The solution is deployed on Google Cloud Platform by combining the innovative research from Google’s corporate engineering and machine learning and operationalization tools of Google Cloud put together by Google Cloud’s professional services.
Key benefits of our approach are:
Google’s novel solution provides a scalable, unsupervised approach on largely unlabeled data to proactively monitor events in data streams and explain the predictions. Our approach is particularly useful when:
data is correlated and multi-modal,
failures are complex,
conditions are unpredictable, and
monitored components are too new to characterize normal and failure modes.
Our solution provides explanations of the predicted failures by using Google Research’s innovative model explainability technology.
Our solution has been deployed in a variety of industrial and IT management applications including:
Power and climate control in commercial buildings and power equipment.
IT infrastructure monitoring and management.
Badge readers and alarms in physical security systems.
Electromechanical components in power plants.
In this blog we describe how our solution is deployed to address industry critical problems of smart IT operations management for Zenoss, an IT service assurance company.
Algorithm
Imagine you’re a technician that maintains thousands of networked devices. These devices can be virtual machines, servers, HVAC units, engines, etc. that generate a data stream of timestamped, multidimensional measurement updates. Chances are high that at any given time, somewhere in the fleet there are faulty devices that require your attention. Due to complex device interactions and a dynamic environment, it may be impossible to characterize normal operating conditions with rules or even to train a machine learning classifier with labeled failure examples. Unsupervised anomaly detectors (trained without labels), like Isolation Forest, One-Class Support Vector Machines, are commonly used in those situations, but provide a nondescript alarm when the device generates unusual updates.
Detecting a faulty device is only the beginning of a technician’s task, and the repair requires more than that nondescript alarm to:
Determine if the anomaly is a true positive,
Diagnose the problem and estimate the root cause,
Triage and prioritize the problem,
Identify and apply a fix, and
Verify the fix was successful.
In the following paragraphs, we will consider three practical anomaly detection concepts that are essential to accomplishing these tasks: accuracy and explainability, sensitivity to correlation and modes, and deploying at scale.
Accuracy and Explainability
A patient might describe their ailment to a doctor with variable attribution, “my nose is congested and I have a severe headache”, and a contrastive normal “normally, I can breathe easily and I usually don’t have headaches”). Similarly, we must consider both detection accuracy (false positive and false negative error rates), and explainability. Like with human symptoms, an anomaly should be explained by:
variable attributions that assign a “blame” score to the most important variables, and
a nearest contrastive normal point to illustrate how far off the anomaly is from normal.
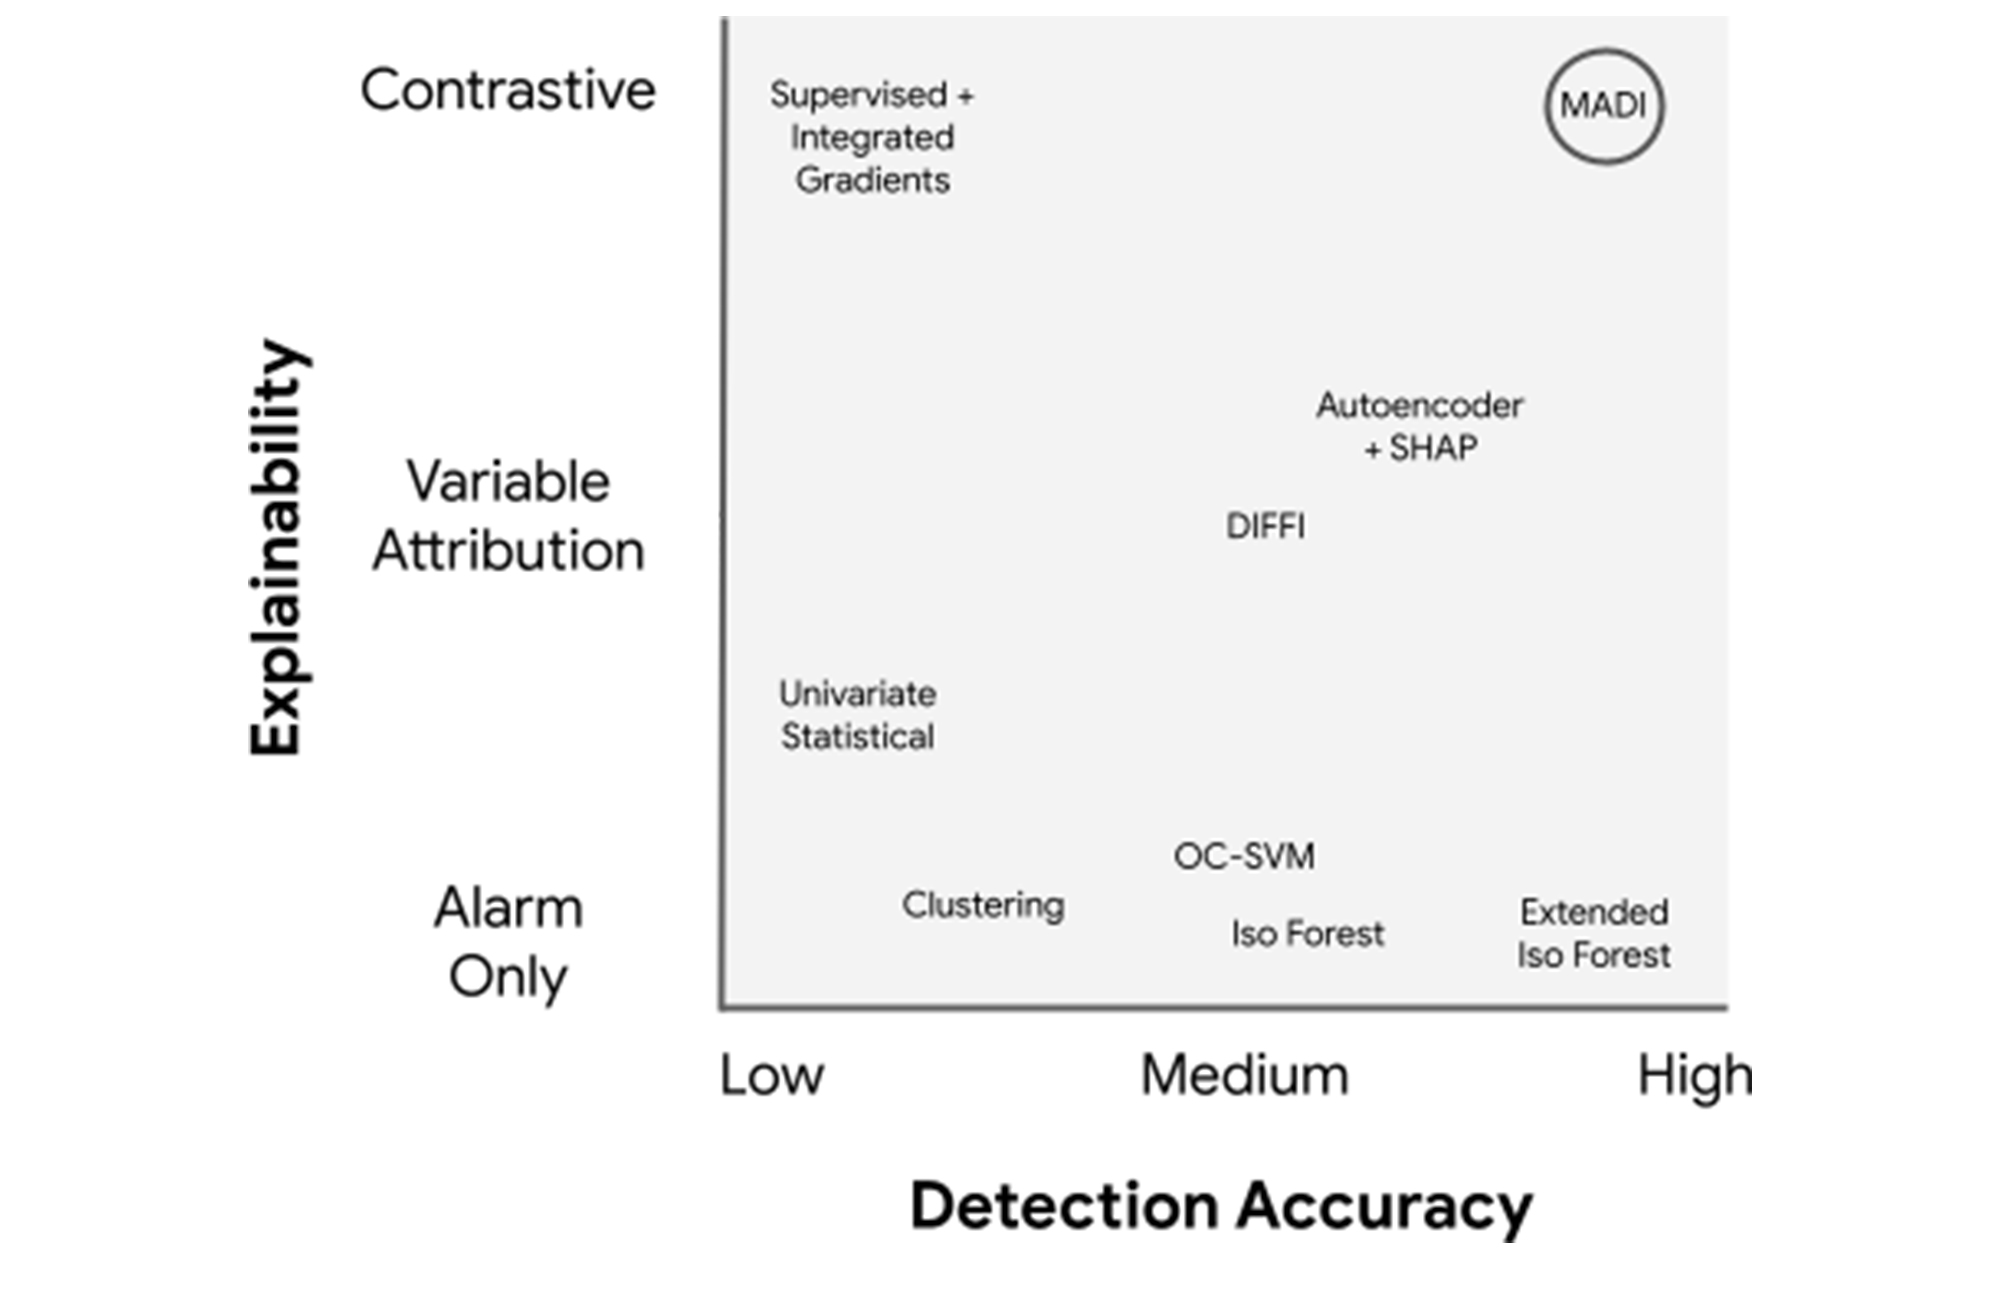
The chart below compares various anomaly detectors in terms of Detection Accuracy and Explainability.
Univariate Statistical methods apply outlier thresholds to each variable independently, and don’t recognize variable correlations or handle multimodal distributions.
Standard multivariate approaches, e.g., clustering, One Class Support Vector Machine (OC-SVM), Isolation Forest, or Extended Isolation Forest, provide medium to high detection accuracies, but no explanation.
Both DIFFI and Autoencoder+SHAP provide variable attributions and medium detection accuracy.
A supervised classifier trained on failure labels that uses Integrated Gradients provides contrastive explanations, but low detection accuracy.
Our solution combines both high detection accuracy and contrastive explanations.
The illustration below illustrates an explained anomaly on a Variable Air Volume (VAV) used to ventilate office spaces.
Anomaly Alert: The device registered a high Anomaly Score of 1.0 at 12:24 pm.
Variable Attribution: The anomaly is attributed to two variables: 43% of the anomaly detection is blamed on the heating water valve and 41% of the anomaly is blamed on the supply air flow rate.
Contrastive Explanation: The observed anomalous valve setting is 100% open, but the nearest normal point is 6%. Likewise the air flow rate is set at 1.2 thousand cubic feet per minute, but the nearest normal is 0.5.
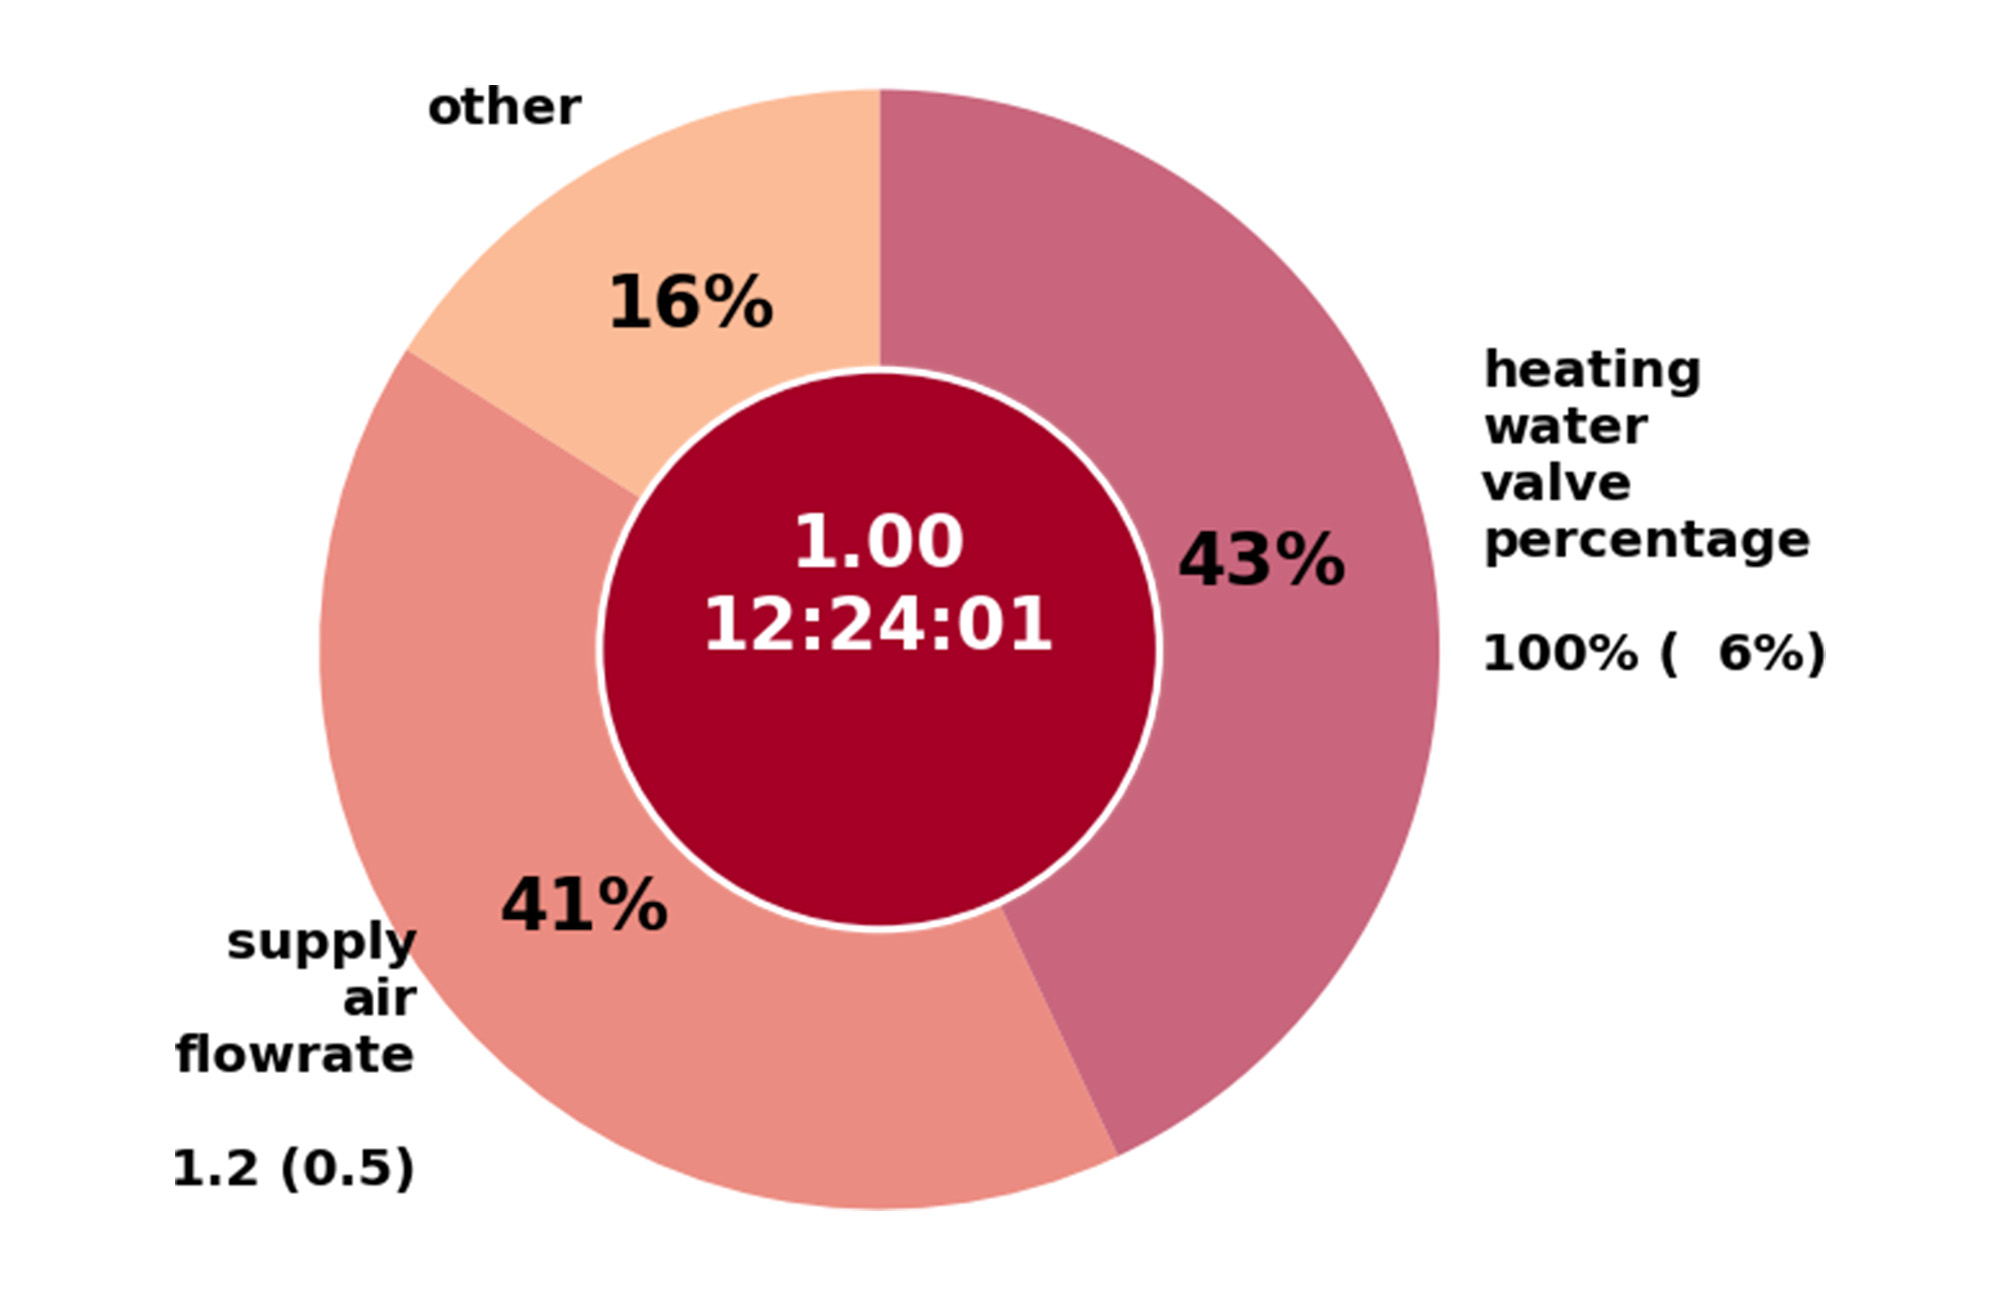
With this information, the technician, like the doctor, can evaluate the symptoms, diagnose the problem and prescribe a treatment. Here, the technician may identify the root cause of this anomaly as an insufficient supply water temperature that is preventing the air from being heated properly, and fix the problem.
Achieve better detection accuracy
Under normal operations, variables are frequently correlated, sometimes nonlinearly. In a simple case, a thermostat’s room temperature reading and the setpoint should correlate linearly. However, in a diesel engine, the relationship between oil pressure, oil temperature, and RPM is much more complex.
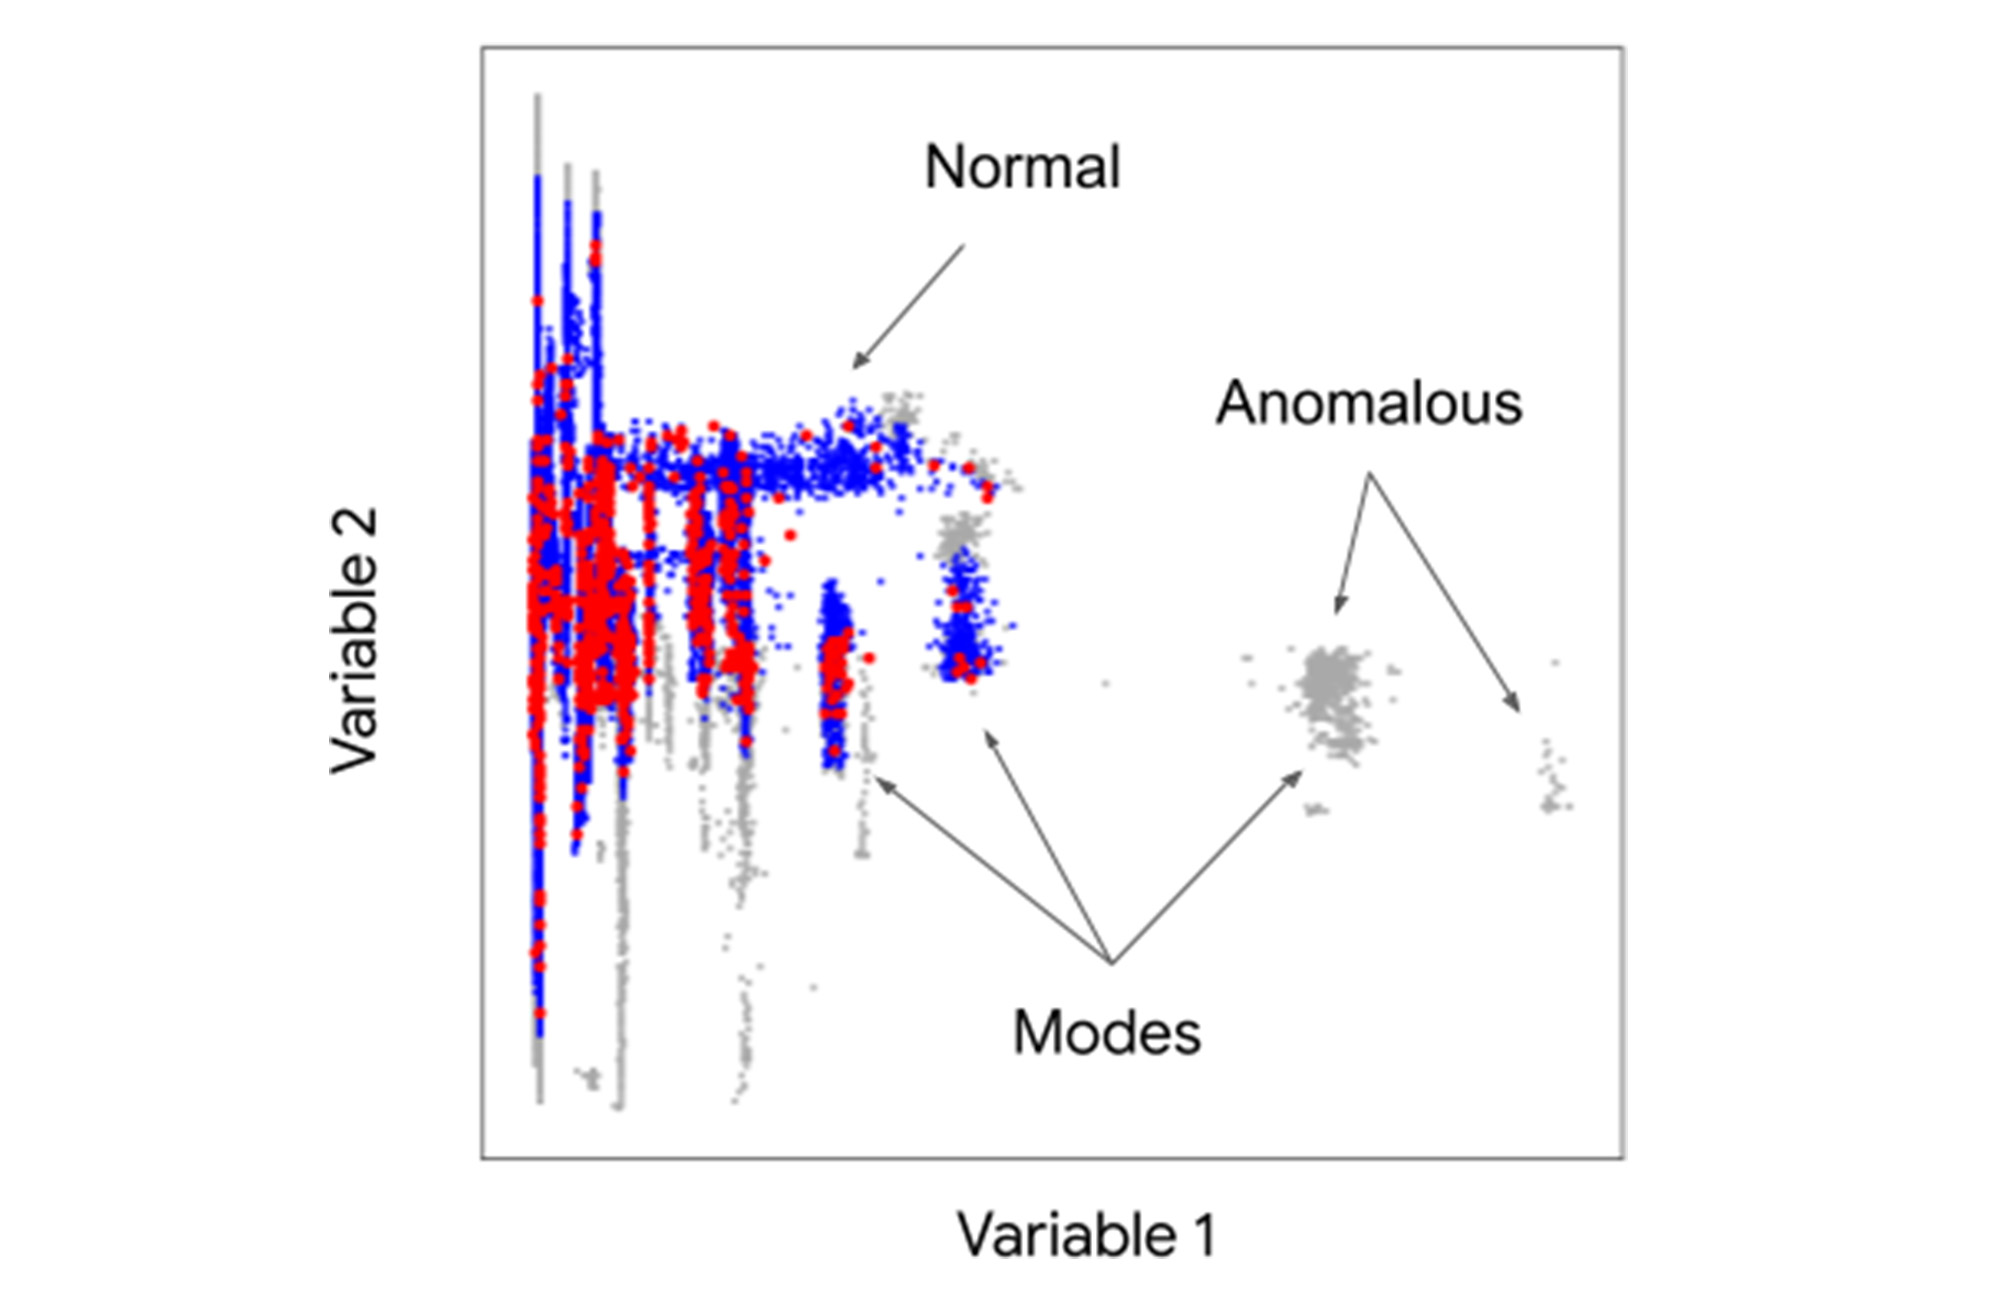
Another complicating factor with devices that operate in different modes (idle/active, day/night, takeoff/cruise/landing) is that normal operations might generate multimodal distributions with multiple peaks in one or more dimensions. The scatterplot below illustrates how just two variables from a device generate complex interactions. The blue dots represent what the anomaly detector identifies as normal, the red dots are selected as contrastive exemplar points, and the gray dots represent anomalous regions that can appear as individual outliers or modes.
Our solution achieves better detection accuracy with its sensitivity to correlations and multimodal distributions by combining negative sampling and deep learning. A negative sample augments the unlabeled training data and represents anomalous space. A deep neural network then learns efficient decision boundaries between normal and anomalous regions, even with data that has complex correlations and multimodal distributions.
Deploy at Scale
Scale the Fleet with Cohorts. In a system with thousands of devices, it is usually impossible for a single anomaly detector to keep up with the combined data stream. It’s also not efficient to run a separate anomaly detector for each device. We need a way to distribute the anomaly detection processing. In Internet of Things (IoT) applications, devices typically fall into categories or device types. For example, in building climate control systems, there are air conditioners, blowers, hot water systems, ventilation units, shaders, etc. The devices that are of the same category and operating condition can be grouped into cohorts, and devices can be compared against their peers.
Assigning devices into cohorts provides two important advantages:
Larger histories from many similar devices provide richer statistical baselines that lead to better decision boundaries.
Launching anomaly detection processes on each cohort enables on-demand scaling from hundreds to millions of devices.
Handle device churn automatically. We have learned that whenever you monitor a large fleet, things are not stationary. Old devices are replaced, and even whole device types may be added or removed. For scalability, this “device churn” should be handled automatically. The logic for assigning cohorts tends to vary with use cases, but, in general, the cohort assignment process periodically updates a membership table that places each device to a cohort.
When a new device is added to the cohort, the appropriate anomaly detector begins to query for that device along with all the other devices in its cohort.
When a new cohort is created, a new anomaly detection process is initiated.
Likewise, when a device is removed from a cohort, the anomaly detector removes it from its query configuration.
When a cohort is dropped, the associated anomaly detection process is terminated.
Google’s first implementation on smart buildings. Originally designed to monitor tens of thousands of climate control devices in hundreds of buildings, at Google, we developed a general purpose pipeline for explained anomaly detection that operates at scale. We have open-sourced the machine learning algorithm and published a paper of our deep learning algorithm for explained anomalies. It combines negative-sampling with a deep learning classifier, and then applies Integrated Gradients to produce an explanation, selecting the “nearest normal” as a baseline point. The variable attributions, or blames, and that nearest normal point provide a rich contrastive explanation that provides the technician with the anomaly symptoms and enables the technician to reason about the root cause and select a treatment.
Machine Learning Solution
The solution brings together the following assets within Google:
A novel unsupervised anomaly detection algorithm from Google’s corporate engineering and Research.
A distinctive model explanation technology from Google’s research and implemented in over 20+ Google products including GCP.
Machine Learning (ML) and ML Operations (MLOps) tools of Google Cloud Platform (GCP).
A key feature of this solution is the MLOps pipeline implemented on GCP with its managed Kubeflow pipelines and Vertex AI Pipelines.
In the IT Operations management example, we have 1000s of physical IT devices or virtual infrastructure components or applications running on an IT infrastructure. We call these the components. We first identify a set of components that are equivalent, having the same fixed properties such as a disk cluster. We call this the cohort.
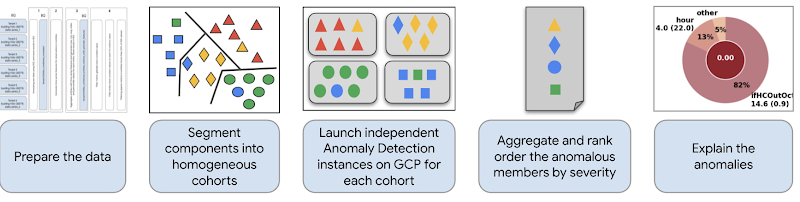
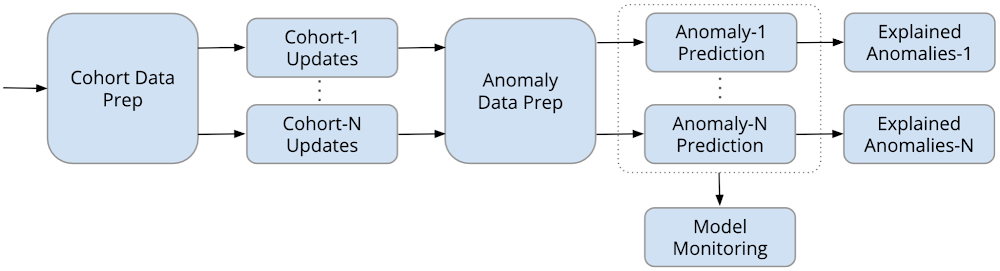
Our high level approach to the problem is to identify the cohorts which are similar components with similar behaviors and data so that we can monitor each cohort cluster for monitoring events. We then rank order the events or anomalies across the cohorts and explain the results. Figure below captures the steps of this process.
Going back to the IT Operations management example, we have 100s of devices added and deleted frequently. For your ML system to adapt to such changes, we need ML Operations (MLOps) techniques to:
Automate the execution of the ML pipeline to retrain new models on new data to capture emerging patterns. Continuous training and prediction is done with Kubeflow Pipelines or Vertex AI Pipelines.
Set up a continuous delivery system to deploy new implementations of the entire ML pipeline. CI/CD is achieved with Cloud Build.
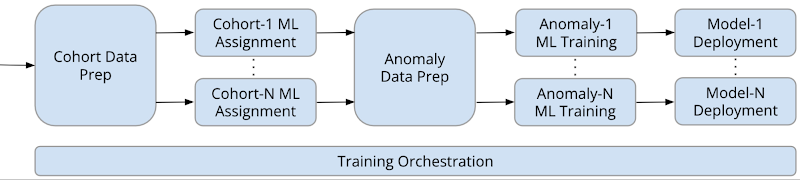
Figure below shows a training pipeline implemented with Kubeflow and Vertex AI Pipelines:
We use the trained and deployed models in the following prediction pipeline with Kubeflow and Vertex AI Pipelines:
Zenoss AI-Driven Full-Stack Monitoring
Global enterprise customers in a number of industries are already using our novel monitoring solution to solve industry specific challenges.
For Zenoss, a Forester leader in Intelligent Application and Service Monitoring, a machine learning solution that performs at very high accuracy with minimal operational overhead is essential to its AIOps strategy. At a high level, AIOps tools do two things — they collect data and they analyze data — in the interest of accelerating problem resolution in IT operations. Users of application and service monitoring tools for IT operations expect more and more artificial intelligence in the solutions they rely on to keep their systems healthy. The promise of applying machine learning to efficiently analyze data, triage problems, and even remediate the problem without any human intervention, has now become reality.
To address this growing demand for AIOps on infrastructure monitoring platforms, Zenoss partnered with Google Cloud’s AI team to reimagine the way ML could be applied to anomaly detection. We brought our learnings from the Smart Buildings team, who developed an AI-based fault-detection solution to help find and fix problems in climate control devices in large office buildings. We also leveraged Vertex AI, which brings together the Google Cloud services for building ML under one, unified UI and API. The result was a distributed deep-learning solution inside Zenoss’ platform that provides explanations to aid understanding, prioritizing and fixing faults in IT infrastructure.
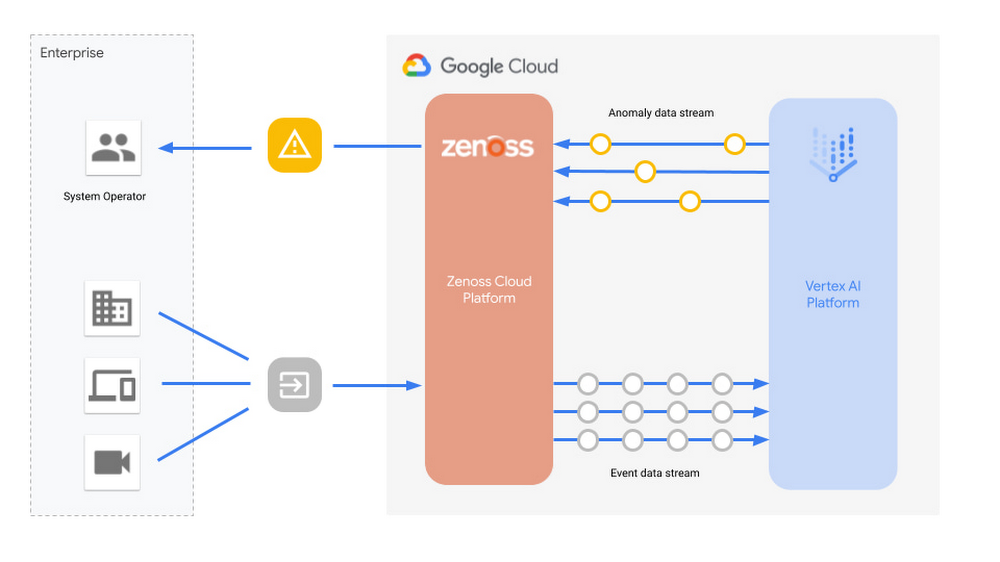
A key benefit of this solution for Zenoss’ customers is that newly monitored devices no longer need to collect months worth of data to train the model to make accurate predictions. Our open-sourced machine learning algorithm provides a scalable, unsupervised approach to proactively monitor events, giving IT operations professionals the immediate insight they need to reliably monitor IT services. Using our algorithm, Zenoss has delivered Google-powered anomaly detection to enterprise customers, helping them ensure their business critical IT infrastructure is always available.
“We know that AIOps represents the future for many of our customers,” says Ani Gujrathi, CTO at Zenoss. “Our customers want highly reliable and actionable data about the state of their infrastructure surfaced to IT Operations with as little human intervention as possible—on-prem, in the public cloud, or in multiple public clouds—seamlessly and securely. We’re excited to make that possible by integrating Google’s proven anomaly detection algorithm with our full-stack monitoring platform, streamlining our MLOps using Vertex AI, and growing our partnership with Google Cloud.”
Google Cloud’s commitments to making machine learning more accessible and useful and to increasing the efficacy of machine learning for enterprises in their unique industries are at the core of everything we do. With the myriad of proven machine learning solutions within Google, the breadth of AI/ML specialists within Google Cloud, and the suite of unified machine learning tools within Vertex AI, organizations can take advantage of these capabilities to transform their businesses.
Ready to start ML modeling with Vertex AI? Start building for free. Want to know how Vertex AI Platform can help your enterprise increase return on ML investments? Contact us.
Acknowledgement: Micah Knox, Principal Architect, Google Cloud