在 BigQuery ML 中创建机器学习模型

本教程向用户介绍如何通过 Google Cloud 控制台来使用 BigQuery ML。

通过 BigQuery ML,用户可以使用 SQL 查询和 Python 代码在 BigQuery 中创建和执行机器学习模型。其目标是让 SQL 专业人员能够利用现有的工具构建模型,从而实现机器学习的普及,并通过消除数据移动需求来提高开发速度。

在本教程中,您可利用适用于 BigQuery 的 Google Analytics(分析)示例数据集创建一个模型,预测网站访客是否会进行交易。如需了解 Analytics 数据集架构,请访问 Analytics 帮助中心,然后查看 BigQuery Export 架构

目标

在本教程中,您将需要:

  • BigQuery ML,用于通过 CREATE MODEL 语句来创建二元逻辑回归模型
  • ML.EVALUATE 函数,用于评估机器学习模型
  • ML.PREDICT 函数,用于通过机器学习模型进行预测

费用

本教程使用 Google Cloud 的收费组件,包括以下组件:

  • BigQuery
  • BigQuery ML

如需了解有关 BigQuery 费用的更多信息,请参阅 BigQuery 价格页面。

如需详细了解 BigQuery ML 费用,请参阅 BigQuery ML 价格

准备工作

  1. 登录您的 Google Cloud 账号。如果您是 Google Cloud 新手,请创建一个账号来评估我们的产品在实际场景中的表现。新客户还可获享 $300 赠金,用于运行、测试和部署工作负载。
  2. 在 Google Cloud Console 中的项目选择器页面上,选择或创建一个 Google Cloud 项目

    转到“项目选择器”

  3. 确保您的 Google Cloud 项目已启用结算功能

  4. 在 Google Cloud Console 中的项目选择器页面上,选择或创建一个 Google Cloud 项目

    转到“项目选择器”

  5. 确保您的 Google Cloud 项目已启用结算功能

  6. 新项目会自动启用 BigQuery。如需在现有项目中激活 BigQuery,请转到

    启用 BigQuery API。

    启用 API

创建数据集

创建 BigQuery 数据集以存储您的机器学习模型:

  1. 在 Google Cloud 控制台中,转到 BigQuery 页面。

    转到 BigQuery 页面

  2. 探索器窗格中,点击您的项目名称。

  3. 点击 查看操作 > 创建数据集

    创建数据集。

  4. 创建数据集页面上,执行以下操作:

    • 数据集 ID 部分,输入 bqml_tutorial

    • 位置类型部分,选择多区域,然后选择 US (multiple regions in United States)(美国[美国的多个区域])。

      公共数据集存储在 US 多区域中。为简单起见,请将数据集存储在同一位置。

    • 保持其余默认设置不变,然后点击创建数据集

      创建数据集页面。

创建模型

接下来,您可利用适用于 BigQuery 的 Analytics(分析)示例数据集创建逻辑回归模型。

SQL

以下 GoogleSQL 查询用于创建您用来预测网站访问者是否进行交易的模型。

#standardSQL
CREATE MODEL `bqml_tutorial.sample_model`
OPTIONS(model_type='logistic_reg') AS
SELECT
IF(totals.transactions IS NULL, 0, 1) AS label,
IFNULL(device.operatingSystem, "") AS os,
device.isMobile AS is_mobile,
IFNULL(geoNetwork.country, "") AS country,
IFNULL(totals.pageviews, 0) AS pageviews
FROM
`bigquery-public-data.google_analytics_sample.ga_sessions_*`
WHERE
_TABLE_SUFFIX BETWEEN '20160801' AND '20170630'

除了创建模型之外,运行包含 CREATE MODEL 语句的查询还可使用查询的 SELECT 语句检索到的数据来训练模型。

查询详情

CREATE MODEL 子句用于创建和训练名为 bqml_tutorial.sample_model 的模型。

OPTIONS(model_type='logistic_reg') 子句表示您正在创建逻辑回归模型。逻辑回归模型会尝试将输入数据拆分为两类,并提供数据属于其中一类的概率。通常来说,您要检测的内容(例如电子邮件是否为垃圾邮件)由 1 表示,其他所有内容均由 0 表示。如果逻辑回归模型输出 0.9,那么输入是您尝试检测的内容的概率为 90%(电子邮件是垃圾邮件)。

此查询的 SELECT 语句检索模型使用的以下列来预测客户完成交易的概率:

  • totals.transactions - 会话中的电子商务交易总数。如果交易数为 NULL,则 label 列中的值会设置为 0。否则,该值会设置为 1。这些值表示可能的结果。创建名为 label 的别名是在 CREATE MODEL 语句中设置 input_label_cols= 选项的替代方法。
  • device.operatingSystem - 访问者设备的操作系统。
  • device.isMobile - 指示访问者的设备是否为移动设备。
  • geoNetwork.country - 根据 IP 地址推测会话发生的国家/地区。
  • totals.pageviews - 会话中的网页浏览总量。

FROM 子句 - bigquery-public-data.google_analytics_sample.ga_sessions_* - 表示您正在查询 Google Analytics(分析)示例数据集。此数据集位于 bigquery-public-data 项目中。您正在查询一组按日期分片的表。这由表名称中的通配符表示:google_analytics_sample.ga_sessions_*

WHERE 子句 - _TABLE_SUFFIX BETWEEN '20160801' AND '20170630' - 限制查询扫描的表的数量。扫描的日期范围是 2016 年 8 月 1 日至 2017 年 6 月 30 日。

运行 CREATE MODEL 查询

要运行 CREATE MODEL 查询来创建和训练模型,请执行以下操作:

  1. 在 Google Cloud 控制台中,点击编写新查询按钮。如果文本无法点击,则表示查询编辑器已经打开。

编写查询按钮

  1. 查询编辑器文本区域中输入以下 GoogleSQL 查询。

    #standardSQL
    CREATE MODEL `bqml_tutorial.sample_model`
    OPTIONS(model_type='logistic_reg') AS
    SELECT
    IF(totals.transactions IS NULL, 0, 1) AS label,
    IFNULL(device.operatingSystem, "") AS os,
    device.isMobile AS is_mobile,
    IFNULL(geoNetwork.country, "") AS country,
    IFNULL(totals.pageviews, 0) AS pageviews
    FROM
    `bigquery-public-data.google_analytics_sample.ga_sessions_*`
    WHERE
    _TABLE_SUFFIX BETWEEN '20160801' AND '20170630'
    
  2. 点击运行

    查询需要几分钟才能完成。第一次迭代完成后,您的模型 (sample_model) 会显示在导航面板中。由于查询使用 CREATE MODEL 语句来创建模型,因此您看不到查询结果。

    您可以通过查看模型统计信息标签页来观察正在训练的模型。第一次迭代结束后,标签页会立即更新。每次迭代完成后,统计信息会继续更新。

BigQuery DataFrame

在尝试此示例之前,请按照《BigQuery 快速入门:使用 BigQuery DataFrames》中的 BigQuery DataFrames 设置说明进行操作。如需了解详情,请参阅 BigQuery DataFrames 参考文档

如需向 BigQuery 进行身份验证,请设置应用默认凭据。 如需了解详情,请参阅为本地开发环境设置身份验证

from bigframes.ml.linear_model import LogisticRegression
import bigframes.pandas as bpd

# Start by selecting the data you'll use for training. `read_gbq` accepts
# either a SQL query or a table ID. Since this example selects from multiple
# tables via a wildcard, use SQL to define this data. Watch issue
# https://github.com/googleapis/python-bigquery-dataframes/issues/169
# for updates to `read_gbq` to support wildcard tables.

df = bpd.read_gbq_table(
    "bigquery-public-data.google_analytics_sample.ga_sessions_*",
    filters=[
        ("_table_suffix", ">=", "20160801"),
        ("_table_suffix", "<=", "20170630"),
    ],
)

# Extract the total number of transactions within
# the Google Analytics session.
#
# Because the totals column is a STRUCT data type, call
# Series.struct.field("transactions") to extract the transactions field.
# See the reference documentation below:
# https://cloud.google.com/python/docs/reference/bigframes/latest/bigframes.operations.structs.StructAccessor#bigframes_operations_structs_StructAccessor_field
transactions = df["totals"].struct.field("transactions")

# The "label" values represent the outcome of the model's
# prediction. In this case, the model predicts if there are any
# ecommerce transactions within the Google Analytics session.
# If the number of transactions is NULL, the value in the label
# column is set to 0. Otherwise, it is set to 1.
label = transactions.notnull().map({True: 1, False: 0}).rename("label")

# Extract the operating system of the visitor's device.
operating_system = df["device"].struct.field("operatingSystem")
operating_system = operating_system.fillna("")

# Extract whether the visitor's device is a mobile device.
is_mobile = df["device"].struct.field("isMobile")

# Extract the country from which the sessions originated, based on the IP address.
country = df["geoNetwork"].struct.field("country").fillna("")

# Extract the total number of page views within the session.
pageviews = df["totals"].struct.field("pageviews").fillna(0)

# Combine all the feature columns into a single DataFrame
# to use as training data.
features = bpd.DataFrame(
    {
        "os": operating_system,
        "is_mobile": is_mobile,
        "country": country,
        "pageviews": pageviews,
    }
)

# Logistic Regression model splits data into two classes, giving the
# a confidence score that the data is in one of the classes.
model = LogisticRegression()
model.fit(features, label)

# The model.fit() call above created a temporary model.
# Use the to_gbq() method to write to a permanent location.
model.to_gbq(
    your_model_id,  # For example: "bqml_tutorial.sample_model",
    replace=True,
)

获取训练统计信息

如需查看模型训练的结果,您可以使用 ML.TRAINING_INFO 函数,也可以在 Google Cloud 控制台中查看统计信息。在本教程中,您将使用 Google Cloud 控制台。

机器学习的目的是创建可利用数据进行预测的模型。该模型本质上是一个函数,该函数接受输入并对输入进行计算以产生输出(即预测)。

机器学习算法的工作原理是:采用预测结果已知的几个示例(例如用户购买行为的历史数据)并以迭代方式调整模型中的各种权重,以使模型的预测结果与真实值相符。该算法通过最大限度地降低模型的错误程度(采用称为损失的指标来衡量)来实现此目标。

期望的情况是每次迭代损失应该减少(理想情况下为零)。损失为零意味着模型 100% 准确。

要查看运行 CREATE MODEL 查询时生成的模型训练统计信息,请执行以下操作:

  1. 在 Google Cloud 控制台的导航面板的资源部分中,展开 [PROJECT_ID] > bqml_tutorial,然后点击 sample_model

  2. 点击模型统计信息标签。结果应如下所示:

    ML.TRAINING_INFO 输出

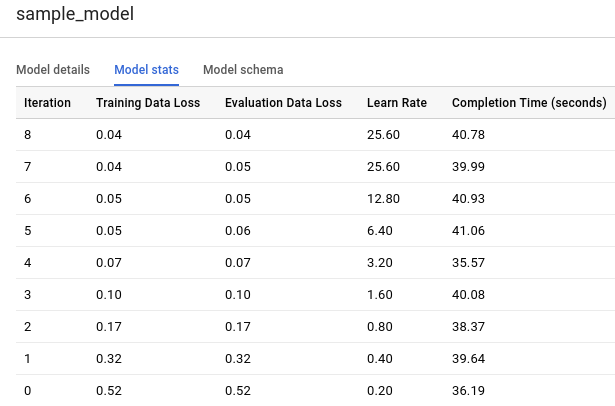
    训练数据损失列表示训练数据集迭代后计算得出的损失指标。由于您执行了逻辑回归,因此该列为对数损失评估数据损失列是根据留出数据集(从训练中收回用于验证模型的数据)计算得出的相同损失指标。

    BigQuery ML 会将输入数据自动拆分为训练集和维持集,以避免过拟合模型。这十分必要,因此训练算法无法对未概括为未知新示例的已知数据进行严密定制。

    训练数据损失和评估数据损失为平均损失值,对各个集合中的所有示例取平均值。

    如需详细了解 ML.TRAINING_INFO 函数,请参阅 BigQuery ML 语法参考文档

评估模型

创建模型后,您可以使用 ML.EVALUATE 函数评估分类器的性能。ML.EVALUATE 函数根据实际数据评估预测值。如需计算逻辑回归特定指标,请使用 ML.ROC_CURVE SQL 函数bigframes.ml.metrics.roc_curve BigQuery DataFrames 函数

在本教程中,您使用的是检测交易的二进制分类模型。这两类分别是 label 列中的值:0(无交易)和 1(有交易)。

SQL

用于评估模型的查询如下所示:

#standardSQL
SELECT
*
FROM
ML.EVALUATE(MODEL `bqml_tutorial.sample_model`, (
SELECT
IF(totals.transactions IS NULL, 0, 1) AS label,
IFNULL(device.operatingSystem, "") AS os,
device.isMobile AS is_mobile,
IFNULL(geoNetwork.country, "") AS country,
IFNULL(totals.pageviews, 0) AS pageviews
FROM
`bigquery-public-data.google_analytics_sample.ga_sessions_*`
WHERE
_TABLE_SUFFIX BETWEEN '20170701' AND '20170801'))

查询详情

最顶层的 SELECT 语句从模型中检索列。

FROM 子句使用 ML.EVALUATE 函数评估模型 bqml_tutorial.sample_model

此查询的嵌套 SELECT 语句和 FROM 子句与 CREATE MODEL 查询中的相同。

WHERE 子句 - _TABLE_SUFFIX BETWEEN '20170701' AND '20170801' - 限制查询扫描的表的数量。扫描的日期范围是 2017 年 7 月 1 日到 2017 年 8 月 1 日。这数据供您评估模型预测性能。这是在训练数据跨越的时间段之后的一个月中收集的。

运行 ML.EVALUATE 查询

要运行 ML.EVALUATE 查询以评估模型,请执行以下操作:

  1. 在 Google Cloud 控制台中,点击编写新查询按钮。

  2. 查询编辑器文本区域中输入以下 GoogleSQL 查询。

    #standardSQL
    SELECT
    *
    FROM
    ML.EVALUATE(MODEL `bqml_tutorial.sample_model`, (
    SELECT
    IF(totals.transactions IS NULL, 0, 1) AS label,
    IFNULL(device.operatingSystem, "") AS os,
    device.isMobile AS is_mobile,
    IFNULL(geoNetwork.country, "") AS country,
    IFNULL(totals.pageviews, 0) AS pageviews
    FROM
    `bigquery-public-data.google_analytics_sample.ga_sessions_*`
    WHERE
    _TABLE_SUFFIX BETWEEN '20170701' AND '20170801'))
    
  3. 点击运行

  4. 查询完成后,点击查询文本区域下方的结果标签页。结果应如下所示:

    +--------------------+---------------------+--------------------+--------------------+---------------------+----------+
    |     precision      |       recall        |      accuracy      |      f1_score      |      log_loss       | roc_auc  |
    +--------------------+---------------------+--------------------+--------------------+---------------------+----------+
    | 0.4451901565995526 | 0.08879964301651048 | 0.9716829479411401 | 0.1480654761904762 | 0.07921781778780206 | 0.970706 |
    +--------------------+---------------------+--------------------+--------------------+---------------------+----------+
    

    由于您执行了逻辑回归,因此结果包含以下列:

    • precision - 一种分类模型指标。精确率指模型正确预测正类别的频率。

    • recall - 分类模型指标,可为您提供以下信息:在所有可能的正例标签中,模型正确识别了多少个标签?

    • accuracy - 准确率是分类模型做出正确预测的比例。

    • f1_score - 用于衡量模型的准确率。f1 得分是精确率和召回率的调和平均数。f1 得分的最佳值为 1。最差值为 0。

    • log_loss - 逻辑回归中所用的损失函数。该指标用于衡量模型的预测结果与正确标签之间的差距。

    • roc_auc - ROC 曲线下的面积。这指的是分类服务认为随机选择的正例比随机选择的负例为正的概率更高。如需了解详情,请参阅机器学习速成课程中的分类

BigQuery DataFrame

在尝试此示例之前,请按照《BigQuery 快速入门:使用 BigQuery DataFrames》中的 BigQuery DataFrames 设置说明进行操作。如需了解详情,请参阅 BigQuery DataFrames 参考文档

如需向 BigQuery 进行身份验证,请设置应用默认凭据。 如需了解详情,请参阅为本地开发环境设置身份验证

import bigframes.pandas as bpd

# Select model you'll use for evaluating. `read_gbq_model` loads model data from a
# BigQuery, but you could also use the `model` object from the previous steps.
model = bpd.read_gbq_model(
    your_model_id,  # For example: "bqml_tutorial.sample_model",
)

# The filters parameter limits the number of tables scanned by the query.
# The date range scanned is July 1, 2017 to August 1, 2017. This is the
# data you're using to evaluate the predictive performance of the model.
# It was collected in the month immediately following the time period
# spanned by the training data.
df = bpd.read_gbq_table(
    "bigquery-public-data.google_analytics_sample.ga_sessions_*",
    filters=[
        ("_table_suffix", ">=", "20170701"),
        ("_table_suffix", "<=", "20170801"),
    ],
)

transactions = df["totals"].struct.field("transactions")
label = transactions.notnull().map({True: 1, False: 0}).rename("label")
operating_system = df["device"].struct.field("operatingSystem")
operating_system = operating_system.fillna("")
is_mobile = df["device"].struct.field("isMobile")
country = df["geoNetwork"].struct.field("country").fillna("")
pageviews = df["totals"].struct.field("pageviews").fillna(0)
features = bpd.DataFrame(
    {
        "os": operating_system,
        "is_mobile": is_mobile,
        "country": country,
        "pageviews": pageviews,
    }
)

# Some models include a convenient .score(X, y) method for evaluation with a preset accuracy metric:

# Because you performed a logistic regression, the results include the following columns:

# - precision — A metric for classification models. Precision identifies the frequency with
# which a model was correct when predicting the positive class.

# - recall — A metric for classification models that answers the following question:
# Out of all the possible positive labels, how many did the model correctly identify?

# - accuracy — Accuracy is the fraction of predictions that a classification model got right.

# - f1_score — A measure of the accuracy of the model. The f1 score is the harmonic average of
# the precision and recall. An f1 score's best value is 1. The worst value is 0.

# - log_loss — The loss function used in a logistic regression. This is the measure of how far the
# model's predictions are from the correct labels.

# - roc_auc — The area under the ROC curve. This is the probability that a classifier is more confident that
# a randomly chosen positive example
# is actually positive than that a randomly chosen negative example is positive. For more information,
# see ['Classification']('https://developers.google.com/machine-learning/crash-course/classification/video-lecture')
# in the Machine Learning Crash Course.

model.score(features, label)
#    precision    recall  accuracy  f1_score  log_loss   roc_auc
# 0   0.412621  0.079143  0.985074  0.132812  0.049764  0.974285
# [1 rows x 6 columns]

使用模型预测结果

您现已对模型进行了评估,下一步是用其预测结果。您利用自己的模型来预测每个国家/地区的网站访问者的交易数量。

SQL

用于预测结果的查询如下所示:

#standardSQL
SELECT
country,
SUM(predicted_label) as total_predicted_purchases
FROM
ML.PREDICT(MODEL `bqml_tutorial.sample_model`, (
SELECT
IFNULL(device.operatingSystem, "") AS os,
device.isMobile AS is_mobile,
IFNULL(totals.pageviews, 0) AS pageviews,
IFNULL(geoNetwork.country, "") AS country
FROM
`bigquery-public-data.google_analytics_sample.ga_sessions_*`
WHERE
_TABLE_SUFFIX BETWEEN '20170701' AND '20170801'))
GROUP BY country
ORDER BY total_predicted_purchases DESC
LIMIT 10

查询详情

最顶层的 SELECT 语句检索 country 列,并对 predicted_label 列求和。该列由 ML.PREDICT 函数生成。当您使用 ML.PREDICT 函数时,模型的输出列名称为 predicted_<label_column_name>。对于线性回归模型来说,predicted_labellabel 的估计值。对于逻辑回归模型来说,predicted_label 表示最可能的标签,在本例中为 01

ML.PREDICT 函数用于通过模型 bqml_tutorial.sample_model 预测结果。

此查询的嵌套 SELECT 语句和 FROM 子句与 CREATE MODEL 查询中的相同。

WHERE 子句 - _TABLE_SUFFIX BETWEEN '20170701' AND '20170801' - 限制查询扫描的表的数量。扫描的日期范围是 2017 年 7 月 1 日到 2017 年 8 月 1 日。这是您要进行预测的数据。这是在训练数据跨越的时间段之后的一个月中收集的。

GROUP BYORDER BY 子句按国家/地区对结果进行分组,并降序排列预测购买的总和。

此处所用的 LIMIT 子句仅显示前 10 个结果。

运行 ML.PREDICT 查询

要运行利用模型预测结果的查询:

  1. 在 Google Cloud 控制台中,点击编写新查询按钮。

  2. 查询编辑器文本区域中输入以下 GoogleSQL 查询。

    #standardSQL
    SELECT
    country,
    SUM(predicted_label) as total_predicted_purchases
    FROM
    ML.PREDICT(MODEL `bqml_tutorial.sample_model`, (
    SELECT
    IFNULL(device.operatingSystem, "") AS os,
    device.isMobile AS is_mobile,
    IFNULL(totals.pageviews, 0) AS pageviews,
    IFNULL(geoNetwork.country, "") AS country
    FROM
    `bigquery-public-data.google_analytics_sample.ga_sessions_*`
    WHERE
    _TABLE_SUFFIX BETWEEN '20170701' AND '20170801'))
    GROUP BY country
    ORDER BY total_predicted_purchases DESC
    LIMIT 10
    
  3. 点击运行

  4. 查询完成后,点击查询文本区域下方的结果标签页。结果应如下所示:

+----------------+---------------------------+
|    country     | total_predicted_purchases |
+----------------+---------------------------+
| United States  |                       209 |
| Taiwan         |                         6 |
| Canada         |                         4 |
| Turkey         |                         2 |
| India          |                         2 |
| Japan          |                         2 |
| Indonesia      |                         1 |
| United Kingdom |                         1 |
| Guyana         |                         1 |
+----------------+---------------------------+

BigQuery DataFrame

在尝试此示例之前,请按照《BigQuery 快速入门:使用 BigQuery DataFrames》中的 BigQuery DataFrames 设置说明进行操作。如需了解详情,请参阅 BigQuery DataFrames 参考文档

如需向 BigQuery 进行身份验证,请设置应用默认凭据。 如需了解详情,请参阅为本地开发环境设置身份验证

import bigframes.pandas as bpd

# Select model you'll use for predicting.
# `read_gbq_model` loads model data from
# BigQuery, but you could also use the `model`
# object from the previous steps.
model = bpd.read_gbq_model(
    your_model_id,  # For example: "bqml_tutorial.sample_model",
)

# The filters parameter limits the number of tables scanned by the query.
# The date range scanned is July 1, 2017 to August 1, 2017. This is the
# data you're using to make the prediction.
# It was collected in the month immediately following the time period
# spanned by the training data.
df = bpd.read_gbq_table(
    "bigquery-public-data.google_analytics_sample.ga_sessions_*",
    filters=[
        ("_table_suffix", ">=", "20170701"),
        ("_table_suffix", "<=", "20170801"),
    ],
)

operating_system = df["device"].struct.field("operatingSystem")
operating_system = operating_system.fillna("")
is_mobile = df["device"].struct.field("isMobile")
country = df["geoNetwork"].struct.field("country").fillna("")
pageviews = df["totals"].struct.field("pageviews").fillna(0)
features = bpd.DataFrame(
    {
        "os": operating_system,
        "is_mobile": is_mobile,
        "country": country,
        "pageviews": pageviews,
    }
)
# Use Logistic Regression predict method to predict results
# using your model.
# Find more information here in
# [BigFrames](https://cloud.google.com/python/docs/reference/bigframes/latest/bigframes.ml.linear_model.LogisticRegression#bigframes_ml_linear_model_LogisticRegression_predict)

predictions = model.predict(features)

# Call groupby method to group predicted_label by country.
# Call sum method to get the total_predicted_label by country.
total_predicted_purchases = predictions.groupby(["country"])[
    ["predicted_label"]
].sum()

# Call the sort_values method with the parameter
# ascending = False to get the highest values.
# Call head method to limit to the 10 highest values.
total_predicted_purchases.sort_values(ascending=False).head(10)

# country
# United States    220
# Taiwan             8
# Canada             7
# India              2
# Japan              2
# Turkey             2
# Australia          1
# Brazil             1
# Germany            1
# Guyana             1
# Name: predicted_label, dtype: Int64

预测每位用户的购买量

在此示例中,您尝试预测每个网站访问者的交易数量。

SQL

GROUP BY 子句外,此查询与上一查询相同。GROUP BY 子句 - GROUP BY fullVisitorId - 在此用于按访客 ID 对结果进行分组。

要运行查询,请执行以下操作:

  1. 在 Google Cloud 控制台中,点击编写新查询按钮。

  2. 查询编辑器文本区域中输入以下 GoogleSQL 查询。

    #standardSQL
    SELECT
    fullVisitorId,
    SUM(predicted_label) as total_predicted_purchases
    FROM
    ML.PREDICT(MODEL `bqml_tutorial.sample_model`, (
    SELECT
    IFNULL(device.operatingSystem, "") AS os,
    device.isMobile AS is_mobile,
    IFNULL(totals.pageviews, 0) AS pageviews,
    IFNULL(geoNetwork.country, "") AS country,
    fullVisitorId
    FROM
    `bigquery-public-data.google_analytics_sample.ga_sessions_*`
    WHERE
    _TABLE_SUFFIX BETWEEN '20170701' AND '20170801'))
    GROUP BY fullVisitorId
    ORDER BY total_predicted_purchases DESC
    LIMIT 10
    
  3. 点击运行

  4. 查询完成后,点击查询文本区域下方的结果标签页。结果应如下所示:

    +---------------------+---------------------------+
    |    fullVisitorId    | total_predicted_purchases |
    +---------------------+---------------------------+
    | 9417857471295131045 |                         4 |
    | 2158257269735455737 |                         3 |
    | 5073919761051630191 |                         3 |
    | 7104098063250586249 |                         2 |
    | 4668039979320382648 |                         2 |
    | 1280993661204347450 |                         2 |
    | 7701613595320832147 |                         2 |
    | 0376394056092189113 |                         2 |
    | 9097465012770697796 |                         2 |
    | 4419259211147428491 |                         2 |
    +---------------------+---------------------------+
    

BigQuery DataFrame

在尝试此示例之前,请按照《BigQuery 快速入门:使用 BigQuery DataFrames》中的 BigQuery DataFrames 设置说明进行操作。如需了解详情,请参阅 BigQuery DataFrames 参考文档

如需向 BigQuery 进行身份验证,请设置应用默认凭据。 如需了解详情,请参阅为本地开发环境设置身份验证


import bigframes.pandas as bpd

# Select model you'll use for predicting.
# `read_gbq_model` loads model data from
# BigQuery, but you could also use the `model`
# object from the previous steps.
model = bpd.read_gbq_model(
    your_model_id,  # For example: "bqml_tutorial.sample_model",
)

# The filters parameter limits the number of tables scanned by the query.
# The date range scanned is July 1, 2017 to August 1, 2017. This is the
# data you're using to make the prediction.
# It was collected in the month immediately following the time period
# spanned by the training data.
df = bpd.read_gbq_table(
    "bigquery-public-data.google_analytics_sample.ga_sessions_*",
    filters=[
        ("_table_suffix", ">=", "20170701"),
        ("_table_suffix", "<=", "20170801"),
    ],
)

operating_system = df["device"].struct.field("operatingSystem")
operating_system = operating_system.fillna("")
is_mobile = df["device"].struct.field("isMobile")
country = df["geoNetwork"].struct.field("country").fillna("")
pageviews = df["totals"].struct.field("pageviews").fillna(0)
full_visitor_id = df["fullVisitorId"]

features = bpd.DataFrame(
    {
        "os": operating_system,
        "is_mobile": is_mobile,
        "country": country,
        "pageviews": pageviews,
        "fullVisitorId": full_visitor_id,
    }
)

predictions = model.predict(features)

# Call groupby method to group predicted_label by visitor.
# Call sum method to get the total_predicted_label by visitor.
total_predicted_purchases = predictions.groupby(["fullVisitorId"])[
    ["predicted_label"]
].sum()

# Call the sort_values method with the parameter
# ascending = False to get the highest values.
# Call head method to limit to the 10 highest values.
total_predicted_purchases.sort_values(ascending=False).head(10)

# fullVisitorId
# 9417857471295131045    4
# 0376394056092189113    2
# 0456807427403774085    2
# 057693500927581077     2
# 112288330928895942     2
# 1280993661204347450    2
# 2105122376016897629    2
# 2158257269735455737    2
# 2969418676126258798    2
# 489038402765684003     2
# Name: predicted_label, dtype: Int64

清理

为避免因本页中使用的资源导致您的 Google Cloud 账号产生费用,请按照以下步骤操作。

  • 删除您在教程中创建的项目。
  • 或者,保留项目但删除数据集。

删除数据集

删除项目也将删除项目中的所有数据集和所有表。如果您希望重复使用该项目,则可以删除在本教程中创建的数据集:

  1. 如有必要,请在 Google Cloud 控制台中打开 BigQuery 页面。

    前往 BigQuery 页面

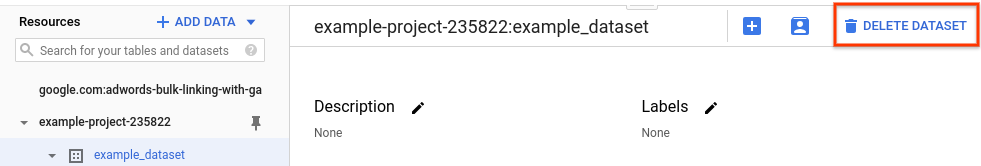
  2. 在导航窗格中,选择您创建的 bqml_tutorial 数据集。

  3. 点击窗口右侧的删除数据集。此操作会删除相关数据集、表和所有数据。

    删除数据集

  4. 删除数据集对话框中,输入您的数据集的名称 (bqml_tutorial),然后点击删除以确认删除命令。

删除项目

要删除项目,请执行以下操作:

  1. 在 Google Cloud 控制台中,进入管理资源页面。

    转到“管理资源”

  2. 在项目列表中,选择要删除的项目,然后点击删除
  3. 在对话框中输入项目 ID,然后点击关闭以删除项目。

后续步骤