This page describes details of the statistics shown in the Datastore Dashboard.
Viewing the statistics
View statistics for your application's data in the Datastore Dashboard.
In the Google Cloud console, go to the Databases page.
Select the required database from the list of databases.
In the navigation menu, click Datastore Studio.
Types of statistics
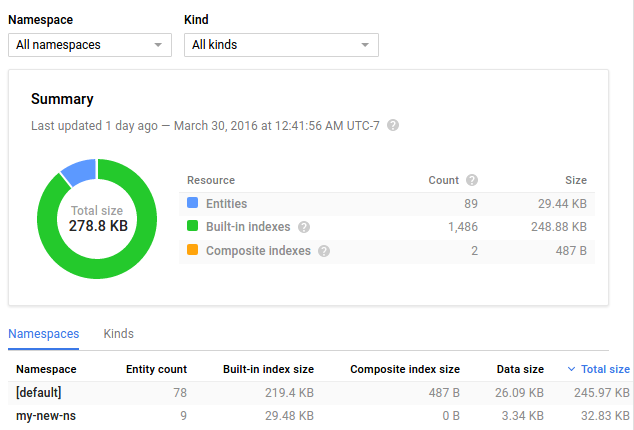
The Dashboard page displays data in various ways:
A pie chart that shows space used by each property type, such as string, double, or blob.
A pie chart showing space used by entity kind.
A table with the total space used by each property type. The "Metadata" property type represents space consumed by storing properties inside an entry that is not used by the properties directly. The "Datastore Stats" entity, if any, shows the space consumed by the statistics data itself in your database.
A table showing total size, average size, entry count, and the size of all entities, and the built-in and composite indexes.
By default, the pie charts display statistics for all entities. You can restrict the pie charts to a particular entity kind by choosing from the drop-down menu.
Storage limitations for statistics
The statistics data is stored in your application's Datastore instance. The space consumed by the statistics data increases in proportion to the number of different entity kinds and property types used by your application. If you use namespaces, each namespace contains a complete copy of the stats for that namespace. To keep the overhead of storing and updating the statistics reasonable, the database progressively drops statistics entities.
For details on statistics data and how Datastore progressively drops statistics entities, see Datastore mode Statistics.