You're viewing Apigee and Apigee hybrid documentation.
View
Apigee Edge documentation.
Symptoms
Deployments of API proxies fail with No active runtime pods warning in the Apigee hybrid UI.
Error messages
The No active runtime pods warning is displayed in the Details dialog next to the error message Deployment issues on ENVIRONMENT: REVISION_NUMBER on the API proxy page:

This issue can manifest as different errors in other resource pages of the UI. Here are some example error messages:
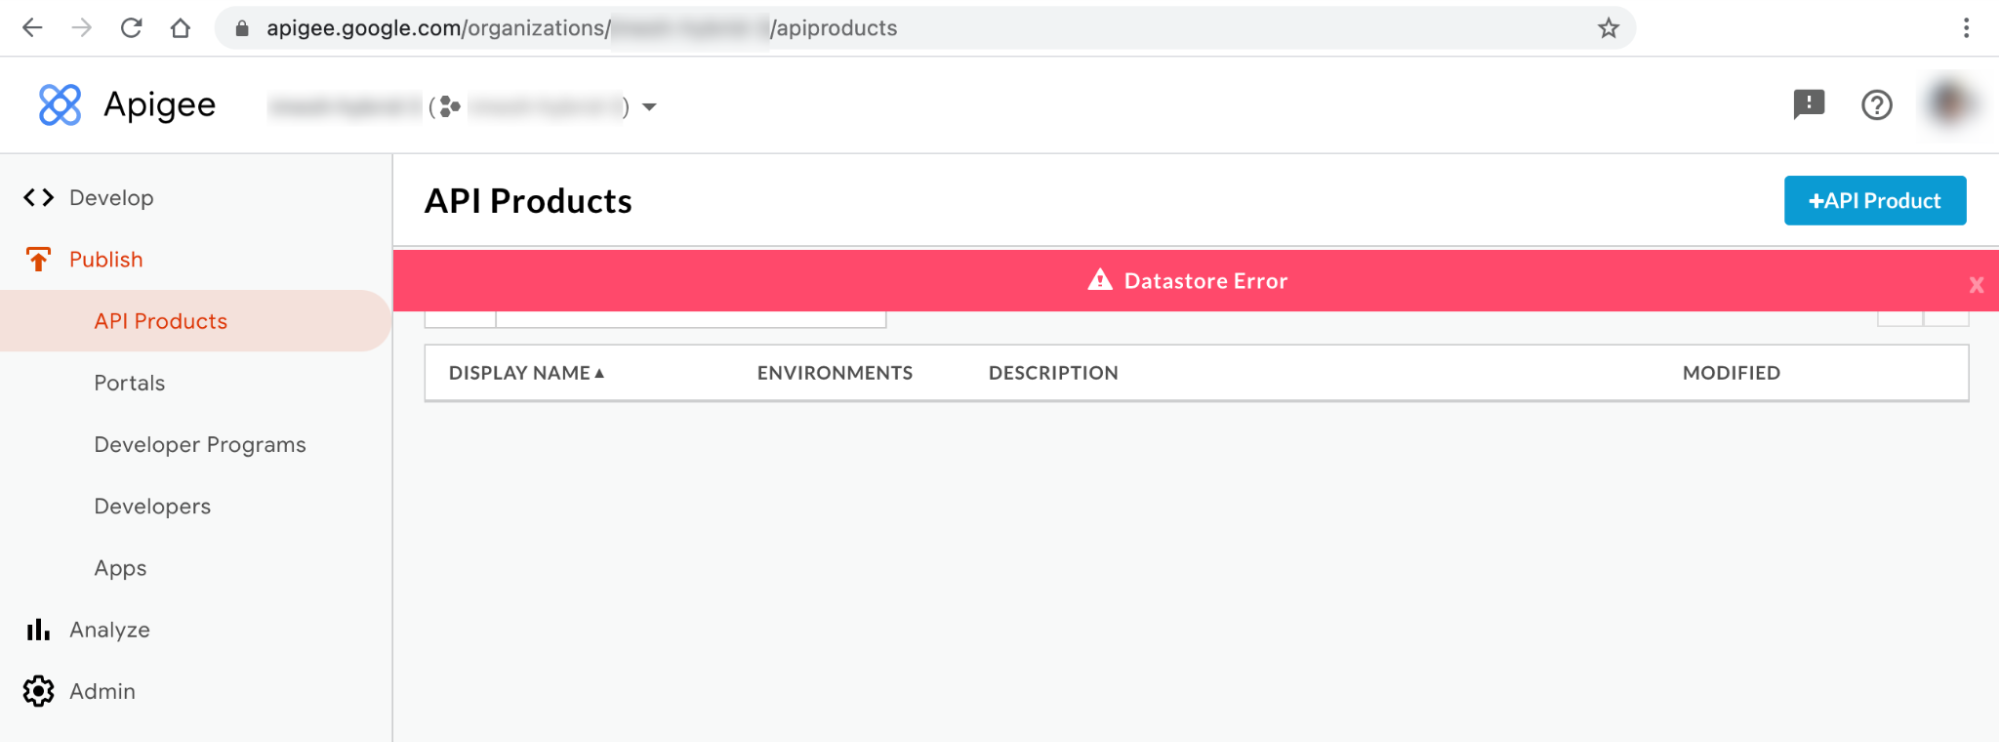
Hybrid UI error message #1: Datastore Error
You may observe the Datastore Error on the API Products and Apps pages of the hybrid UI as shown below:
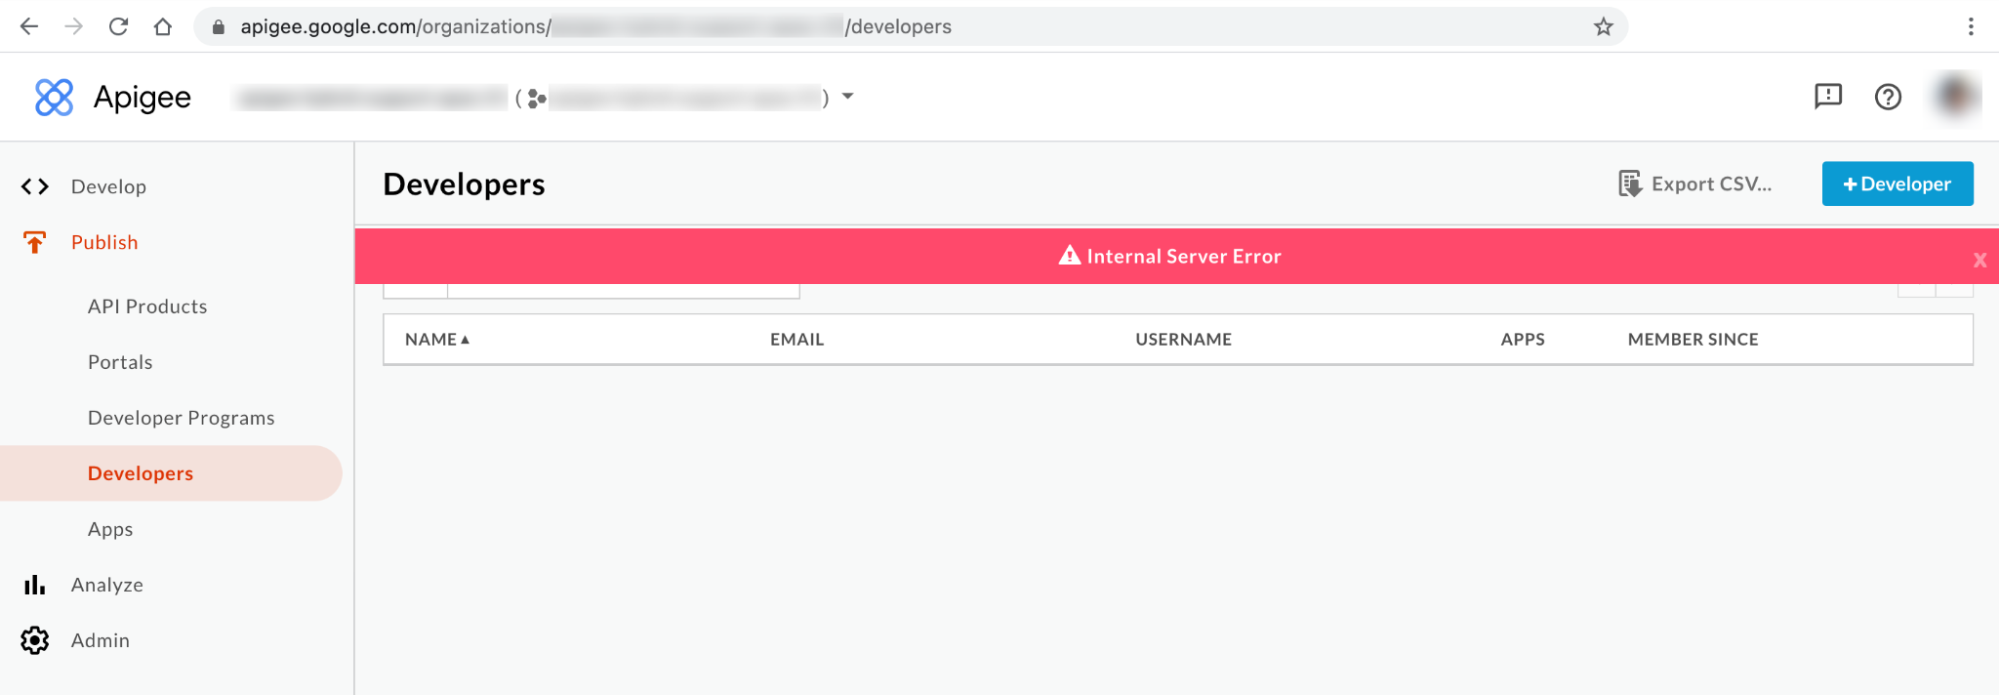
Hybrid UI error message #2: Internal Server Error
You may observe Internal Server Error on the Developers page of the UI as shown below:
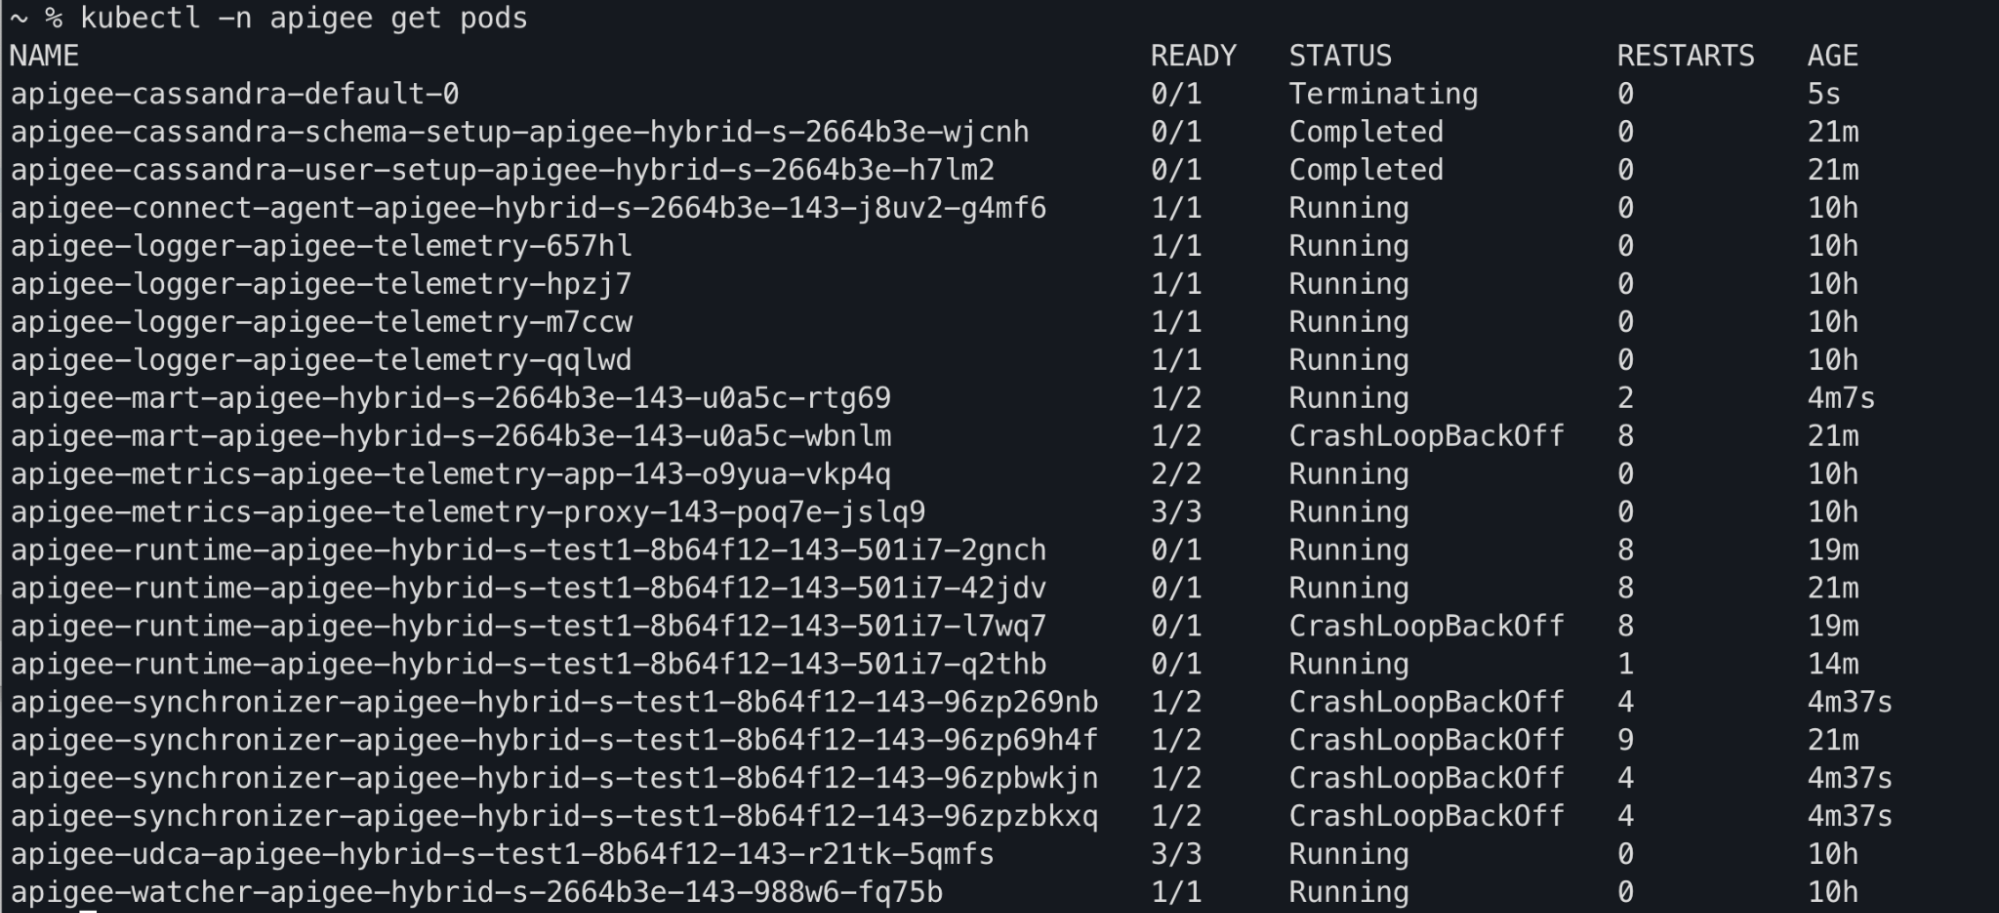
Kubectl command output
You may observe apiege-mart, apigee-runtime and apigee-
synchronizer pod statuses being changed to CrashLoopBackOff in the
kubectl get pods command output:
Component log error messages
You will observe the following liveness probe failure errors in the apigee-runtime
pod logs in Apigee hybrid releases >= 1.4.0:
{"timestamp":"1621575431454","level":"ERROR","thread":"qtp365724939-205","mdc":{"targetpath":"/v1/pr
obes/live"},"logger":"REST","message":"Error occurred : probe failed Probe cps-datastore-
connectivity-liveliness-probe failed due to com.apigee.probe.model.ProbeFailedException{ code =
cps.common.datastoreConnectionNotHealthy, message = Datastore connection not healthy, associated
contexts =
[]}\n\n\tcom.apigee.probe.ProbeAPI.getResponse(ProbeAPI.java:66)\n\tcom.apigee.probe.ProbeAPI.getLiv
eStatus(ProbeAPI.java:55)\n\tsun.reflect.GeneratedMethodAccessor52.invoke(Unknown
Source)\n\tsun.reflect.DelegatingMethodAccessorImpl.invoke(DelegatingMethodAccessorImpl.java:43)\n\t
","context":"apigee-service-
logs","severity":"ERROR","class":"com.apigee.rest.framework.container.ExceptionMapper","method":"toR
esponse"}

{"timestamp":"1621575431454","level":"ERROR","thread":"qtp365724939-205","mdc":{"targetpath":"/v1/pr
obes/live"},"logger":"REST","message":"Returning error response : ErrorResponse{errorCode =
probe.ProbeRunError, errorMessage = probe failed Probe cps-datastore-connectivity-liveliness-probe
failed due to com.apigee.probe.model.ProbeFailedException{ code =
cps.common.datastoreConnectionNotHealthy, message = Datastore connection not healthy, associated
contexts = []}}","context":"apigee-service-
logs","severity":"ERROR","class":"com.apigee.rest.framework.container.ExceptionMapper","method":"toR
esponse"}
You will observe the following Cannot build a cluster without contact points error
in apigee-synchronizer pod logs in Apigee hybrid releases >= 1.4.0:
{"timestamp":"1621575636434","level":"ERROR","thread":"main","logger":"KERNEL.DEPLOYMENT","message":
"ServiceDeployer.deploy() : Got a life cycle exception while starting service [SyncService, Cannot
build a cluster without contact points] : {}","context":"apigee-service-
logs","exception":"java.lang.IllegalArgumentException: Cannot build a cluster without contact
points\n\tat com.datastax.driver.core.Cluster.checkNotEmpty(Cluster.java:134)\n\tat
com.datastax.driver.core.Cluster.<init>(Cluster.java:127)\n\tat
com.datastax.driver.core.Cluster.buildFrom(Cluster.java:193)\n\tat
com.datastax.driver.core.Cluster$Builder.build(Cluster.java:1350)\n\tat
io.apigee.persistence.PersistenceContext.newCluster(PersistenceContext.java:214)\n\tat
io.apigee.persistence.PersistenceContext.<init>(PersistenceContext.java:48)\n\tat
io.apigee.persistence.ApplicationContext.<init>(ApplicationContext.java:19)\n\tat
io.apigee.runtimeconfig.service.RuntimeConfigServiceImpl.<init>(RuntimeConfigServiceImpl.java:75)
\n\tat
io.apigee.runtimeconfig.service.RuntimeConfigServiceFactory.newInstance(RuntimeConfigServiceFactory.
java:99)\n\tat
io.apigee.common.service.AbstractServiceFactory.initializeService(AbstractServiceFactory.java:301)\n
\tat
...","severity":"ERROR","class":"com.apigee.kernel.service.deployment.ServiceDeployer","method":"sta
rtService"}
You will observe the following liveness probe failure errors in the apigee-mart pod
logs in Apigee hybrid releases >= 1.4.0:
{"timestamp":"1621576757592","level":"ERROR","thread":"qtp991916558-144","mdc":{"targetpath":"/v1/pr
obes/live"},"logger":"REST","message":"Error occurred : probe failed Probe cps-datastore-
connectivity-liveliness-probe failed due to com.apigee.probe.model.ProbeFailedException{ code =
cps.common.datastoreConnectionNotHealthy, message = Datastore connection not healthy, associated
contexts =
[]}\n\n\tcom.apigee.probe.ProbeAPI.getResponse(ProbeAPI.java:66)\n\tcom.apigee.probe.ProbeAPI.getLiv
eStatus(ProbeAPI.java:55)\n\tsun.reflect.NativeMethodAccessorImpl.invoke0(Native
Method)\n\tsun.reflect.NativeMethodAccessorImpl.invoke(NativeMethodAccessorImpl.java:62)\n\t","conte
xt":"apigee-service-
logs","severity":"ERROR","class":"com.apigee.rest.framework.container.ExceptionMapper","method":"toR
esponse"}

{"timestamp":"1621576757593","level":"ERROR","thread":"qtp991916558-144","mdc":{"targetpath":"/v1/pr
obes/live"},"logger":"REST","message":"Returning error response : ErrorResponse{errorCode =
probe.ProbeRunError, errorMessage = probe failed Probe cps-datastore-connectivity-liveliness-probe
failed due to com.apigee.probe.model.ProbeFailedException{ code =
cps.common.datastoreConnectionNotHealthy, message = Datastore connection not healthy, associated
contexts = []}}","context":"apigee-service-
logs","severity":"ERROR","class":"com.apigee.rest.framework.container.ExceptionMapper","method":"toR
esponse"}
Information about No active runtime pods error
In the Apigee hybrid 1.4.0 release, the liveness probe feature was added to the
apigee-runtime and apigee-mart pods to check the status of the
Cassandra pods. If all Cassandra pods become unavailable, then the liveness probes of the
apigee-runtime and apigee-mart pods will fail. Thus, the
apigee-runtime and apigee-mart pods will go into the
CrashLoopBackOff state causing deployments of API proxies to fail with the warning
No active runtime pods.
The apigee-synchronizer pod will also go to the CrashLoopBackOff state
because of Cassandra pods being unavailable.
Possible causes
Here are a few possible causes for this error:
| Cause | Description |
|---|---|
| Cassandra pods are down | Cassandra pods are down; therefore, apigee-runtime pods will not be able to communicate with the Cassandra database. |
| Cassandra replica configured with only one pod | Having only one Cassandra pod could become a single point of failure. |
Cause: Cassandra pods are down
During the API proxy deployment process, the apigee-runtime pods connect to the
Cassandra database to fetch resources, such as Key Value Maps (KVMs) and caches, defined in the API proxy. If there are no
Cassandra pods running, then apigee-runtime pods will not be able to connect to the
Cassandra database. This leads to the API Proxy deployment failure.
Diagnosis
- List Cassandra pods:
kubectl -n apigee get pods -l app=apigee-cassandra
Sample output 1:
NAME                         READY   STATUS    RESTARTS   AGE
apigee-cassandra-default-0   0/1     Pending   0          9m23s
Sample output 2:
NAME                 READY   STATUS            RESTARTS   AGE
apigee-cassandra-0   0/1     CrashLoopBackoff  0          10m
- Verify the status of each Cassandra pod. The status of all Cassandra pods should be in the
Runningstate. If any of the Cassandra pods are in a different state, that could be the reason for this issue. Perform the following steps to resolve the issue:
Resolution
- If any of the Cassandra pods are in the
Pendingstate, refer to Cassandra pods are stuck in the Pending state to troubleshoot and resolve the issue. - If any of the Cassandra pods are in
CrashLoopBackoffstate, refer to Cassandra pods are stuck in the CrashLoopBackoff state to troubleshoot and resolve the issue.Sample output:
kubectl -n apigee get pods -l app=apigee-runtime
NAME                                                           READY   STATUS    RESTARTS   AGE
apigee-runtime-apigee-hybrid-s-test1-8b64f12-143-501i7-2gnch   1/1     Running   13         43m
apigee-runtime-apigee-hybrid-s-test1-8b64f12-143-501i7-42jdv   1/1     Running   13         45m
apigee-runtime-apigee-hybrid-s-test1-8b64f12-143-501i7-l7wq7   1/1     Running   13         43m
apigee-runtime-apigee-hybrid-s-test1-8b64f12-143-501i7-q2thb   1/1     Running   8          38m
kubectl -n apigee get pods -l app=apigee-mart
NAME                                                  READY   STATUS    RESTARTS   AGE
apigee-mart-apigee-hybrid-s-2664b3e-143-u0a5c-rtg69   2/2     Running   8          28m
kubectl -n apigee get pods -l app=apigee-synchronizer
NAME                                                              READY   STATUS    RESTARTS   AGE
apigee-synchronizer-apigee-hybrid-s-test1-8b64f12-143-96zp269nb   2/2     Running   10         29m
apigee-synchronizer-apigee-hybrid-s-test1-8b64f12-143-96zp2w2jp   2/2     Running   0          4m40s
apigee-synchronizer-apigee-hybrid-s-test1-8b64f12-143-96zpkfkvq   2/2     Running   0          4m40s
apigee-synchronizer-apigee-hybrid-s-test1-8b64f12-143-96zpxmzhn   2/2     Running   0          4m40s
Cause: Cassandra replica configured with only one pod
If Cassandra replica count is configured to one, there will only be one Cassandra pod available
in the runtime. As a result, apigee-runtime pods may encounter connectivity issues
if that Cassandra pod becomes unavailable for a certain time period.
Diagnosis
- Get the Cassandra stateful set and check the current replica count:
kubectl -n apigee get statefulsets -l app=apigee-cassandra
Sample output:
NAME                               READY           AGE
apigee-cassandra-default           1/1             21m
- If the replica count is configured to 1, then perform the following steps to increase it to a higher number.
Resolution
Apigee hybrid non-production deployments may have Cassandra replica count set to 1. If high availability of Cassandra is important in non- production deployments, increase the replica count to 3 to resolve this problem.
Perform the following steps to resolve this issue:
- Update the
overrides.yamlfile and set Cassandra replica count to 3:cassandra: replicaCount: 3
For Cassandra configuration information, see Configuration property reference.
- Apply the above configuration using the
apigeectlCLI:cd path/to/hybrid-files apigeectl apply -f overrides/overrides.yaml
- Get the Cassandra stateful set and check the current replica count:
kubectl -n get statefulsets -l app=apigee-cassandra
Sample output:
NAME                              READY         AGE
apigee-cassandra-default          3/3           27m
- Get the Cassandra pods and check the current instance count. If all pods are not ready and
in the
Runningstate wait for the new Cassandra pods to be created and activated:kubectl -n get pods -l app=apigee-cassandra
Sample output:
NAME                         READY   STATUS    RESTARTS   AGE
apigee-cassandra-default-0   1/1     Running   0          29m
apigee-cassandra-default-1   1/1     Running   0          21m
apigee-cassandra-default-2   1/1     Running   0          19m
Sample output:
kubectl -n apigee get pods -l app=apigee-runtime
NAME                                                           READY   STATUS    RESTARTS   AGE
apigee-runtime-apigee-hybrid-s-test1-8b64f12-143-501i7-2gnch   1/1     Running   13         43m
apigee-runtime-apigee-hybrid-s-test1-8b64f12-143-501i7-42jdv   1/1     Running   13         45m
apigee-runtime-apigee-hybrid-s-test1-8b64f12-143-501i7-l7wq7   1/1     Running   13         43m
apigee-runtime-apigee-hybrid-s-test1-8b64f12-143-501i7-q2thb   1/1     Running   8          38m
kubectl -n apigee get pods -l app=apigee-mart
NAME                                                  READY   STATUS    RESTARTS   AGE
apigee-mart-apigee-hybrid-s-2664b3e-143-u0a5c-rtg69   2/2     Running   8          28m
kubectl -n apigee get pods -l app=apigee-synchronizer
NAME                                                              READY   STATUS    RESTARTS   AGE
apigee-synchronizer-apigee-hybrid-s-test1-8b64f12-143-96zp269nb   2/2     Running   10         29m
apigee-synchronizer-apigee-hybrid-s-test1-8b64f12-143-96zp2w2jp   2/2     Running   0          4m40s
apigee-synchronizer-apigee-hybrid-s-test1-8b64f12-143-96zpkfkvq   2/2     Running   0          4m40s
apigee-synchronizer-apigee-hybrid-s-test1-8b64f12-143-96zpxmzhn   2/2     Running   0          4m40s
Must gather diagnostic information
If the problem persists even after following the above instructions, gather the following diagnostic information, and then contact Apigee Support.
- Google Cloud Project ID
- Apigee hybrid/Apigee organization
- For Apigee hybrid: the
overrides.yaml, masking any sensitive information - Kubernetes pod status in all namespaces:
kubectl get pods -A > kubectl-pod-status`date +%Y.%m.%d_%H.%M.%S`.txt
- Kubernetes cluster-info dump:
# generate kubernetes cluster-info dump
kubectl cluster-info dump -A --output-directory=/tmp/kubectl-cluster-info-dump
# zip kubernetes cluster-info dump
zip -r kubectl-cluster-info-dump`date +%Y.%m.%d_%H.%M.%S`.zip /tmp/kubectl-cluster-info-dump/*